Area Code 409 Map & Demographics
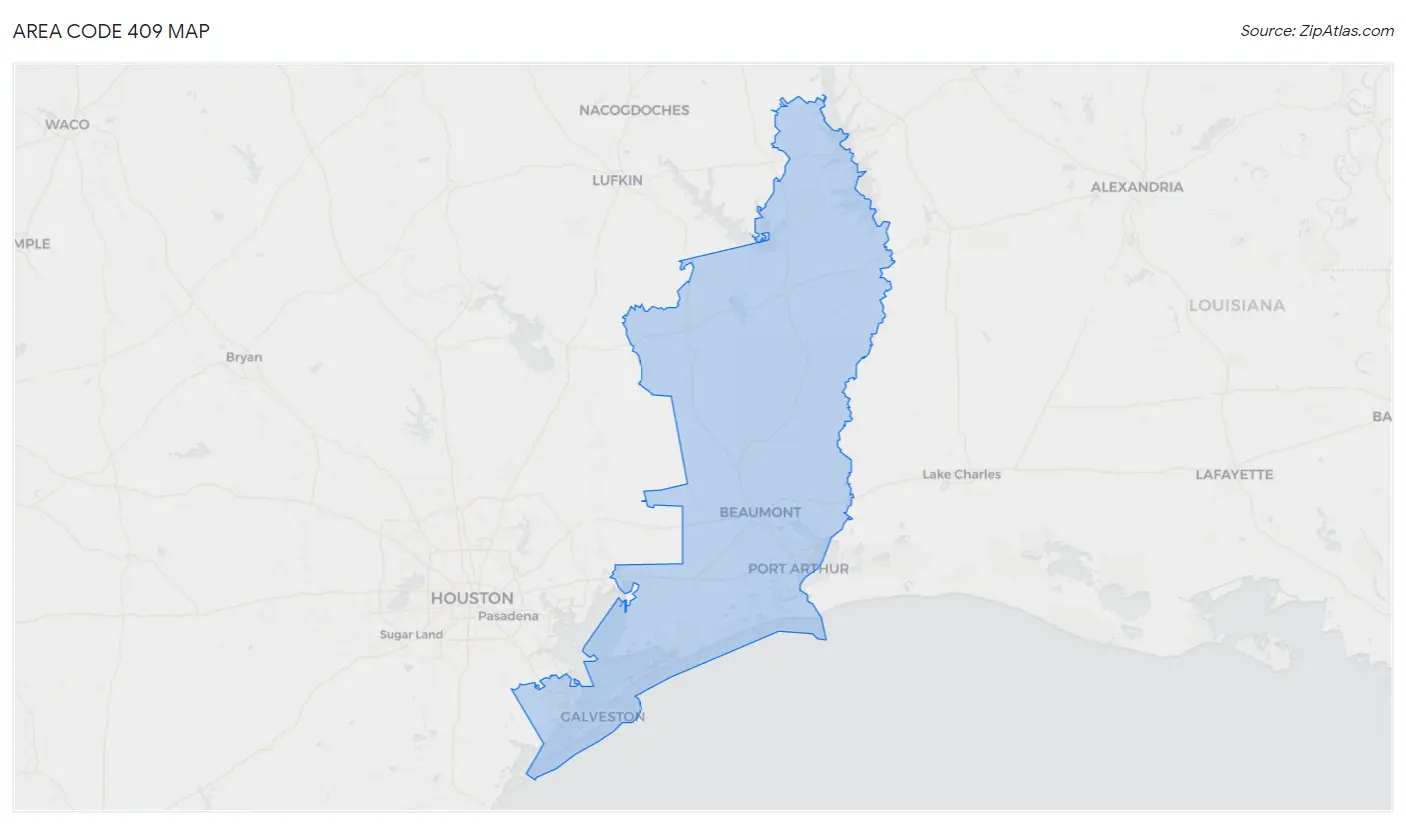
Area Code 409 Map
Area Code 409 Overview
$32,246
PER CAPITA INCOME
$74,911
AVG FAMILY INCOME
$61,218
AVG HOUSEHOLD INCOME
39.7%
WAGE / INCOME GAP [ % ]
60.3¢/ $1
WAGE / INCOME GAP [ $ ]
$11,958
FAMILY INCOME DEFICIT
27.39
INEQUALITY / GINI INDEX
649,887
TOTAL POPULATION
327,320
MALE POPULATION
322,567
FEMALE POPULATION
101.47
MALES / 100 FEMALES
98.55
FEMALES / 100 MALES
41.9
MEDIAN AGE
3.1
AVG FAMILY SIZE
2.6
AVG HOUSEHOLD SIZE
290,472
LABOR FORCE [ PEOPLE ]
56.4%
PERCENT IN LABOR FORCE
8.1%
UNEMPLOYMENT RATE
Income in Area Code 409
Income Overview in Area Code 409
Per Capita Income in Area Code 409 is $32,246, while median incomes of families and households are $74,911 and $61,218 respectively.
| Characteristic | Number | Measure |
| Per Capita Income | 649,887 | $32,246 |
| Median Family Income | 162,748 | $74,911 |
| Mean Family Income | 162,748 | $5,943,614 |
| Median Household Income | 245,898 | $61,218 |
| Mean Household Income | 245,898 | $5,085,637 |
| Income Deficit | 162,748 | $11,958 |
| Wage / Income Gap (%) | 649,887 | 39.65% |
| Wage / Income Gap ($) | 649,887 | 60.35¢ per $1 |
| Gini / Inequality Index | 649,887 | 27.39 |
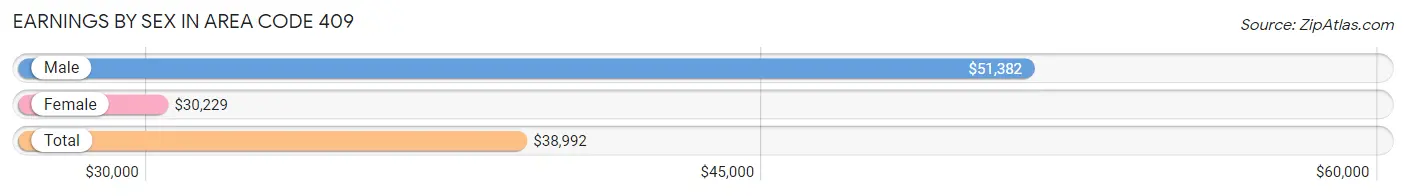
Earnings by Sex in Area Code 409
Average Earnings in Area Code 409 are $38,992, $51,382 for men and $30,229 for women, a difference of 41.2%.
| Sex | Number | Average Earnings |
| Male | 167,108 (54.1%) | $51,382 |
| Female | 141,594 (45.9%) | $30,229 |
| Total | 308,702 (100.0%) | $38,992 |
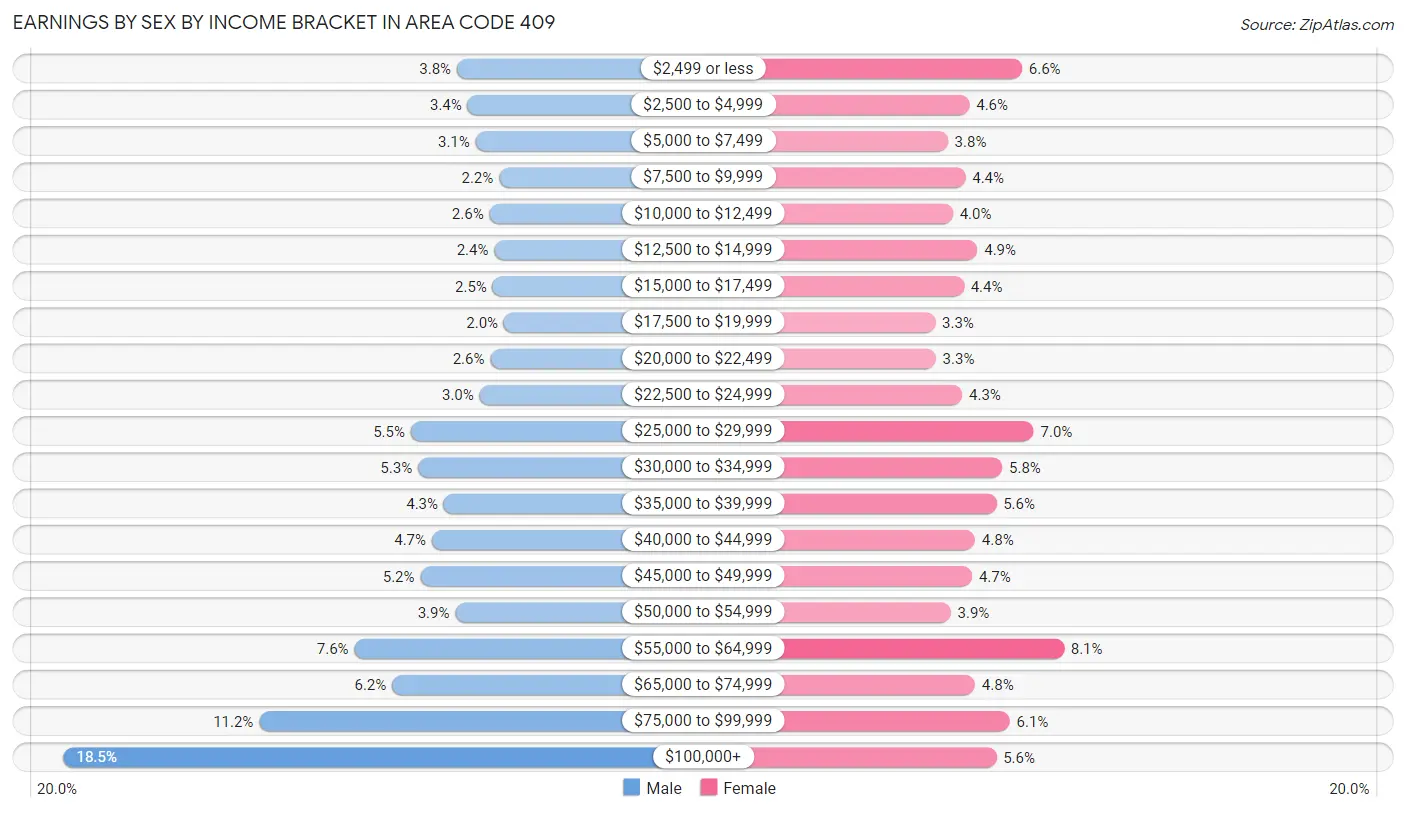
Earnings by Sex by Income Bracket in Area Code 409
The most common earnings brackets in Area Code 409 are $100,000+ for men (30,984 | 18.5%) and $55,000 to $64,999 for women (11,508 | 8.1%).
| Income | Male | Female |
| $2,499 or less | 6,356 (3.8%) | 9,286 (6.6%) |
| $2,500 to $4,999 | 5,690 (3.4%) | 6,495 (4.6%) |
| $5,000 to $7,499 | 5,185 (3.1%) | 5,355 (3.8%) |
| $7,500 to $9,999 | 3,705 (2.2%) | 6,281 (4.4%) |
| $10,000 to $12,499 | 4,319 (2.6%) | 5,615 (4.0%) |
| $12,500 to $14,999 | 4,014 (2.4%) | 6,921 (4.9%) |
| $15,000 to $17,499 | 4,103 (2.5%) | 6,202 (4.4%) |
| $17,500 to $19,999 | 3,416 (2.0%) | 4,683 (3.3%) |
| $20,000 to $22,499 | 4,260 (2.5%) | 4,716 (3.3%) |
| $22,500 to $24,999 | 4,924 (2.9%) | 6,119 (4.3%) |
| $25,000 to $29,999 | 9,245 (5.5%) | 9,916 (7.0%) |
| $30,000 to $34,999 | 8,798 (5.3%) | 8,244 (5.8%) |
| $35,000 to $39,999 | 7,163 (4.3%) | 7,926 (5.6%) |
| $40,000 to $44,999 | 7,928 (4.7%) | 6,801 (4.8%) |
| $45,000 to $49,999 | 8,647 (5.2%) | 6,640 (4.7%) |
| $50,000 to $54,999 | 6,455 (3.9%) | 5,511 (3.9%) |
| $55,000 to $64,999 | 12,763 (7.6%) | 11,508 (8.1%) |
| $65,000 to $74,999 | 10,418 (6.2%) | 6,802 (4.8%) |
| $75,000 to $99,999 | 18,735 (11.2%) | 8,644 (6.1%) |
| $100,000+ | 30,984 (18.5%) | 7,929 (5.6%) |
| Total | 167,108 (100.0%) | 141,594 (100.0%) |
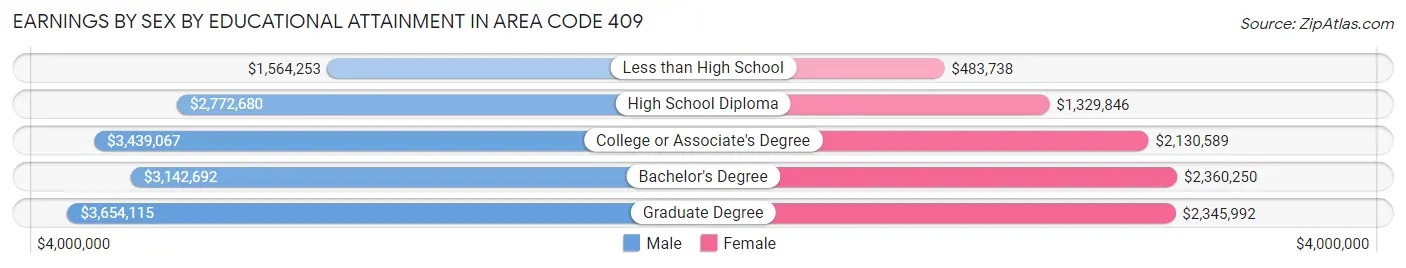
Earnings by Sex by Educational Attainment in Area Code 409
Average earnings in Area Code 409 are $3,349,415 for men and $2,047,753 for women, a difference of 38.9%. Men with an educational attainment of graduate degree enjoy the highest average annual earnings of $3,654,115, while those with less than high school education earn the least with $1,564,253. Women with an educational attainment of bachelor's degree earn the most with the average annual earnings of $2,360,250, while those with less than high school education have the smallest earnings of $483,738.
| Educational Attainment | Male Income | Female Income |
| Less than High School | $1,564,253 | $483,738 |
| High School Diploma | $2,772,680 | $1,329,846 |
| College or Associate's Degree | $3,439,067 | $2,130,589 |
| Bachelor's Degree | $3,142,692 | $2,360,250 |
| Graduate Degree | $3,654,115 | $2,345,992 |
| Total | $3,349,415 | $2,047,753 |
Family Income in Area Code 409
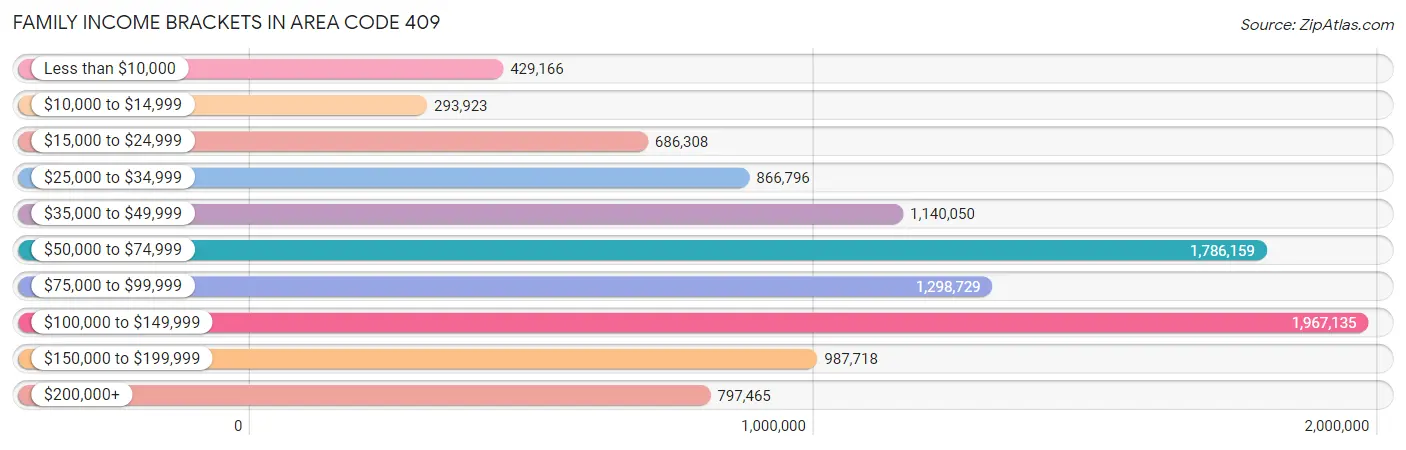
Family Income Brackets in Area Code 409
According to the Area Code 409 family income data, there are 1,967,135 families falling into the $100,000 to $149,999 income range, which is the most common income bracket and makes up 1,208.7% of all families. Conversely, the $10,000 to $14,999 income bracket is the least frequent group with only 293,923 families (180.6%) belonging to this category.
| Income Bracket | # Families | % Families |
| Less than $10,000 | 429,166 | 263.7% |
| $10,000 to $14,999 | 293,923 | 180.6% |
| $15,000 to $24,999 | 686,308 | 421.7% |
| $25,000 to $34,999 | 866,796 | 532.6% |
| $35,000 to $49,999 | 1,140,050 | 700.5% |
| $50,000 to $74,999 | 1,786,159 | 1,097.5% |
| $75,000 to $99,999 | 1,298,729 | 798.0% |
| $100,000 to $149,999 | 1,967,135 | 1,208.7% |
| $150,000 to $199,999 | 987,718 | 606.9% |
| $200,000+ | 797,465 | 490.0% |
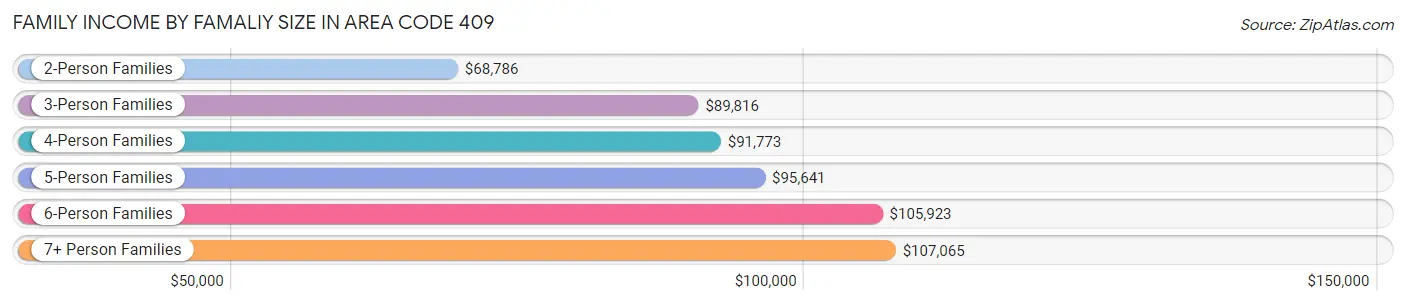
Family Income by Famaliy Size in Area Code 409
7+ person families (2,615 | 1.6%) account for the highest median family income in Area Code 409 with $107,065 per family, while 2-person families (77,945 | 47.9%) have the highest median income of $34,393 per family member.
| Income Bracket | # Families | Median Income |
| 2-Person Families | 77,945 (47.9%) | $68,786 |
| 3-Person Families | 37,145 (22.8%) | $89,816 |
| 4-Person Families | 26,147 (16.1%) | $91,773 |
| 5-Person Families | 13,822 (8.5%) | $95,640 |
| 6-Person Families | 5,074 (3.1%) | $105,923 |
| 7+ Person Families | 2,615 (1.6%) | $107,065 |
| Total | 162,748 (100.0%) | $74,911 |
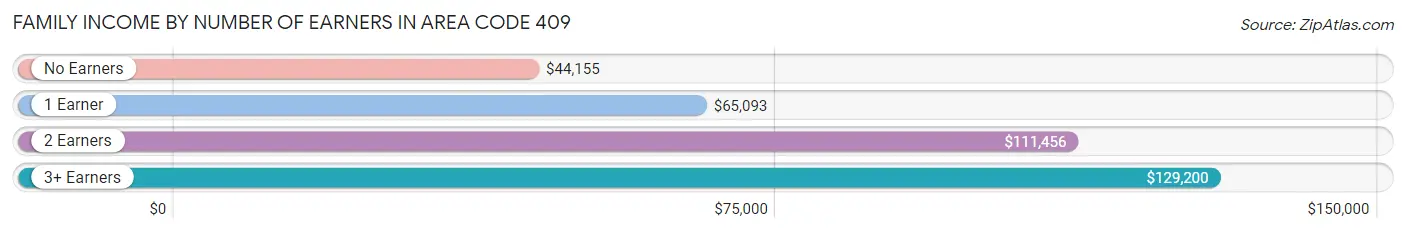
Family Income by Number of Earners in Area Code 409
The median family income in Area Code 409 is $74,911, with families comprising 3+ earners (15,291) having the highest median family income of $129,200, while families with no earners (28,335) have the lowest median family income of $44,155, accounting for 9.4% and 17.4% of families, respectively.
| Number of Earners | # Families | Median Income |
| No Earners | 28,335 (17.4%) | $44,155 |
| 1 Earner | 61,939 (38.1%) | $65,093 |
| 2 Earners | 57,183 (35.1%) | $111,456 |
| 3+ Earners | 15,291 (9.4%) | $129,200 |
| Total | 162,748 (100.0%) | $74,911 |
Household Income in Area Code 409
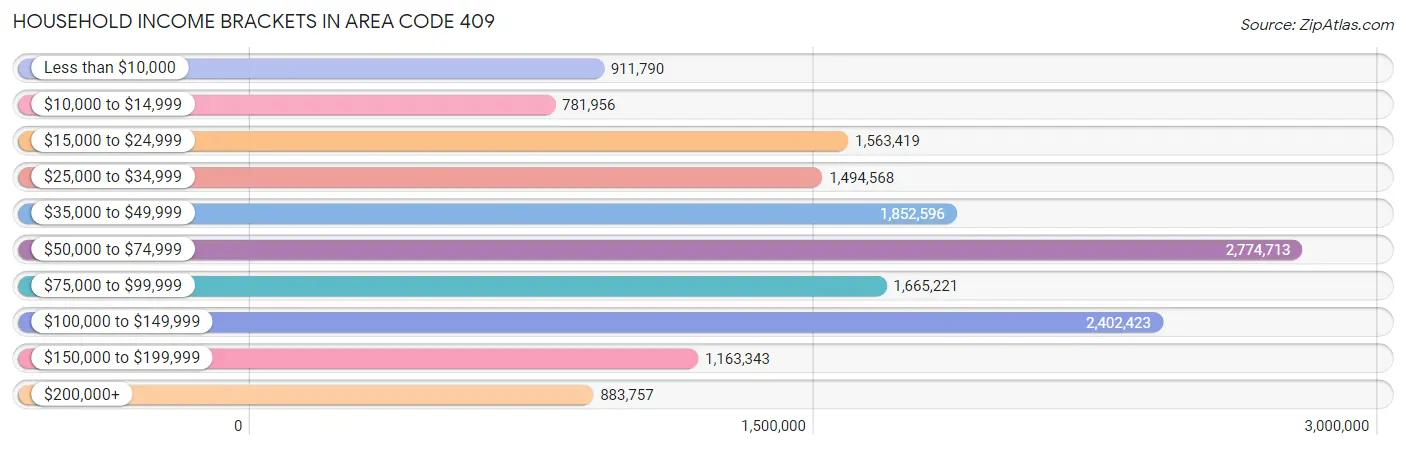
Household Income Brackets in Area Code 409
With 2,774,713 households falling in the category, the $50,000 to $74,999 income range is the most frequent in Area Code 409, accounting for 1,128.4% of all households. In contrast, only 781,956 households (318.0%) fall into the $10,000 to $14,999 income bracket, making it the least populous group.
| Income Bracket | # Households | % Households |
| Less than $10,000 | 911,790 | 370.8% |
| $10,000 to $14,999 | 781,956 | 318.0% |
| $15,000 to $24,999 | 1,563,419 | 635.8% |
| $25,000 to $34,999 | 1,494,568 | 607.8% |
| $35,000 to $49,999 | 1,852,596 | 753.4% |
| $50,000 to $74,999 | 2,774,713 | 1,128.4% |
| $75,000 to $99,999 | 1,665,221 | 677.2% |
| $100,000 to $149,999 | 2,402,423 | 977.0% |
| $150,000 to $199,999 | 1,163,343 | 473.1% |
| $200,000+ | 883,757 | 359.4% |
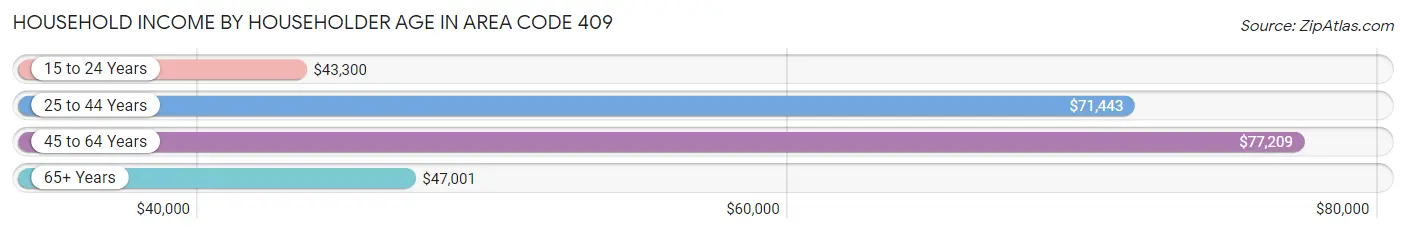
Household Income by Householder Age in Area Code 409
The median household income in Area Code 409 is $61,218, with the highest median household income of $77,209 found in the 45 to 64 years age bracket for the primary householder. A total of 90,881 households (37.0%) fall into this category. Meanwhile, the 15 to 24 years age bracket for the primary householder has the lowest median household income of $43,300, with 10,682 households (4.3%) in this group.
| Income Bracket | # Households | Median Income |
| 15 to 24 Years | 10,682 (4.3%) | $43,300 |
| 25 to 44 Years | 76,971 (31.3%) | $71,443 |
| 45 to 64 Years | 90,881 (37.0%) | $77,209 |
| 65+ Years | 67,364 (27.4%) | $47,001 |
| Total | 245,898 (100.0%) | $61,218 |
Poverty in Area Code 409
Income Below Poverty by Sex and Age in Area Code 409
With 15.2% poverty level for males and 18.5% for females among the residents of Area Code 409, under 5 year old males and 6 to 11 year old females are the most vulnerable to poverty, with 5,602 males (28.1%) and 6,694 females (27.0%) in their respective age groups living below the poverty level.
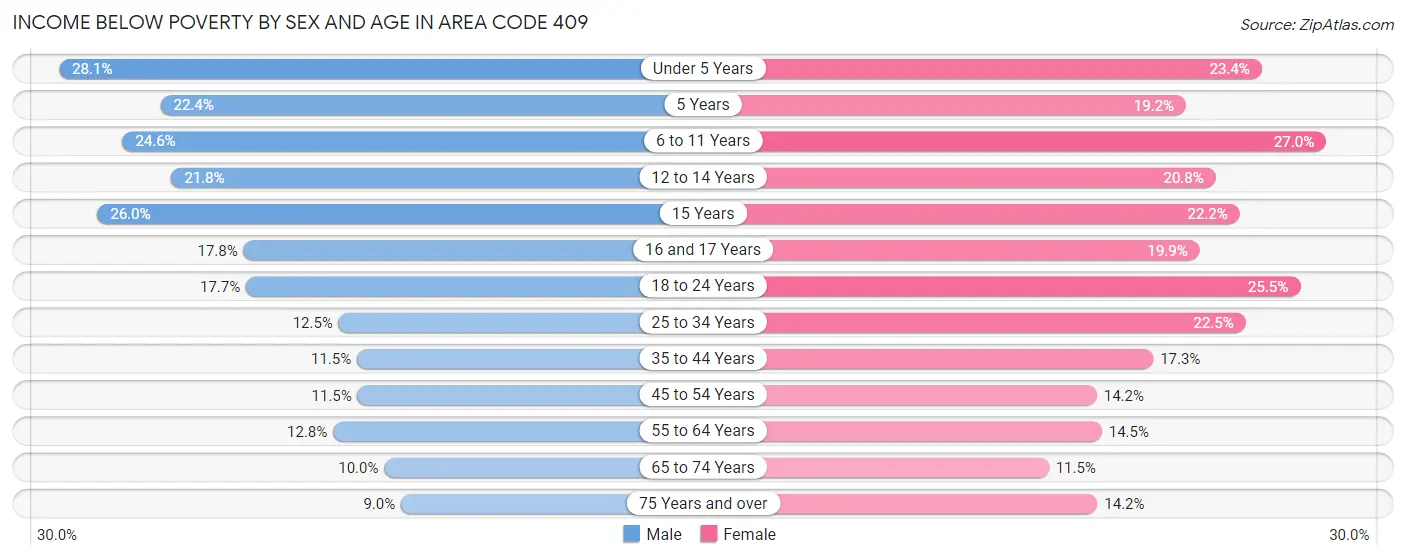
| Age Bracket | Male | Female |
| Under 5 Years | 5,602 (28.1%) | 4,422 (23.4%) |
| 5 Years | 967 (22.4%) | 796 (19.2%) |
| 6 to 11 Years | 6,263 (24.5%) | 6,694 (27.0%) |
| 12 to 14 Years | 2,900 (21.8%) | 2,597 (20.8%) |
| 15 Years | 1,069 (26.0%) | 1,000 (22.2%) |
| 16 and 17 Years | 1,468 (17.8%) | 1,676 (19.9%) |
| 18 to 24 Years | 4,795 (17.7%) | 6,699 (25.5%) |
| 25 to 34 Years | 5,195 (12.5%) | 9,255 (22.5%) |
| 35 to 44 Years | 4,251 (11.5%) | 6,803 (17.3%) |
| 45 to 54 Years | 4,176 (11.5%) | 5,337 (14.2%) |
| 55 to 64 Years | 5,330 (12.8%) | 6,254 (14.5%) |
| 65 to 74 Years | 2,986 (10.0%) | 3,771 (11.5%) |
| 75 Years and over | 1,597 (9.0%) | 3,386 (14.2%) |
| Total | 46,599 (15.2%) | 58,690 (18.5%) |
Income Above Poverty by Sex and Age in Area Code 409
According to the poverty statistics in Area Code 409, males aged 75 years and over and females aged 65 to 74 years are the age groups that are most secure financially, with 91.0% of males and 88.5% of females in these age groups living above the poverty line.
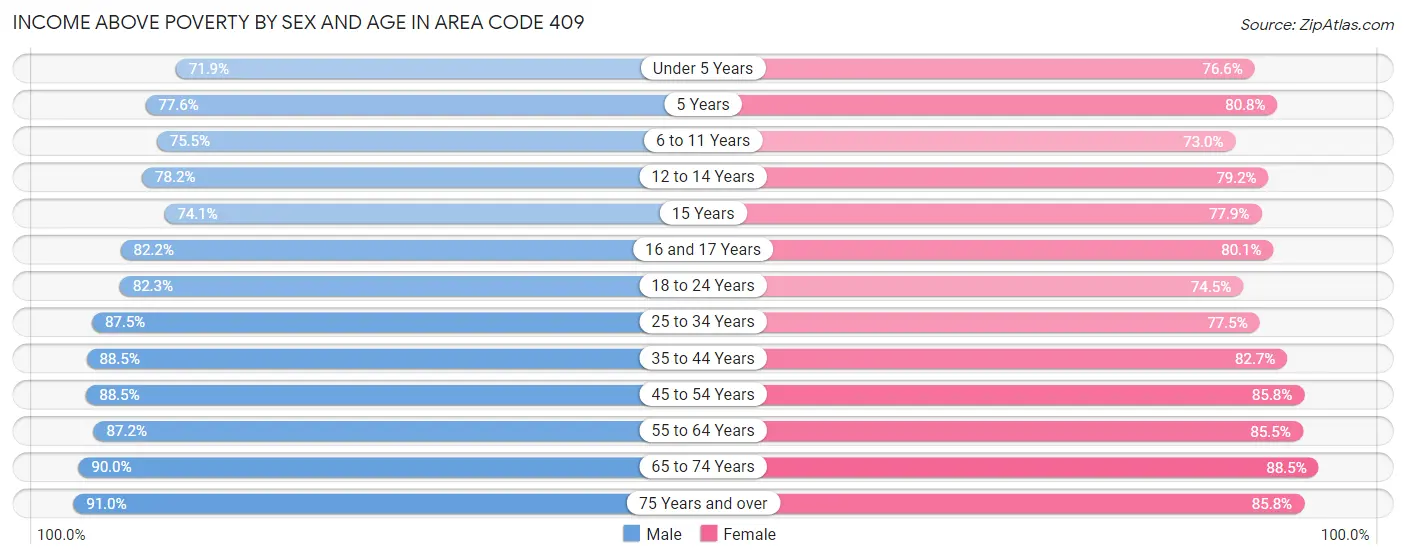
| Age Bracket | Male | Female |
| Under 5 Years | 14,351 (71.9%) | 14,490 (76.6%) |
| 5 Years | 3,344 (77.6%) | 3,358 (80.8%) |
| 6 to 11 Years | 19,249 (75.4%) | 18,131 (73.0%) |
| 12 to 14 Years | 10,383 (78.2%) | 9,882 (79.2%) |
| 15 Years | 3,051 (74.1%) | 3,515 (77.8%) |
| 16 and 17 Years | 6,775 (82.2%) | 6,739 (80.1%) |
| 18 to 24 Years | 22,336 (82.3%) | 19,546 (74.5%) |
| 25 to 34 Years | 36,348 (87.5%) | 31,906 (77.5%) |
| 35 to 44 Years | 32,731 (88.5%) | 32,422 (82.7%) |
| 45 to 54 Years | 32,248 (88.5%) | 32,253 (85.8%) |
| 55 to 64 Years | 36,241 (87.2%) | 36,941 (85.5%) |
| 65 to 74 Years | 26,962 (90.0%) | 28,955 (88.5%) |
| 75 Years and over | 16,063 (91.0%) | 20,413 (85.8%) |
| Total | 260,082 (84.8%) | 258,551 (81.5%) |
Income Below Poverty Among Married-Couple Families in Area Code 409
The poverty statistics for married-couple families in Area Code 409 show that 6.7% or 7,729 of the total 114,697 families live below the poverty line. Families with 5 or more children have the highest poverty rate of 16.0%, comprising of 116 families. On the other hand, families with no children have the lowest poverty rate of 5.0%, which includes 3,531 families.
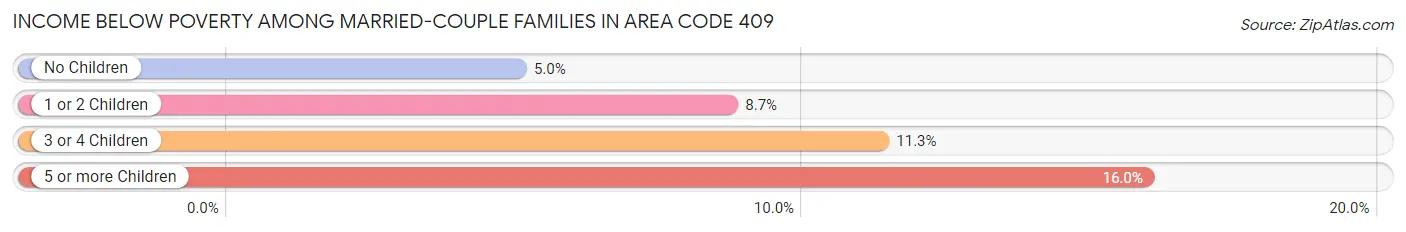
| Children | Above Poverty | Below Poverty |
| No Children | 66,667 (95.0%) | 3,531 (5.0%) |
| 1 or 2 Children | 30,609 (91.3%) | 2,920 (8.7%) |
| 3 or 4 Children | 9,081 (88.7%) | 1,162 (11.3%) |
| 5 or more Children | 611 (84.0%) | 116 (16.0%) |
| Total | 106,968 (93.3%) | 7,729 (6.7%) |
Income Below Poverty Among Single-Parent Households in Area Code 409
According to the poverty data in Area Code 409, 17.2% or 2,101 single-father households and 32.7% or 11,708 single-mother households are living below the poverty line. Among single-father households, those with 3 or 4 children have the highest poverty rate, with 544 households (48.7%) experiencing poverty. Likewise, among single-mother households, those with 3 or 4 children have the highest poverty rate, with 2,997 households (64.4%) falling below the poverty line.
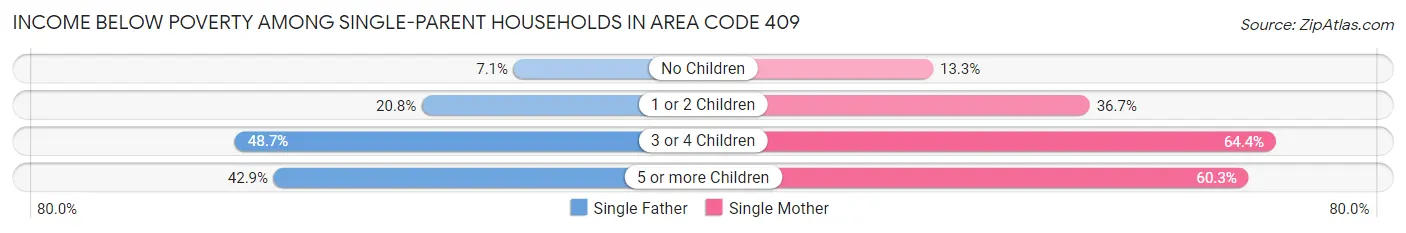
| Children | Single Father | Single Mother |
| No Children | 399 (7.1%) | 1,612 (13.3%) |
| 1 or 2 Children | 1,122 (20.8%) | 6,819 (36.7%) |
| 3 or 4 Children | 544 (48.7%) | 2,997 (64.4%) |
| 5 or more Children | 36 (42.9%) | 280 (60.3%) |
| Total | 2,101 (17.2%) | 11,708 (32.7%) |
Income Below Poverty Among Married-Couple vs Single-Parent Households in Area Code 409
The poverty data for Area Code 409 shows that 7,729 of the married-couple family households (6.7%) and 13,809 of the single-parent households (28.7%) are living below the poverty level. Within the married-couple family households, those with 5 or more children have the highest poverty rate, with 116 households (16.0%) falling below the poverty line. Among the single-parent households, those with 3 or 4 children have the highest poverty rate, with 3,541 household (61.4%) living below poverty.
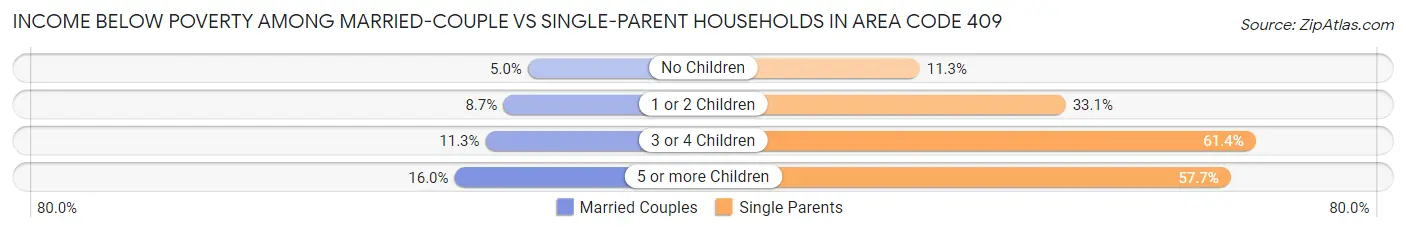
| Children | Married-Couple Families | Single-Parent Households |
| No Children | 3,531 (5.0%) | 2,011 (11.3%) |
| 1 or 2 Children | 2,920 (8.7%) | 7,941 (33.1%) |
| 3 or 4 Children | 1,162 (11.3%) | 3,541 (61.4%) |
| 5 or more Children | 116 (16.0%) | 316 (57.7%) |
| Total | 7,729 (6.7%) | 13,809 (28.7%) |
Race in Area Code 409
The most populous races in Area Code 409 are White / Caucasian (409,283 | 63.0%), Black / African American (137,021 | 21.1%), and Hispanic or Latino (127,547 | 19.6%).
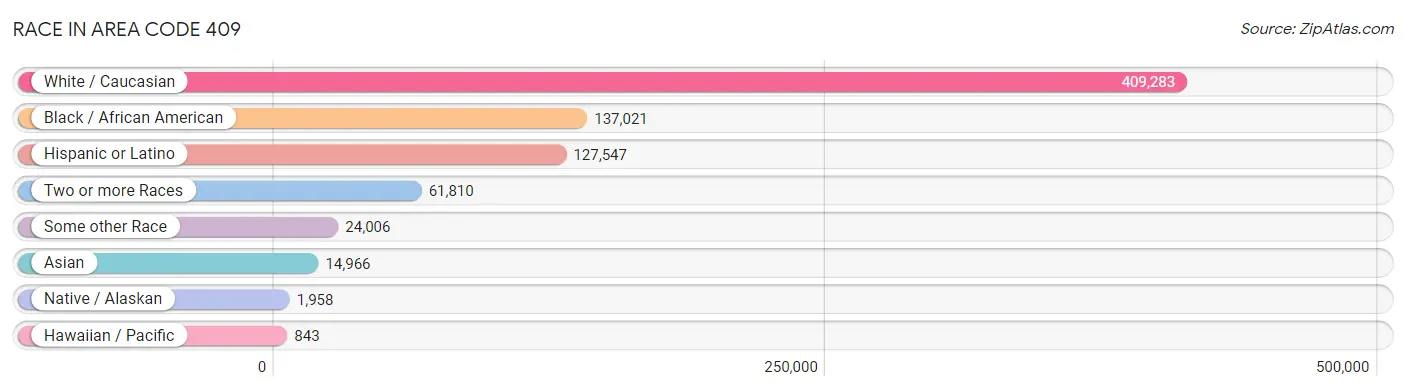
| Race | # Population | % Population |
| Asian | 14,966 | 2.3% |
| Black / African American | 137,021 | 21.1% |
| Hawaiian / Pacific | 843 | 0.1% |
| Hispanic or Latino | 127,547 | 19.6% |
| Native / Alaskan | 1,958 | 0.3% |
| White / Caucasian | 409,283 | 63.0% |
| Two or more Races | 61,810 | 9.5% |
| Some other Race | 24,006 | 3.7% |
| Total | 649,887 | 100.0% |
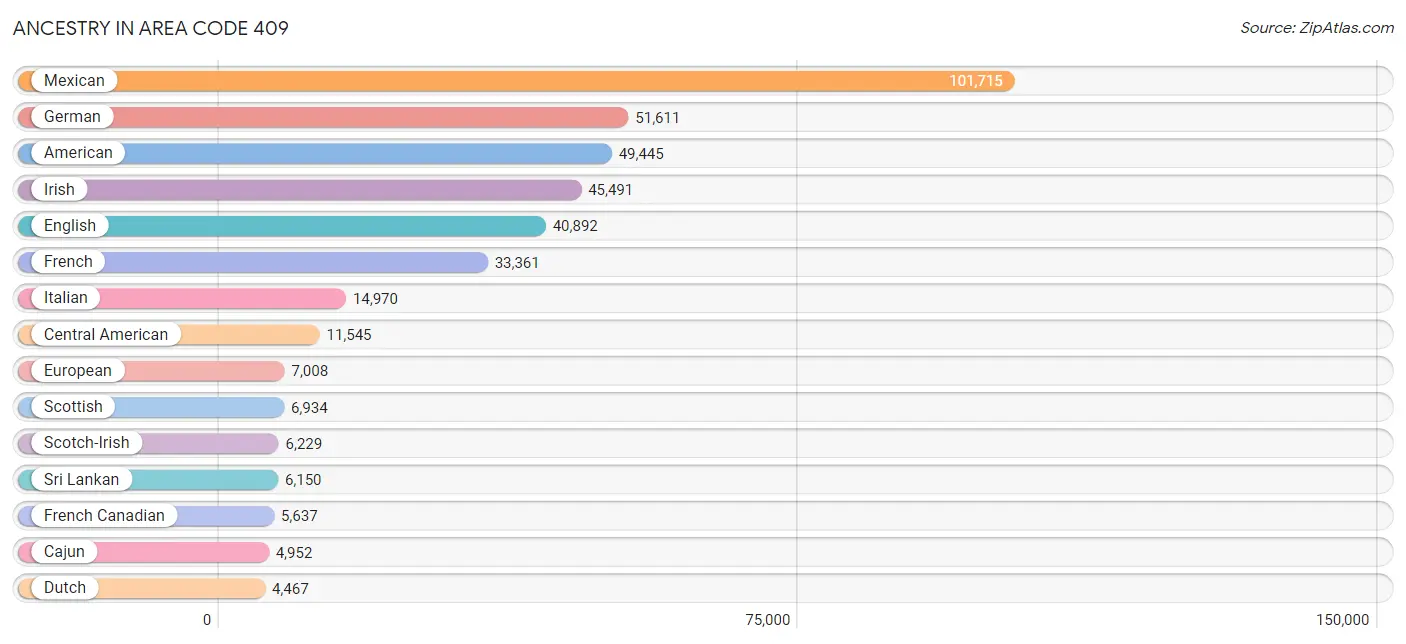
Ancestry in Area Code 409
The most populous ancestries reported in Area Code 409 are Mexican (101,715 | 15.7%), German (51,611 | 7.9%), American (49,445 | 7.6%), Irish (45,491 | 7.0%), and English (40,892 | 6.3%), together accounting for 44.5% of all Area Code 409 residents.
| Ancestry | # Population | % Population |
| African | 2,255 | 0.4% |
| Alaska Native | 13 | 0.0% |
| Alaskan Athabascan | 1 | 0.0% |
| Albanian | 87 | 0.0% |
| Alsatian | 50 | 0.0% |
| American | 49,445 | 7.6% |
| Apache | 246 | 0.0% |
| Arab | 1,238 | 0.2% |
| Argentinean | 61 | 0.0% |
| Armenian | 20 | 0.0% |
| Assyrian / Chaldean / Syriac | 64 | 0.0% |
| Australian | 6 | 0.0% |
| Austrian | 345 | 0.1% |
| Bahamian | 150 | 0.0% |
| Bangladeshi | 20 | 0.0% |
| Barbadian | 49 | 0.0% |
| Basque | 20 | 0.0% |
| Belgian | 132 | 0.0% |
| Belizean | 116 | 0.0% |
| Bhutanese | 1,027 | 0.2% |
| Blackfeet | 142 | 0.0% |
| Bolivian | 28 | 0.0% |
| Brazilian | 215 | 0.0% |
| British | 2,294 | 0.4% |
| British West Indian | 75 | 0.0% |
| Bulgarian | 53 | 0.0% |
| Burmese | 590 | 0.1% |
| Cajun | 4,952 | 0.8% |
| Canadian | 409 | 0.1% |
| Celtic | 42 | 0.0% |
| Central American | 11,545 | 1.8% |
| Central American Indian | 500 | 0.1% |
| Cherokee | 1,676 | 0.3% |
| Chickasaw | 113 | 0.0% |
| Chilean | 51 | 0.0% |
| Chippewa | 1 | 0.0% |
| Choctaw | 438 | 0.1% |
| Colombian | 1,011 | 0.2% |
| Comanche | 50 | 0.0% |
| Costa Rican | 96 | 0.0% |
| Creek | 153 | 0.0% |
| Croatian | 155 | 0.0% |
| Cuban | 1,237 | 0.2% |
| Cypriot | 4 | 0.0% |
| Czech | 2,374 | 0.4% |
| Czechoslovakian | 366 | 0.1% |
| Danish | 717 | 0.1% |
| Delaware | 50 | 0.0% |
| Dominican | 754 | 0.1% |
| Dutch | 4,467 | 0.7% |
| Dutch West Indian | 171 | 0.0% |
| Eastern European | 1,106 | 0.2% |
| Ecuadorian | 467 | 0.1% |
| Egyptian | 115 | 0.0% |
| English | 40,892 | 6.3% |
| Estonian | 13 | 0.0% |
| European | 7,008 | 1.1% |
| Filipino | 62 | 0.0% |
| Finnish | 314 | 0.1% |
| French | 33,361 | 5.1% |
| French American Indian | 62 | 0.0% |
| French Canadian | 5,637 | 0.9% |
| German | 51,611 | 7.9% |
| Ghanaian | 106 | 0.0% |
| Greek | 998 | 0.2% |
| Guamanian / Chamorro | 202 | 0.0% |
| Guatemalan | 2,331 | 0.4% |
| Guyanese | 4 | 0.0% |
| Haitian | 110 | 0.0% |
| Honduran | 3,226 | 0.5% |
| Hopi | 124 | 0.0% |
| Houma | 7 | 0.0% |
| Hungarian | 541 | 0.1% |
| Icelander | 47 | 0.0% |
| Indian (Asian) | 1,280 | 0.2% |
| Indonesian | 32 | 0.0% |
| Iranian | 329 | 0.1% |
| Iraqi | 53 | 0.0% |
| Irish | 45,491 | 7.0% |
| Iroquois | 139 | 0.0% |
| Israeli | 10 | 0.0% |
| Italian | 14,970 | 2.3% |
| Jamaican | 300 | 0.1% |
| Japanese | 280 | 0.0% |
| Jordanian | 58 | 0.0% |
| Kenyan | 6 | 0.0% |
| Korean | 3,014 | 0.5% |
| Laotian | 84 | 0.0% |
| Latvian | 7 | 0.0% |
| Lebanese | 439 | 0.1% |
| Lithuanian | 424 | 0.1% |
| Lumbee | 28 | 0.0% |
| Malaysian | 207 | 0.0% |
| Maltese | 16 | 0.0% |
| Mexican | 101,715 | 15.7% |
| Mexican American Indian | 354 | 0.1% |
| Mongolian | 107 | 0.0% |
| Moroccan | 66 | 0.0% |
| Native Hawaiian | 173 | 0.0% |
| Navajo | 210 | 0.0% |
| New Zealander | 10 | 0.0% |
| Nicaraguan | 1,434 | 0.2% |
| Nigerian | 488 | 0.1% |
| Northern European | 442 | 0.1% |
| Norwegian | 2,157 | 0.3% |
| Osage | 28 | 0.0% |
| Ottawa | 7 | 0.0% |
| Paiute | 6 | 0.0% |
| Pakistani | 285 | 0.0% |
| Palestinian | 157 | 0.0% |
| Panamanian | 105 | 0.0% |
| Pennsylvania German | 104 | 0.0% |
| Peruvian | 269 | 0.0% |
| Pima | 19 | 0.0% |
| Polish | 4,100 | 0.6% |
| Portuguese | 608 | 0.1% |
| Potawatomi | 1 | 0.0% |
| Pueblo | 27 | 0.0% |
| Puerto Rican | 3,358 | 0.5% |
| Romanian | 153 | 0.0% |
| Russian | 902 | 0.1% |
| Salvadoran | 4,235 | 0.6% |
| Samoan | 479 | 0.1% |
| Scandinavian | 949 | 0.2% |
| Scotch-Irish | 6,229 | 1.0% |
| Scottish | 6,934 | 1.1% |
| Seminole | 76 | 0.0% |
| Serbian | 55 | 0.0% |
| Sierra Leonean | 12 | 0.0% |
| Sioux | 126 | 0.0% |
| Slavic | 13 | 0.0% |
| Slovak | 144 | 0.0% |
| Slovene | 90 | 0.0% |
| Somali | 21 | 0.0% |
| South African | 46 | 0.0% |
| South American | 2,155 | 0.3% |
| South American Indian | 32 | 0.0% |
| Spaniard | 1,443 | 0.2% |
| Spanish | 971 | 0.2% |
| Spanish American | 55 | 0.0% |
| Sri Lankan | 6,150 | 0.9% |
| Subsaharan African | 3,152 | 0.5% |
| Sudanese | 10 | 0.0% |
| Swedish | 1,772 | 0.3% |
| Swiss | 304 | 0.1% |
| Syrian | 165 | 0.0% |
| Thai | 2,923 | 0.4% |
| Tohono O'Odham | 9 | 0.0% |
| Trinidadian and Tobagonian | 84 | 0.0% |
| Turkish | 56 | 0.0% |
| U.S. Virgin Islander | 7 | 0.0% |
| Ukrainian | 367 | 0.1% |
| Uruguayan | 52 | 0.0% |
| Venezuelan | 216 | 0.0% |
| Vietnamese | 116 | 0.0% |
| Welsh | 2,909 | 0.4% |
| West Indian | 26 | 0.0% |
| Yaqui | 78 | 0.0% |
| Yugoslavian | 51 | 0.0% |
| Zimbabwean | 13 | 0.0% | View All 160 Rows |
Immigrants in Area Code 409
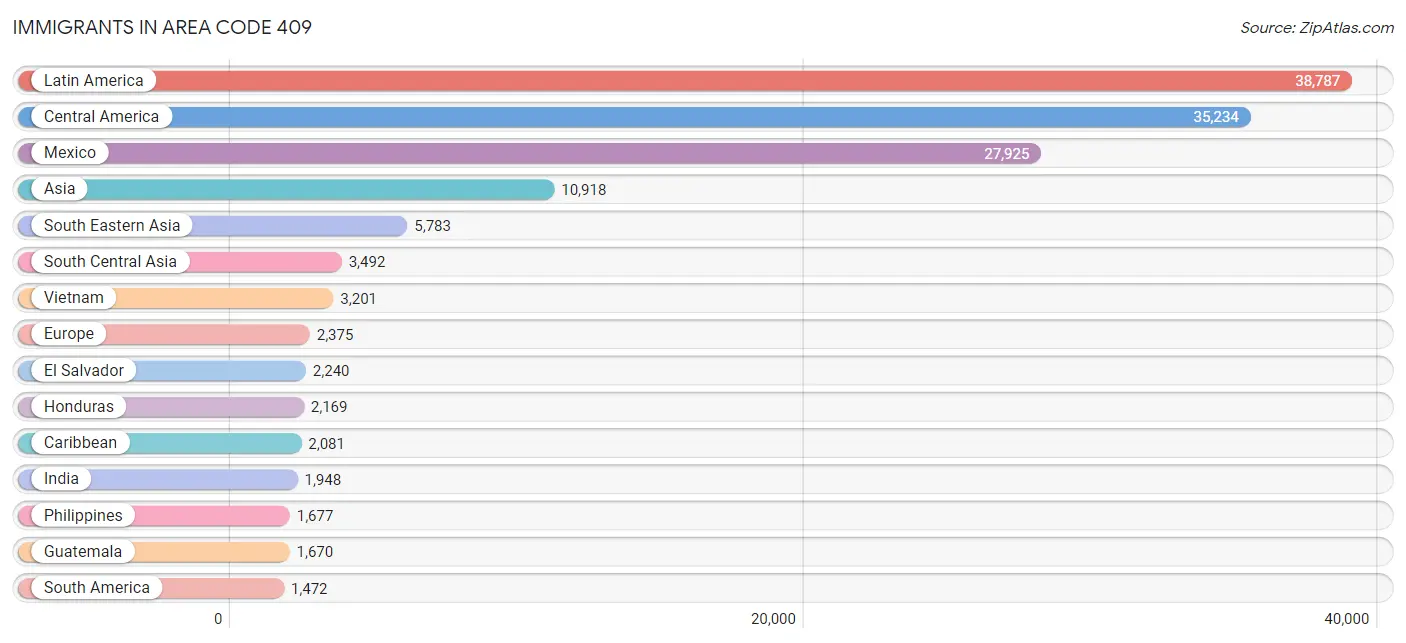
The most numerous immigrant groups reported in Area Code 409 came from Latin America (38,787 | 6.0%), Central America (35,234 | 5.4%), Mexico (27,925 | 4.3%), Asia (10,918 | 1.7%), and South Eastern Asia (5,783 | 0.9%), together accounting for 18.3% of all Area Code 409 residents.
| Immigration Origin | # Population | % Population |
| Africa | 915 | 0.1% |
| Albania | 134 | 0.0% |
| Argentina | 36 | 0.0% |
| Asia | 10,918 | 1.7% |
| Australia | 23 | 0.0% |
| Austria | 7 | 0.0% |
| Bahamas | 62 | 0.0% |
| Bangladesh | 126 | 0.0% |
| Barbados | 58 | 0.0% |
| Belgium | 25 | 0.0% |
| Belize | 10 | 0.0% |
| Bolivia | 15 | 0.0% |
| Brazil | 137 | 0.0% |
| Bulgaria | 29 | 0.0% |
| Cambodia | 232 | 0.0% |
| Cameroon | 19 | 0.0% |
| Canada | 748 | 0.1% |
| Caribbean | 2,081 | 0.3% |
| Central America | 35,234 | 5.4% |
| Chile | 1 | 0.0% |
| China | 625 | 0.1% |
| Colombia | 554 | 0.1% |
| Costa Rica | 64 | 0.0% |
| Croatia | 8 | 0.0% |
| Cuba | 1,199 | 0.2% |
| Czechoslovakia | 41 | 0.0% |
| Denmark | 12 | 0.0% |
| Dominica | 5 | 0.0% |
| Dominican Republic | 389 | 0.1% |
| Eastern Africa | 236 | 0.0% |
| Eastern Asia | 1,113 | 0.2% |
| Eastern Europe | 870 | 0.1% |
| Ecuador | 153 | 0.0% |
| Egypt | 45 | 0.0% |
| El Salvador | 2,240 | 0.3% |
| England | 235 | 0.0% |
| Ethiopia | 2 | 0.0% |
| Europe | 2,375 | 0.4% |
| France | 19 | 0.0% |
| Germany | 415 | 0.1% |
| Ghana | 54 | 0.0% |
| Greece | 135 | 0.0% |
| Grenada | 11 | 0.0% |
| Guatemala | 1,670 | 0.3% |
| Guyana | 57 | 0.0% |
| Haiti | 15 | 0.0% |
| Honduras | 2,169 | 0.3% |
| Hong Kong | 12 | 0.0% |
| Hungary | 28 | 0.0% |
| India | 1,948 | 0.3% |
| Indonesia | 85 | 0.0% |
| Iran | 264 | 0.0% |
| Iraq | 47 | 0.0% |
| Ireland | 76 | 0.0% |
| Israel | 30 | 0.0% |
| Italy | 131 | 0.0% |
| Jamaica | 116 | 0.0% |
| Japan | 203 | 0.0% |
| Jordan | 62 | 0.0% |
| Kenya | 48 | 0.0% |
| Korea | 285 | 0.0% |
| Kuwait | 19 | 0.0% |
| Laos | 150 | 0.0% |
| Latin America | 38,787 | 6.0% |
| Lebanon | 59 | 0.0% |
| Malaysia | 212 | 0.0% |
| Mexico | 27,925 | 4.3% |
| Micronesia | 106 | 0.0% |
| Middle Africa | 19 | 0.0% |
| Moldova | 108 | 0.0% |
| Morocco | 22 | 0.0% |
| Nepal | 144 | 0.0% |
| Netherlands | 93 | 0.0% |
| Nicaragua | 1,027 | 0.2% |
| Nigeria | 168 | 0.0% |
| Northern Africa | 105 | 0.0% |
| Northern Europe | 605 | 0.1% |
| Oceania | 243 | 0.0% |
| Pakistan | 920 | 0.1% |
| Panama | 114 | 0.0% |
| Peru | 264 | 0.0% |
| Philippines | 1,677 | 0.3% |
| Poland | 61 | 0.0% |
| Portugal | 1 | 0.0% |
| Romania | 40 | 0.0% |
| Russia | 294 | 0.1% |
| Saudi Arabia | 114 | 0.0% |
| Scotland | 50 | 0.0% |
| Senegal | 7 | 0.0% |
| Sierra Leone | 12 | 0.0% |
| Singapore | 5 | 0.0% |
| Somalia | 11 | 0.0% |
| South Africa | 201 | 0.0% |
| South America | 1,472 | 0.2% |
| South Central Asia | 3,492 | 0.5% |
| South Eastern Asia | 5,783 | 0.9% |
| Southern Europe | 313 | 0.1% |
| Spain | 46 | 0.0% |
| Sri Lanka | 90 | 0.0% |
| Sudan | 10 | 0.0% |
| Sweden | 11 | 0.0% |
| Switzerland | 9 | 0.0% |
| Syria | 72 | 0.0% |
| Taiwan | 83 | 0.0% |
| Thailand | 196 | 0.0% |
| Trinidad and Tobago | 169 | 0.0% |
| Turkey | 30 | 0.0% |
| Uganda | 11 | 0.0% |
| Ukraine | 127 | 0.0% |
| Uruguay | 43 | 0.0% |
| Venezuela | 212 | 0.0% |
| Vietnam | 3,201 | 0.5% |
| Western Africa | 241 | 0.0% |
| Western Asia | 481 | 0.1% |
| Western Europe | 568 | 0.1% |
| Zimbabwe | 59 | 0.0% | View All 116 Rows |
Sex and Age in Area Code 409
Sex and Age in Area Code 409
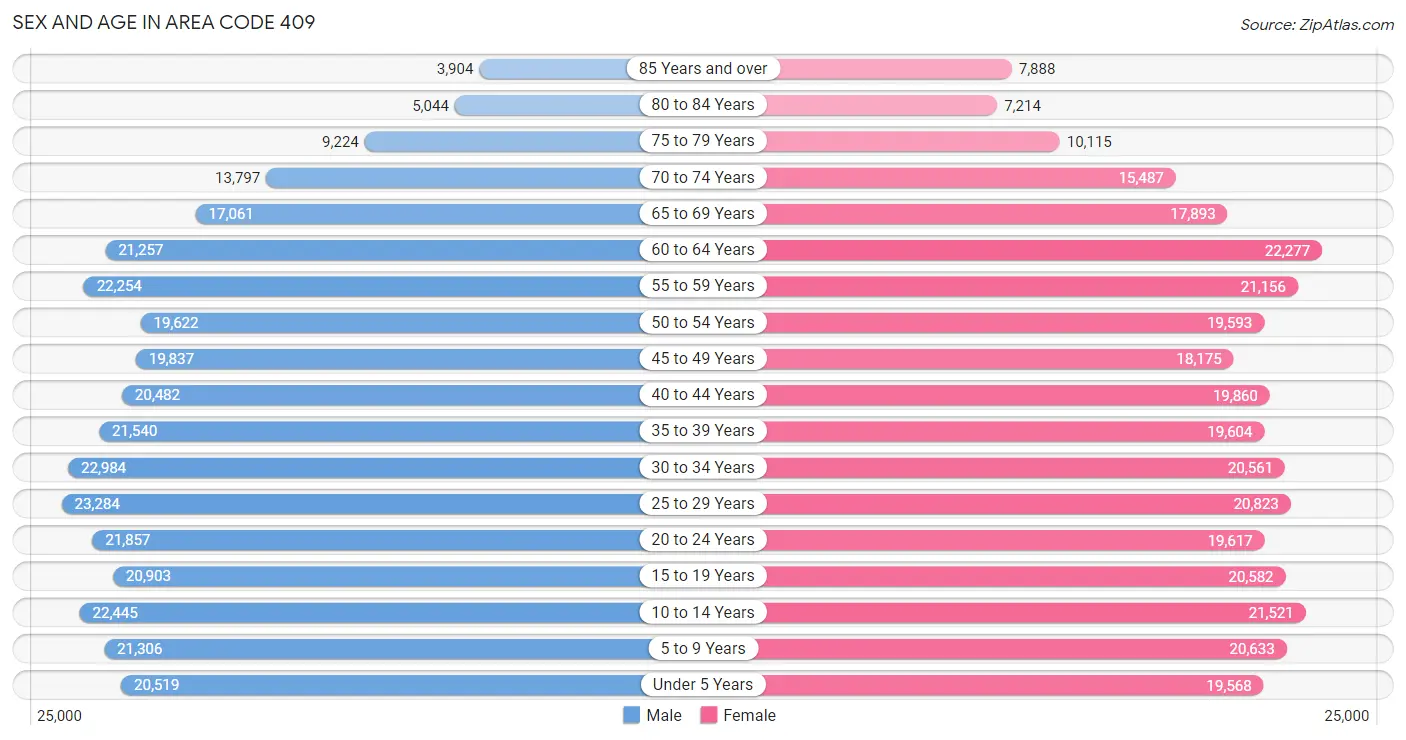
The most populous age groups in Area Code 409 are 25 to 29 Years (23,284 | 7.1%) for men and 60 to 64 Years (22,277 | 6.9%) for women.
| Age Bracket | Male | Female |
| Under 5 Years | 20,519 (6.3%) | 19,568 (6.1%) |
| 5 to 9 Years | 21,306 (6.5%) | 20,633 (6.4%) |
| 10 to 14 Years | 22,445 (6.9%) | 21,521 (6.7%) |
| 15 to 19 Years | 20,903 (6.4%) | 20,582 (6.4%) |
| 20 to 24 Years | 21,857 (6.7%) | 19,617 (6.1%) |
| 25 to 29 Years | 23,284 (7.1%) | 20,823 (6.5%) |
| 30 to 34 Years | 22,984 (7.0%) | 20,561 (6.4%) |
| 35 to 39 Years | 21,540 (6.6%) | 19,604 (6.1%) |
| 40 to 44 Years | 20,482 (6.3%) | 19,860 (6.2%) |
| 45 to 49 Years | 19,837 (6.1%) | 18,175 (5.6%) |
| 50 to 54 Years | 19,622 (6.0%) | 19,593 (6.1%) |
| 55 to 59 Years | 22,254 (6.8%) | 21,156 (6.6%) |
| 60 to 64 Years | 21,257 (6.5%) | 22,277 (6.9%) |
| 65 to 69 Years | 17,061 (5.2%) | 17,893 (5.6%) |
| 70 to 74 Years | 13,797 (4.2%) | 15,487 (4.8%) |
| 75 to 79 Years | 9,224 (2.8%) | 10,115 (3.1%) |
| 80 to 84 Years | 5,044 (1.5%) | 7,214 (2.2%) |
| 85 Years and over | 3,904 (1.2%) | 7,888 (2.5%) |
| Total | 327,320 (100.0%) | 322,567 (100.0%) |
Families and Households in Area Code 409
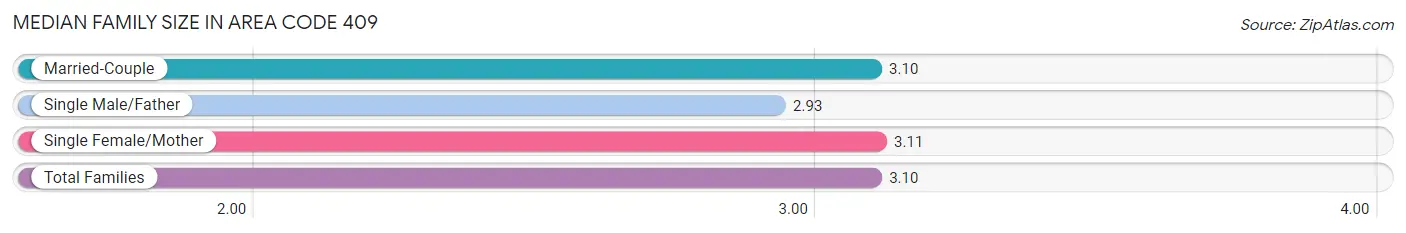
Median Family Size in Area Code 409
The median family size in Area Code 409 is 3.10 persons per family, with single female/mother families (35,818 | 22.0%) accounting for the largest median family size of 3.10883 persons per family. On the other hand, single male/father families (12,233 | 7.5%) represent the smallest median family size with 2.93 persons per family.
| Family Type | # Families | Family Size |
| Married-Couple | 114,697 (70.5%) | 3.10 |
| Single Male/Father | 12,233 (7.5%) | 2.93 |
| Single Female/Mother | 35,818 (22.0%) | 3.11 |
| Total Families | 162,748 (100.0%) | 3.10 |
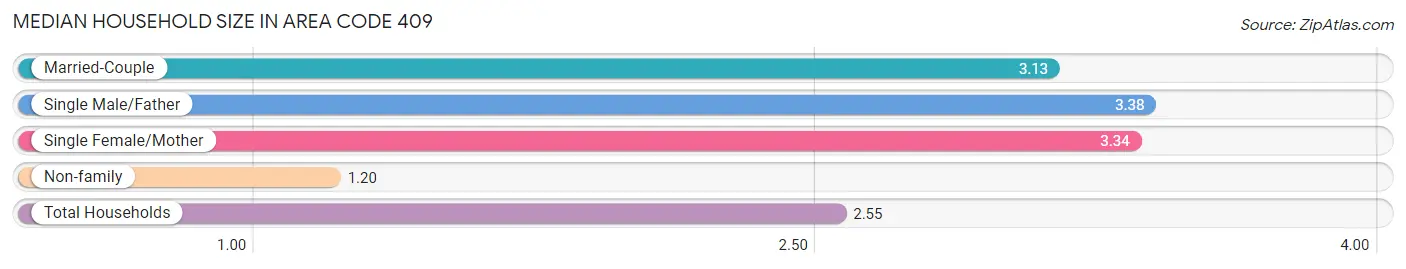
Median Household Size in Area Code 409
The median household size in Area Code 409 is 2.55 persons per household, with single male/father households (12,233 | 5.0%) accounting for the largest median household size of 3.3828 persons per household. non-family households (83,150 | 33.8%) represent the smallest median household size with 1.20 persons per household.
| Household Type | # Households | Household Size |
| Married-Couple | 114,697 (46.6%) | 3.13 |
| Single Male/Father | 12,233 (5.0%) | 3.38 |
| Single Female/Mother | 35,818 (14.6%) | 3.34 |
| Non-family | 83,150 (33.8%) | 1.20 |
| Total Households | 245,898 (100.0%) | 2.55 |
Household Size by Marriage Status in Area Code 409
Out of a total of 245,898 households in Area Code 409, 162,748 (66.2%) are family households, while 83,150 (33.8%) are nonfamily households. The most numerous type of family households are 2-person households, comprising 73,946, and the most common type of nonfamily households are 1-person households, comprising 70,309.
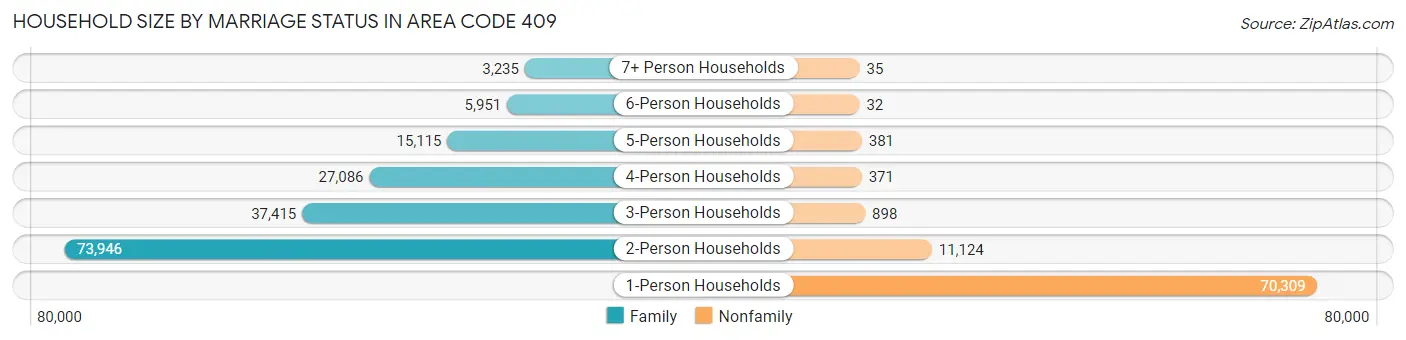
| Household Size | Family Households | Nonfamily Households |
| 1-Person Households | - | 70,309 (28.6%) |
| 2-Person Households | 73,946 (30.1%) | 11,124 (4.5%) |
| 3-Person Households | 37,415 (15.2%) | 898 (0.4%) |
| 4-Person Households | 27,086 (11.0%) | 371 (0.2%) |
| 5-Person Households | 15,115 (6.1%) | 381 (0.2%) |
| 6-Person Households | 5,951 (2.4%) | 32 (0.0%) |
| 7+ Person Households | 3,235 (1.3%) | 35 (0.0%) |
| Total | 162,748 (66.2%) | 83,150 (33.8%) |
Female Fertility in Area Code 409
Fertility by Age in Area Code 409
Average fertility rate in Area Code 409 is 78.2 births per 1,000 women. Women in the age bracket of 20 to 34 years have the highest fertility rate with 180.3 births per 1,000 women. Women in the age bracket of 20 to 34 years acount for 78.4% of all women with births.
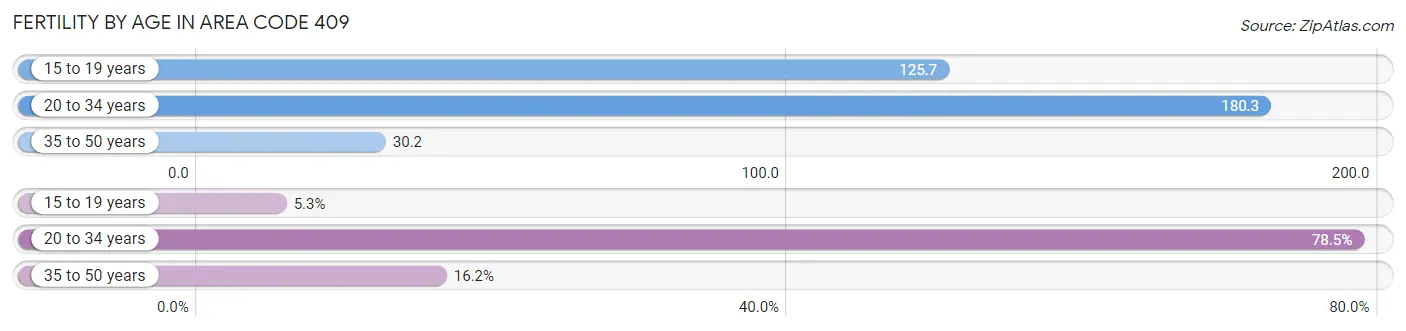
| Age Bracket | Women with Births | Births / 1,000 Women |
| 15 to 19 years | 444 (5.3%) | 125.7 |
| 20 to 34 years | 6,523 (78.4%) | 180.3 |
| 35 to 50 years | 1,348 (16.2%) | 30.2 |
| Total | 8,315 (100.0%) | 78.2 |
Fertility by Age by Marriage Status in Area Code 409
54.2% of women with births (8,315) in Area Code 409 are married. The highest percentage of unmarried women with births falls into 15 to 19 years age bracket with 98.2% of them unmarried at the time of birth, while the lowest percentage of unmarried women with births belong to 20 to 34 years age bracket with 47.2% of them unmarried.
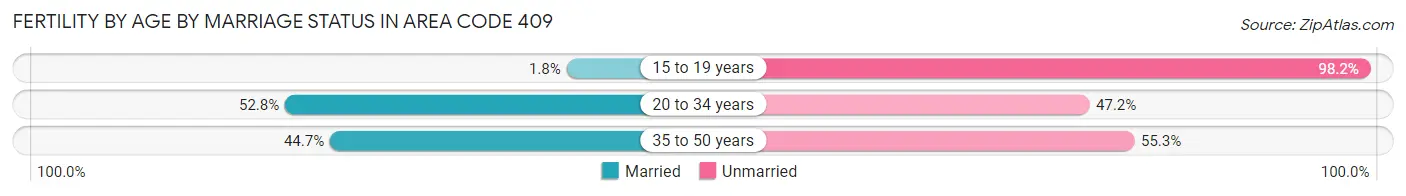
| Age Bracket | Married | Unmarried |
| 15 to 19 years | 8 (1.8%) | 436 (98.2%) |
| 20 to 34 years | 3,445 (52.8%) | 3,078 (47.2%) |
| 35 to 50 years | 602 (44.7%) | 746 (55.3%) |
| Total | 4,509 (54.2%) | 3,806 (45.8%) |
Fertility by Education in Area Code 409
Average fertility rate in Area Code 409 is 78.2 births per 1,000 women. Women with the education attainment of bachelor's degree have the highest fertility rate of 145.3 births per 1,000 women, while women with the education attainment of less than high school have the lowest fertility at 102.4 births per 1,000 women. Women with the education attainment of high school diploma represent 33.9% of all women with births.
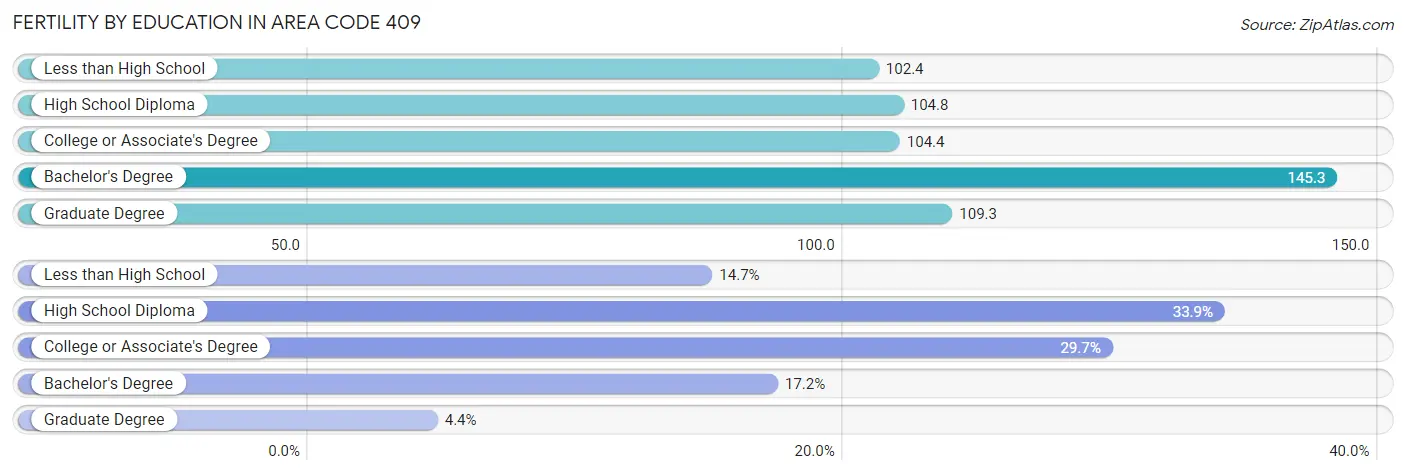
| Educational Attainment | Women with Births | Births / 1,000 Women |
| Less than High School | 1,225 (14.7%) | 102.4 |
| High School Diploma | 2,821 (33.9%) | 104.8 |
| College or Associate's Degree | 2,471 (29.7%) | 104.4 |
| Bachelor's Degree | 1,429 (17.2%) | 145.3 |
| Graduate Degree | 369 (4.4%) | 109.3 |
| Total | 8,315 (100.0%) | 78.2 |
Fertility by Education by Marriage Status in Area Code 409
45.8% of women with births in Area Code 409 are unmarried. Women with the educational attainment of bachelor's degree are most likely to be married with 46.1% of them married at childbirth, while women with the educational attainment of less than high school are least likely to be married with 74.0% of them unmarried at childbirth.
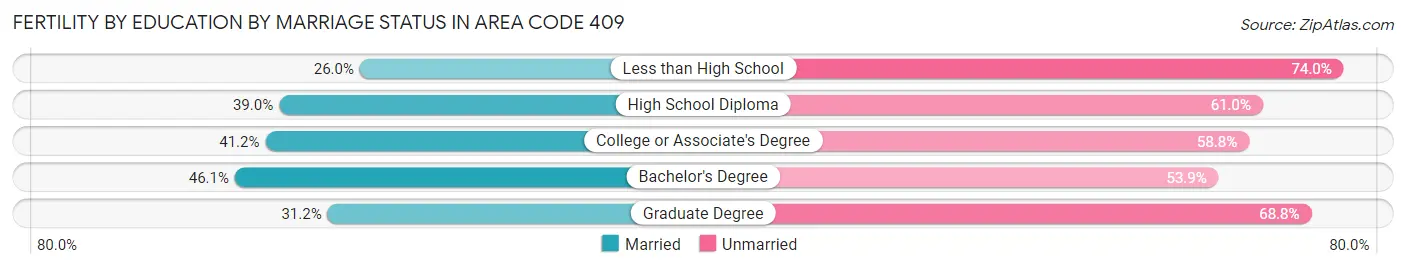
| Educational Attainment | Married | Unmarried |
| Less than High School | 318 (26.0%) | 907 (74.0%) |
| High School Diploma | 1,100 (39.0%) | 1,721 (61.0%) |
| College or Associate's Degree | 1,018 (41.2%) | 1,453 (58.8%) |
| Bachelor's Degree | 659 (46.1%) | 770 (53.9%) |
| Graduate Degree | 115 (31.2%) | 254 (68.8%) |
| Total | 4,509 (54.2%) | 3,806 (45.8%) |
Employment Characteristics in Area Code 409
Employment by Class of Employer in Area Code 409
Among the 269,926 employed individuals in Area Code 409, private company employees (190,405 | 70.5%), local government employees (21,889 | 8.1%), and state government employees (16,677 | 6.2%) make up the most common classes of employment.
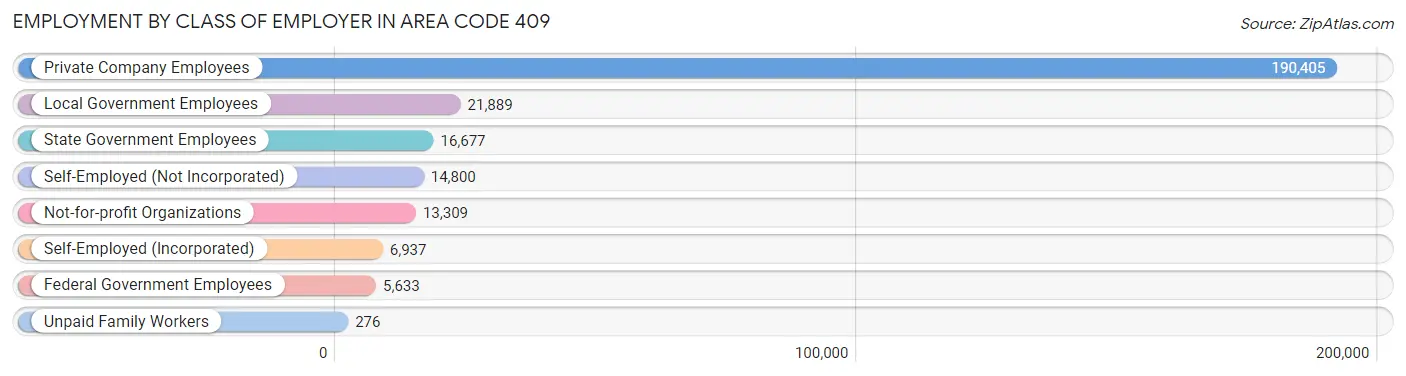
| Employer Class | # Employees | % Employees |
| Private Company Employees | 190,405 | 70.5% |
| Self-Employed (Incorporated) | 6,937 | 2.6% |
| Self-Employed (Not Incorporated) | 14,800 | 5.5% |
| Not-for-profit Organizations | 13,309 | 4.9% |
| Local Government Employees | 21,889 | 8.1% |
| State Government Employees | 16,677 | 6.2% |
| Federal Government Employees | 5,633 | 2.1% |
| Unpaid Family Workers | 276 | 0.1% |
| Total | 269,926 | 100.0% |
Employment Status by Age in Area Code 409
According to the labor force statistics for Area Code 409, out of the total population over 16 years of age (515,238), 56.4% or 290,491 individuals are in the labor force, with 8.1% or 23,443 of them unemployed. The age group with the highest labor force participation rate is 30 to 34 years, with 80.8% or 35,197 individuals in the labor force. Within the labor force, the 16 to 19 years age range has the highest percentage of unemployed individuals, with 1,198.6% or 150,388 of them being unemployed.
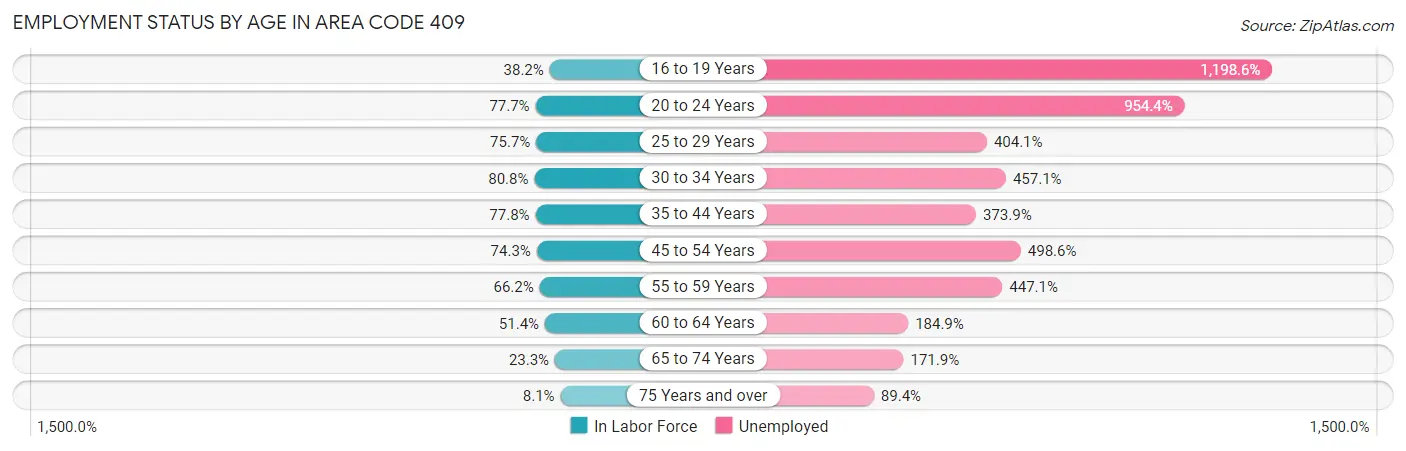
| Age Bracket | In Labor Force | Unemployed |
| 16 to 19 Years | 12,546 (38.2%) | 150,388 (1,198.6%) |
| 20 to 24 Years | 32,241 (77.7%) | 307,718 (954.4%) |
| 25 to 29 Years | 33,402 (75.7%) | 134,977 (404.1%) |
| 30 to 34 Years | 35,198 (80.8%) | 160,885 (457.1%) |
| 35 to 44 Years | 63,424 (77.8%) | 237,131 (373.9%) |
| 45 to 54 Years | 57,391 (74.3%) | 286,132 (498.6%) |
| 55 to 59 Years | 28,751 (66.2%) | 128,541 (447.1%) |
| 60 to 64 Years | 22,360 (51.4%) | 41,342 (184.9%) |
| 65 to 74 Years | 14,990 (23.3%) | 25,773 (171.9%) |
| 75 Years and over | 3,498 (8.1%) | 3,126 (89.4%) |
| Total | 290,472 (56.4%) | 23,451 (8.1%) |
Employment Status by Educational Attainment in Area Code 409
According to labor force statistics for Area Code 409, 71.1% of individuals (236,816) out of the total population between 25 and 64 years of age (333,309) are in the labor force, with 398.3% or 943,238 of them being unemployed. The group with the highest labor force participation rate are those with the educational attainment of bachelor's degree or higher, with 82.0% or 53,613 individuals in the labor force. Within the labor force, individuals with less than high school education have the highest percentage of unemployment, with 588.1% or 162,245 of them being unemployed.
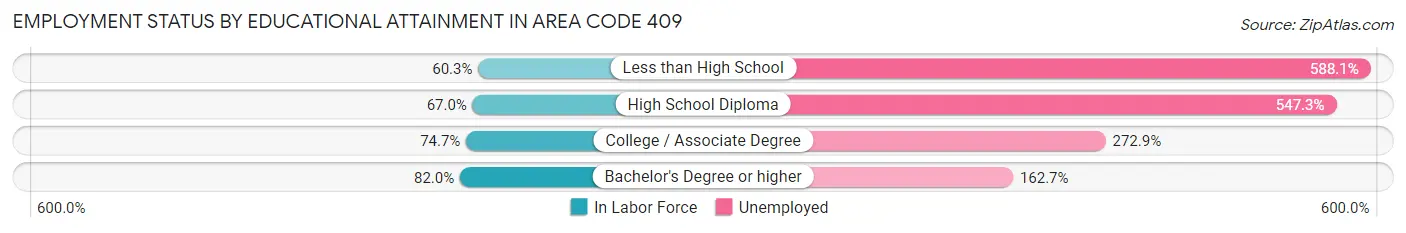
| Educational Attainment | In Labor Force | Unemployed |
| Less than High School | 27,586 (60.3%) | 269,015 (588.1%) |
| High School Diploma | 73,285 (67.0%) | 599,020 (547.3%) |
| College / Associate Degree | 84,147 (74.7%) | 307,545 (272.9%) |
| Bachelor's Degree or higher | 53,614 (82.0%) | 106,440 (162.7%) |
| Total | 236,803 (71.1%) | 1,327,570 (398.3%) |
Employment Occupations by Sex in Area Code 409
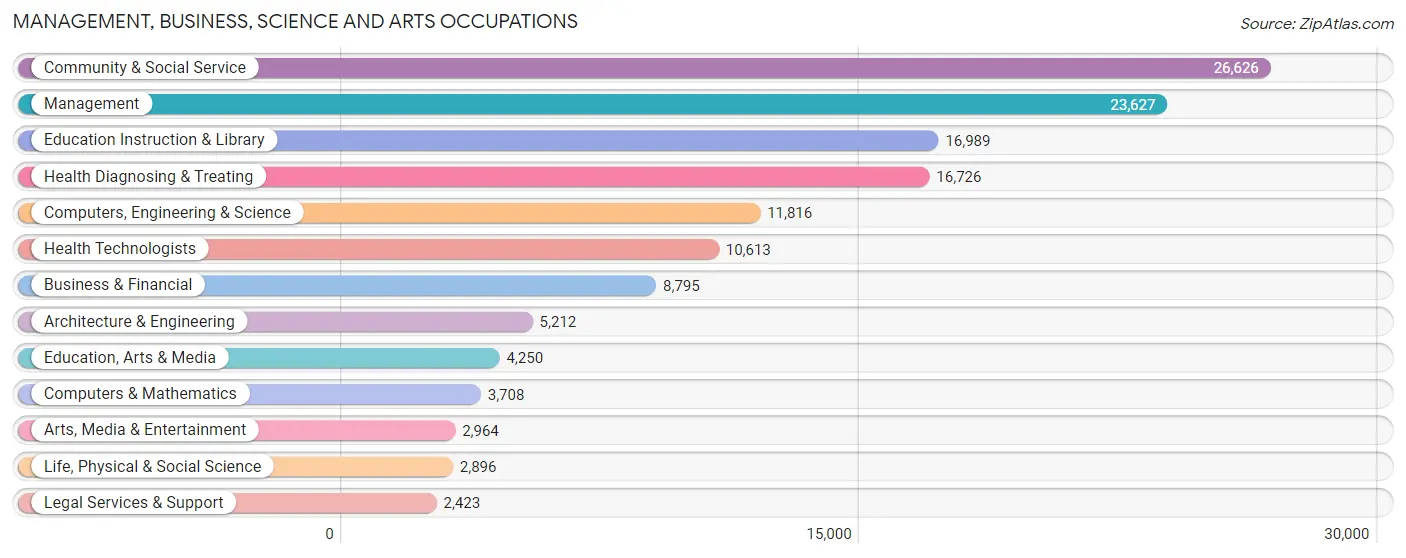
Management, Business, Science and Arts Occupations
The most common Management, Business, Science and Arts occupations in Area Code 409 are Community & Social Service (26,626 | 9.7%), Management (23,627 | 8.6%), Education Instruction & Library (16,989 | 6.2%), Health Diagnosing & Treating (16,726 | 6.1%), and Computers, Engineering & Science (11,816 | 4.3%).
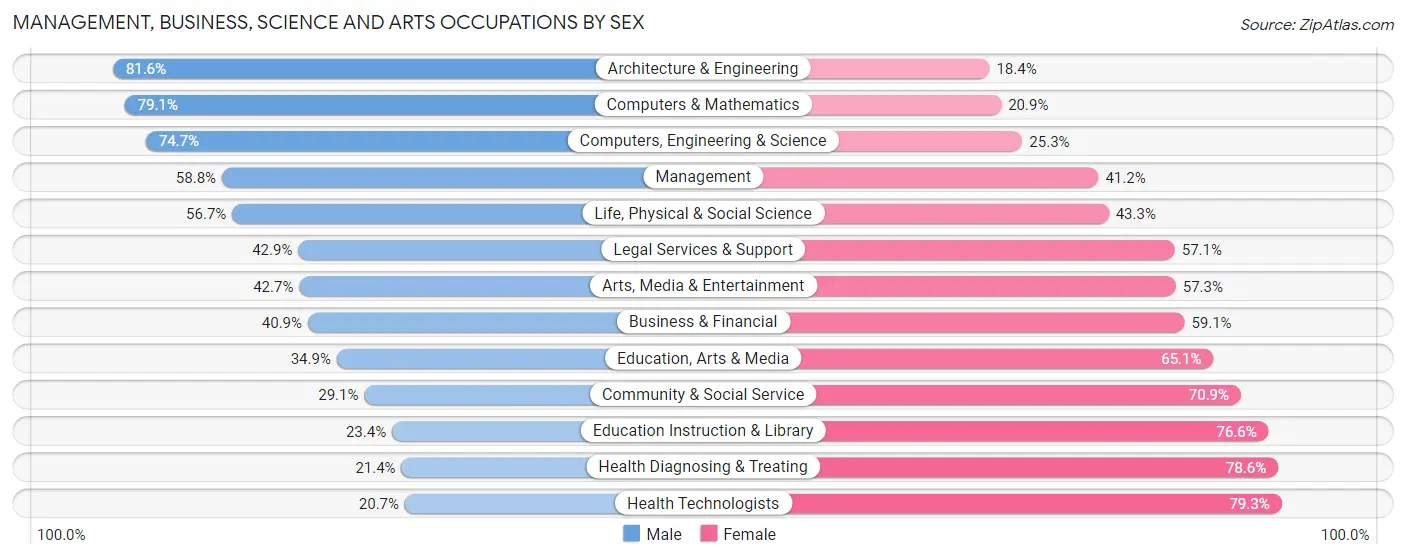
Management, Business, Science and Arts Occupations by Sex
Within the Management, Business, Science and Arts occupations in Area Code 409, the most male-oriented occupations are Architecture & Engineering (81.6%), Computers & Mathematics (79.1%), and Computers, Engineering & Science (74.7%), while the most female-oriented occupations are Health Technologists (79.3%), Health Diagnosing & Treating (78.6%), and Education Instruction & Library (76.6%).
| Occupation | Male | Female |
| Management | 13,901 (58.8%) | 9,726 (41.2%) |
| Business & Financial | 3,598 (40.9%) | 5,197 (59.1%) |
| Computers, Engineering & Science | 8,828 (74.7%) | 2,988 (25.3%) |
| Computers & Mathematics | 2,934 (79.1%) | 774 (20.9%) |
| Architecture & Engineering | 4,252 (81.6%) | 960 (18.4%) |
| Life, Physical & Social Science | 1,642 (56.7%) | 1,254 (43.3%) |
| Community & Social Service | 7,758 (29.1%) | 18,868 (70.9%) |
| Education, Arts & Media | 1,483 (34.9%) | 2,767 (65.1%) |
| Legal Services & Support | 1,040 (42.9%) | 1,383 (57.1%) |
| Education Instruction & Library | 3,969 (23.4%) | 13,020 (76.6%) |
| Arts, Media & Entertainment | 1,266 (42.7%) | 1,698 (57.3%) |
| Health Diagnosing & Treating | 3,577 (21.4%) | 13,149 (78.6%) |
| Health Technologists | 2,194 (20.7%) | 8,419 (79.3%) |
| Total (Category) | 37,662 (43.0%) | 49,928 (57.0%) |
| Total (Overall) | 147,748 (53.9%) | 126,389 (46.1%) |
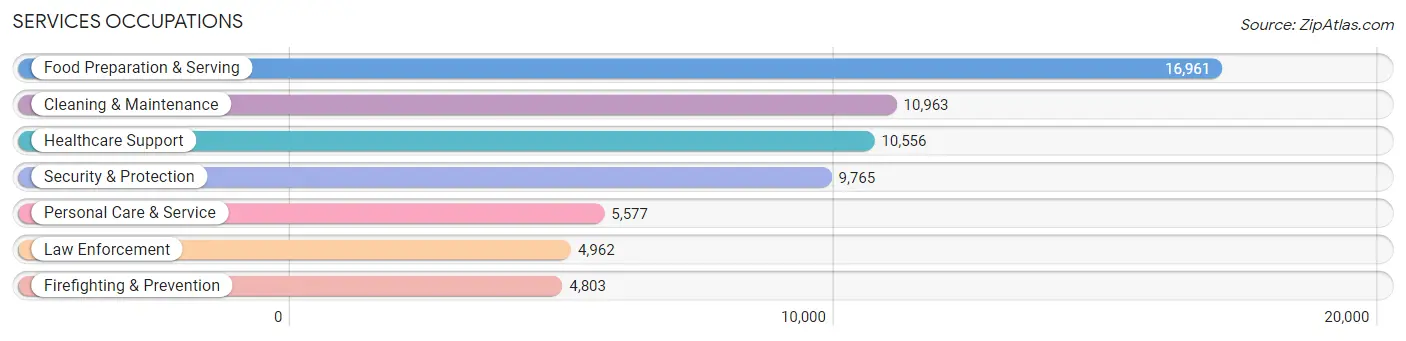
Services Occupations
The most common Services occupations in Area Code 409 are Food Preparation & Serving (16,961 | 6.2%), Cleaning & Maintenance (10,963 | 4.0%), Healthcare Support (10,556 | 3.8%), Security & Protection (9,765 | 3.6%), and Personal Care & Service (5,577 | 2.0%).
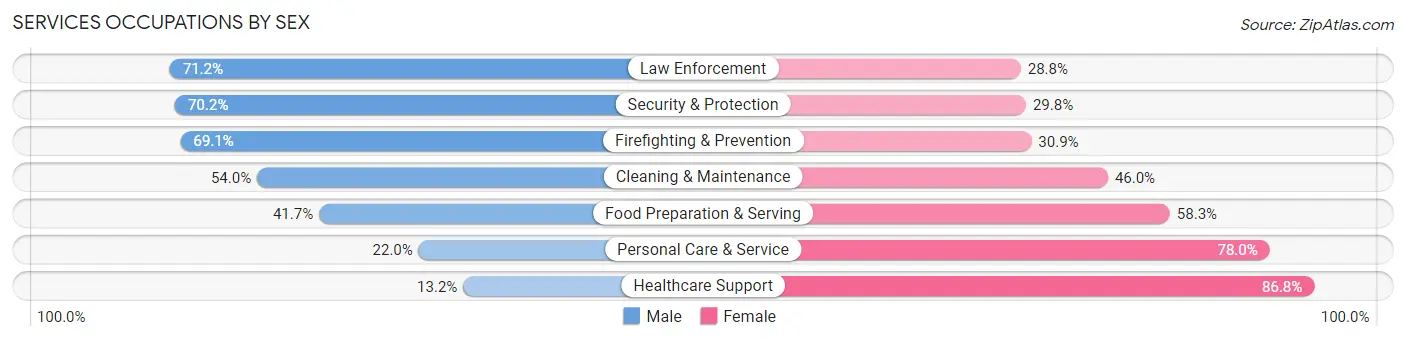
Services Occupations by Sex
Within the Services occupations in Area Code 409, the most male-oriented occupations are Law Enforcement (71.2%), Security & Protection (70.2%), and Firefighting & Prevention (69.1%), while the most female-oriented occupations are Healthcare Support (86.8%), Personal Care & Service (78.0%), and Food Preparation & Serving (58.3%).
| Occupation | Male | Female |
| Healthcare Support | 1,389 (13.2%) | 9,167 (86.8%) |
| Security & Protection | 6,856 (70.2%) | 2,909 (29.8%) |
| Firefighting & Prevention | 3,321 (69.1%) | 1,482 (30.9%) |
| Law Enforcement | 3,535 (71.2%) | 1,427 (28.8%) |
| Food Preparation & Serving | 7,074 (41.7%) | 9,887 (58.3%) |
| Cleaning & Maintenance | 5,918 (54.0%) | 5,045 (46.0%) |
| Personal Care & Service | 1,226 (22.0%) | 4,351 (78.0%) |
| Total (Category) | 22,463 (41.7%) | 31,359 (58.3%) |
| Total (Overall) | 147,748 (53.9%) | 126,389 (46.1%) |
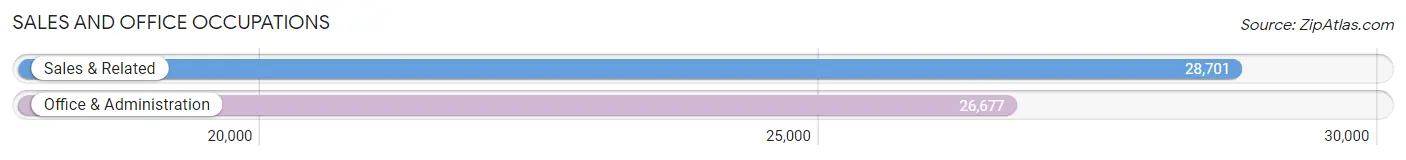
Sales and Office Occupations
The most common Sales and Office occupations in Area Code 409 are Sales & Related (28,701 | 10.5%), and Office & Administration (26,677 | 9.7%).
Sales and Office Occupations by Sex
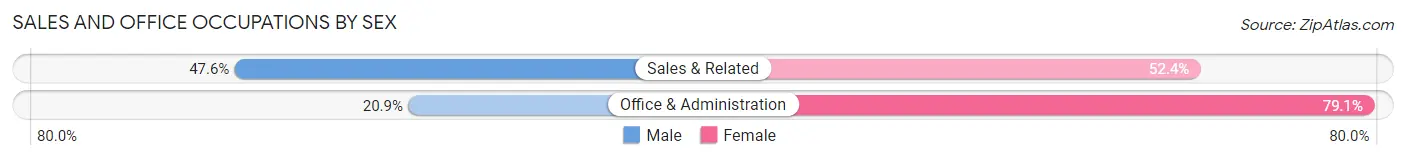
| Occupation | Male | Female |
| Sales & Related | 13,662 (47.6%) | 15,039 (52.4%) |
| Office & Administration | 5,574 (20.9%) | 21,103 (79.1%) |
| Total (Category) | 19,236 (34.7%) | 36,142 (65.3%) |
| Total (Overall) | 147,748 (53.9%) | 126,389 (46.1%) |
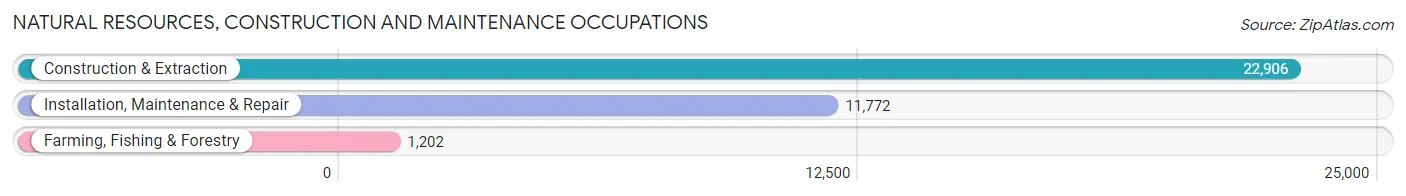
Natural Resources, Construction and Maintenance Occupations
The most common Natural Resources, Construction and Maintenance occupations in Area Code 409 are Construction & Extraction (22,906 | 8.4%), Installation, Maintenance & Repair (11,772 | 4.3%), and Farming, Fishing & Forestry (1,202 | 0.4%).
Natural Resources, Construction and Maintenance Occupations by Sex
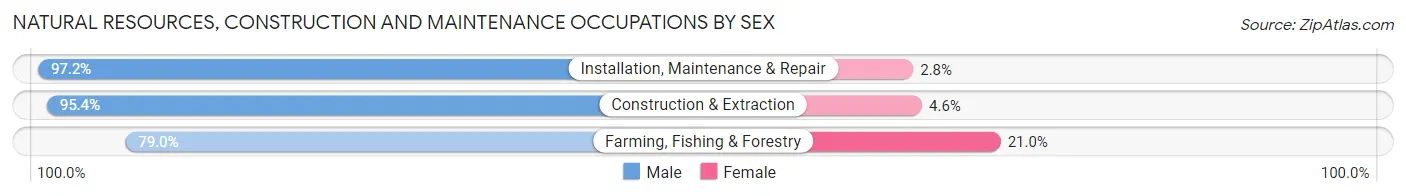
| Occupation | Male | Female |
| Farming, Fishing & Forestry | 950 (79.0%) | 252 (21.0%) |
| Construction & Extraction | 21,848 (95.4%) | 1,058 (4.6%) |
| Installation, Maintenance & Repair | 11,445 (97.2%) | 327 (2.8%) |
| Total (Category) | 34,243 (95.4%) | 1,637 (4.6%) |
| Total (Overall) | 147,748 (53.9%) | 126,389 (46.1%) |
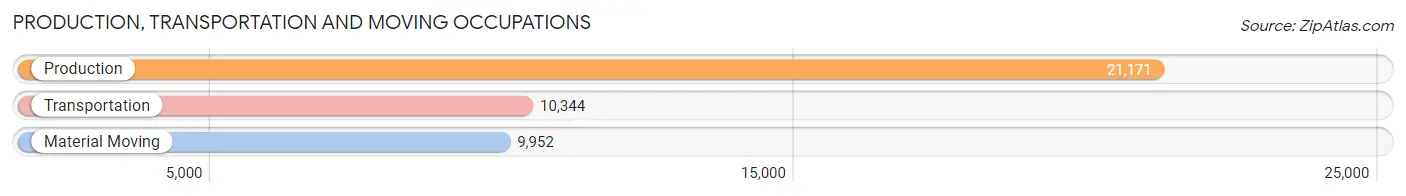
Production, Transportation and Moving Occupations
The most common Production, Transportation and Moving occupations in Area Code 409 are Production (21,171 | 7.7%), Transportation (10,344 | 3.8%), and Material Moving (9,952 | 3.6%).
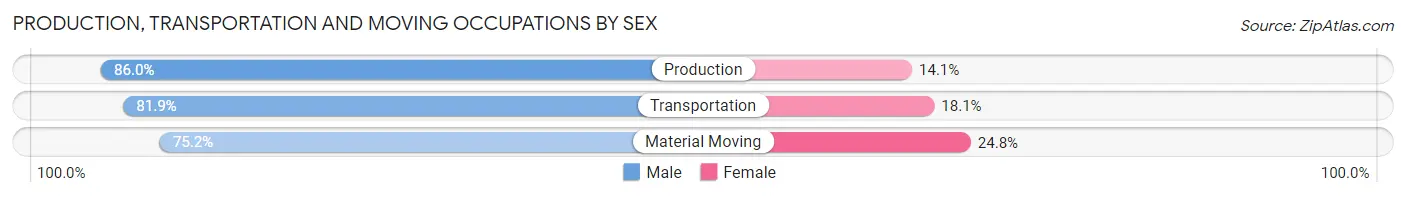
Production, Transportation and Moving Occupations by Sex
| Occupation | Male | Female |
| Production | 18,196 (86.0%) | 2,975 (14.1%) |
| Transportation | 8,468 (81.9%) | 1,876 (18.1%) |
| Material Moving | 7,480 (75.2%) | 2,472 (24.8%) |
| Total (Category) | 34,144 (82.3%) | 7,323 (17.7%) |
| Total (Overall) | 147,748 (53.9%) | 126,389 (46.1%) |
Employment Industries by Sex in Area Code 409
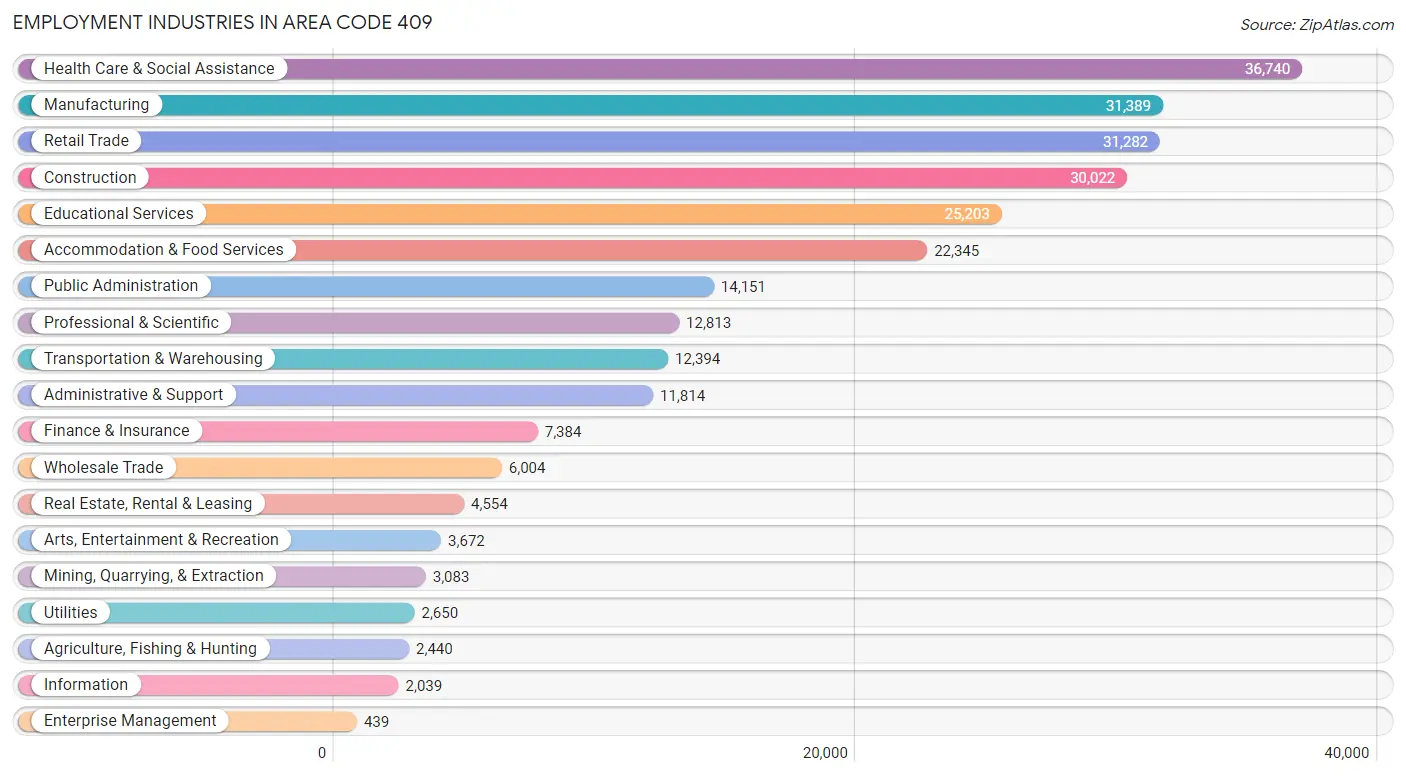
Employment Industries in Area Code 409
The major employment industries in Area Code 409 include Health Care & Social Assistance (36,740 | 13.4%), Manufacturing (31,389 | 11.5%), Retail Trade (31,282 | 11.4%), Construction (30,022 | 11.0%), and Educational Services (25,203 | 9.2%).
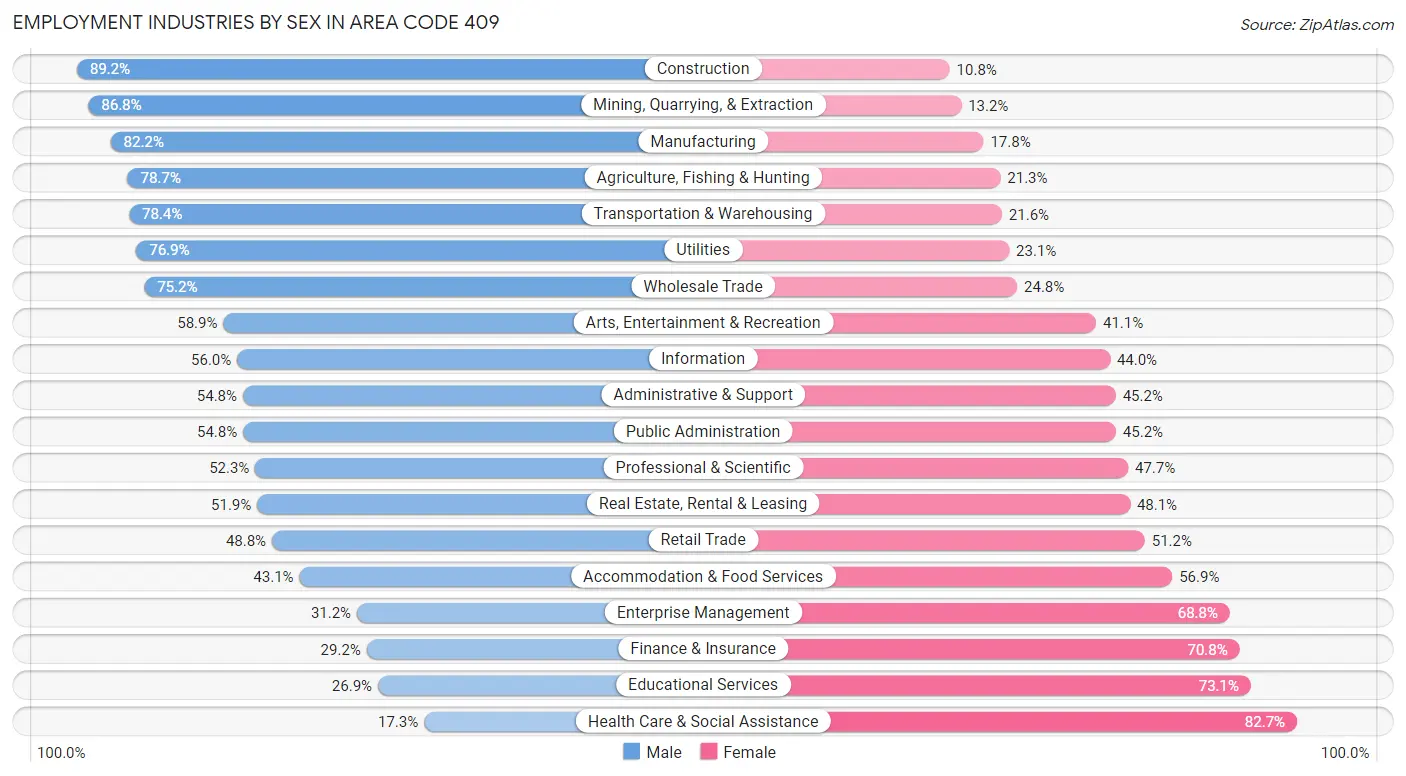
Employment Industries by Sex in Area Code 409
The Area Code 409 industries that see more men than women are Construction (89.2%), Mining, Quarrying, & Extraction (86.8%), and Manufacturing (82.2%), whereas the industries that tend to have a higher number of women are Health Care & Social Assistance (82.7%), Educational Services (73.1%), and Finance & Insurance (70.8%).
| Industry | Male | Female |
| Agriculture, Fishing & Hunting | 1,920 (78.7%) | 520 (21.3%) |
| Mining, Quarrying, & Extraction | 2,676 (86.8%) | 407 (13.2%) |
| Construction | 26,777 (89.2%) | 3,245 (10.8%) |
| Manufacturing | 25,800 (82.2%) | 5,589 (17.8%) |
| Wholesale Trade | 4,517 (75.2%) | 1,487 (24.8%) |
| Retail Trade | 15,267 (48.8%) | 16,015 (51.2%) |
| Transportation & Warehousing | 9,713 (78.4%) | 2,681 (21.6%) |
| Utilities | 2,037 (76.9%) | 613 (23.1%) |
| Information | 1,142 (56.0%) | 897 (44.0%) |
| Finance & Insurance | 2,156 (29.2%) | 5,228 (70.8%) |
| Real Estate, Rental & Leasing | 2,362 (51.9%) | 2,192 (48.1%) |
| Professional & Scientific | 6,697 (52.3%) | 6,116 (47.7%) |
| Enterprise Management | 137 (31.2%) | 302 (68.8%) |
| Administrative & Support | 6,476 (54.8%) | 5,338 (45.2%) |
| Educational Services | 6,772 (26.9%) | 18,431 (73.1%) |
| Health Care & Social Assistance | 6,364 (17.3%) | 30,376 (82.7%) |
| Arts, Entertainment & Recreation | 2,162 (58.9%) | 1,510 (41.1%) |
| Accommodation & Food Services | 9,636 (43.1%) | 12,709 (56.9%) |
| Public Administration | 7,752 (54.8%) | 6,399 (45.2%) |
| Total | 147,748 (53.9%) | 126,389 (46.1%) |
Education in Area Code 409
School Enrollment in Area Code 409
The most common levels of schooling among the 148,642 students in Area Code 409 are middle school (34,248 | 23.0%), elementary school (33,663 | 22.7%), and high school (33,253 | 22.4%).
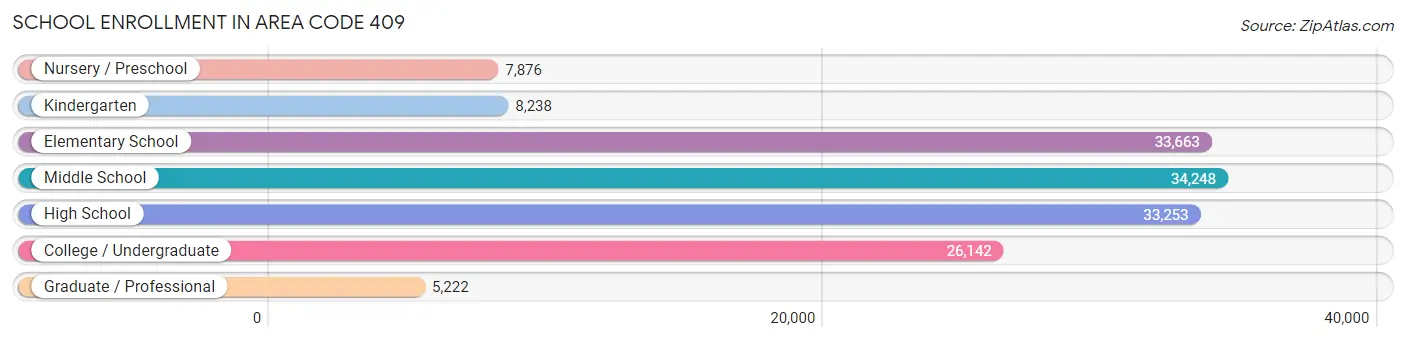
| School Level | # Students | % Students |
| Nursery / Preschool | 7,876 | 5.3% |
| Kindergarten | 8,238 | 5.5% |
| Elementary School | 33,663 | 22.7% |
| Middle School | 34,248 | 23.0% |
| High School | 33,253 | 22.4% |
| College / Undergraduate | 26,142 | 17.6% |
| Graduate / Professional | 5,222 | 3.5% |
| Total | 148,642 | 100.0% |
School Enrollment by Age by Funding Source in Area Code 409
Out of a total of 148,642 students who are enrolled in schools in Area Code 409, 17,307 (11.6%) attend a private institution, while the remaining 131,335 (88.4%) are enrolled in public schools. The age group of 3 to 4 year olds has the highest likelihood of being enrolled in private schools, with 1,741 (29.1% in the age bracket) enrolled. Conversely, the age group of 15 to 17 year olds has the lowest likelihood of being enrolled in a private school, with 22,368 (92.1% in the age bracket) attending a public institution.
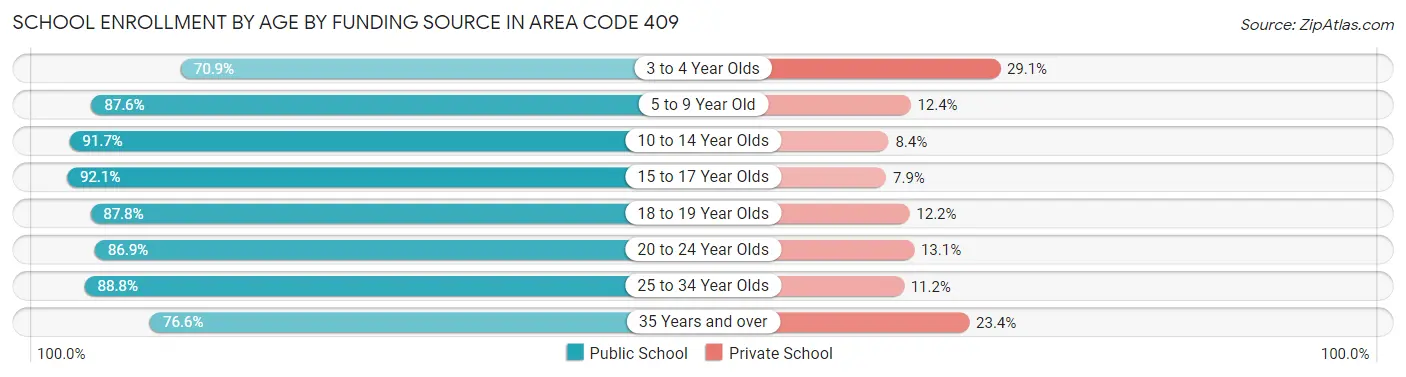
| Age Bracket | Public School | Private School |
| 3 to 4 Year Olds | 4,239 (70.9%) | 1,741 (29.1%) |
| 5 to 9 Year Old | 34,263 (87.6%) | 4,868 (12.4%) |
| 10 to 14 Year Olds | 39,233 (91.6%) | 3,576 (8.4%) |
| 15 to 17 Year Olds | 22,368 (92.1%) | 1,919 (7.9%) |
| 18 to 19 Year Olds | 8,539 (87.8%) | 1,191 (12.2%) |
| 20 to 24 Year Olds | 11,713 (86.9%) | 1,765 (13.1%) |
| 25 to 34 Year Olds | 6,158 (88.8%) | 775 (11.2%) |
| 35 Years and over | 4,823 (76.6%) | 1,471 (23.4%) |
| Total | 131,335 (88.4%) | 17,307 (11.6%) |
Educational Attainment by Field of Study in Area Code 409
Business (16,038 | 17.5%), education (13,186 | 14.4%), science & technology (11,840 | 12.9%), arts & humanities (8,303 | 9.0%), and engineering (7,098 | 7.7%) are the most common fields of study among 91,771 individuals in Area Code 409 who have obtained a bachelor's degree or higher.
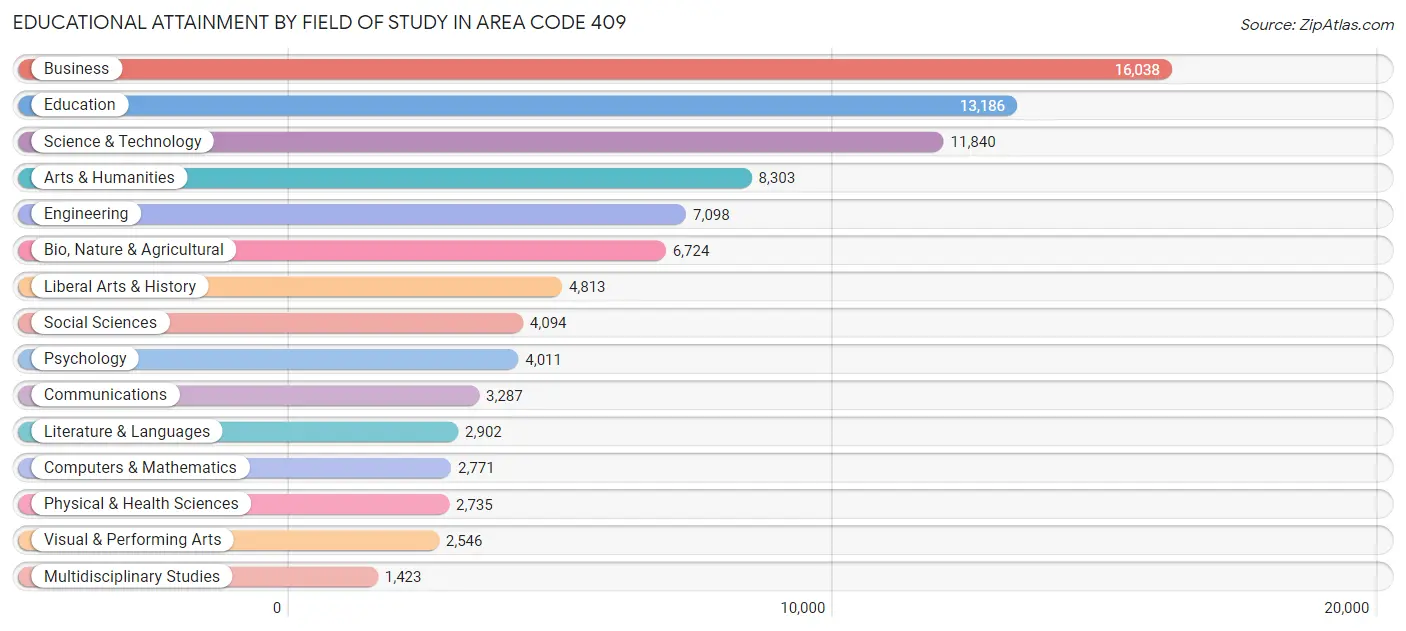
| Field of Study | # Graduates | % Graduates |
| Computers & Mathematics | 2,771 | 3.0% |
| Bio, Nature & Agricultural | 6,724 | 7.3% |
| Physical & Health Sciences | 2,735 | 3.0% |
| Psychology | 4,011 | 4.4% |
| Social Sciences | 4,094 | 4.5% |
| Engineering | 7,098 | 7.7% |
| Multidisciplinary Studies | 1,423 | 1.5% |
| Science & Technology | 11,840 | 12.9% |
| Business | 16,038 | 17.5% |
| Education | 13,186 | 14.4% |
| Literature & Languages | 2,902 | 3.2% |
| Liberal Arts & History | 4,813 | 5.2% |
| Visual & Performing Arts | 2,546 | 2.8% |
| Communications | 3,287 | 3.6% |
| Arts & Humanities | 8,303 | 9.0% |
| Total | 91,771 | 100.0% |
Transportation & Commute in Area Code 409
Vehicle Availability by Sex in Area Code 409
The most prevalent vehicle ownership categories in Area Code 409 are males with 2 vehicles (64,397, accounting for 44.3%) and females with 2 vehicles (52,518, making up 52.2%).
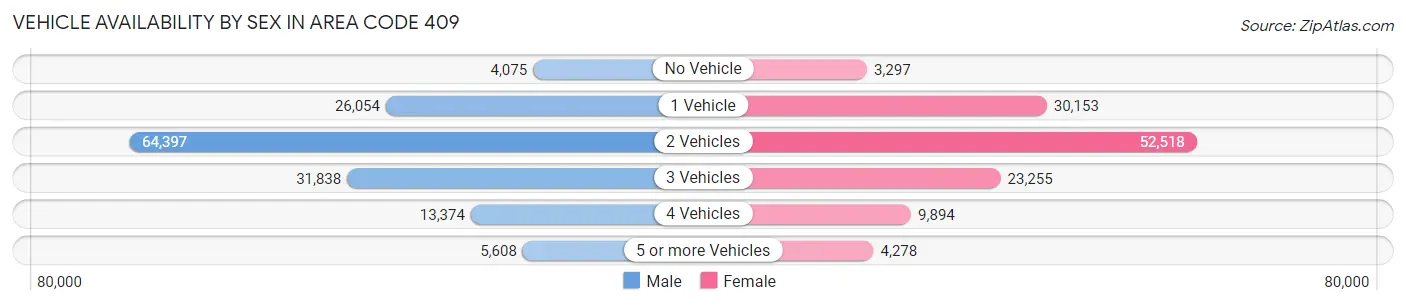
| Vehicles Available | Male | Female |
| No Vehicle | 4,075 (2.8%) | 3,297 (2.7%) |
| 1 Vehicle | 26,054 (17.9%) | 30,153 (24.4%) |
| 2 Vehicles | 64,397 (44.3%) | 52,518 (42.6%) |
| 3 Vehicles | 31,838 (21.9%) | 23,255 (18.9%) |
| 4 Vehicles | 13,374 (9.2%) | 9,894 (8.0%) |
| 5 or more Vehicles | 5,608 (3.9%) | 4,278 (3.5%) |
| Total | 145,346 (100.0%) | 123,395 (100.0%) |
Commute Time in Area Code 409
The most frequently occuring commute durations in Area Code 409 are 15 to 19 minutes (44,529 commuters, 17.2%), 20 to 24 minutes (42,358 commuters, 16.4%), and 10 to 14 minutes (35,988 commuters, 13.9%).
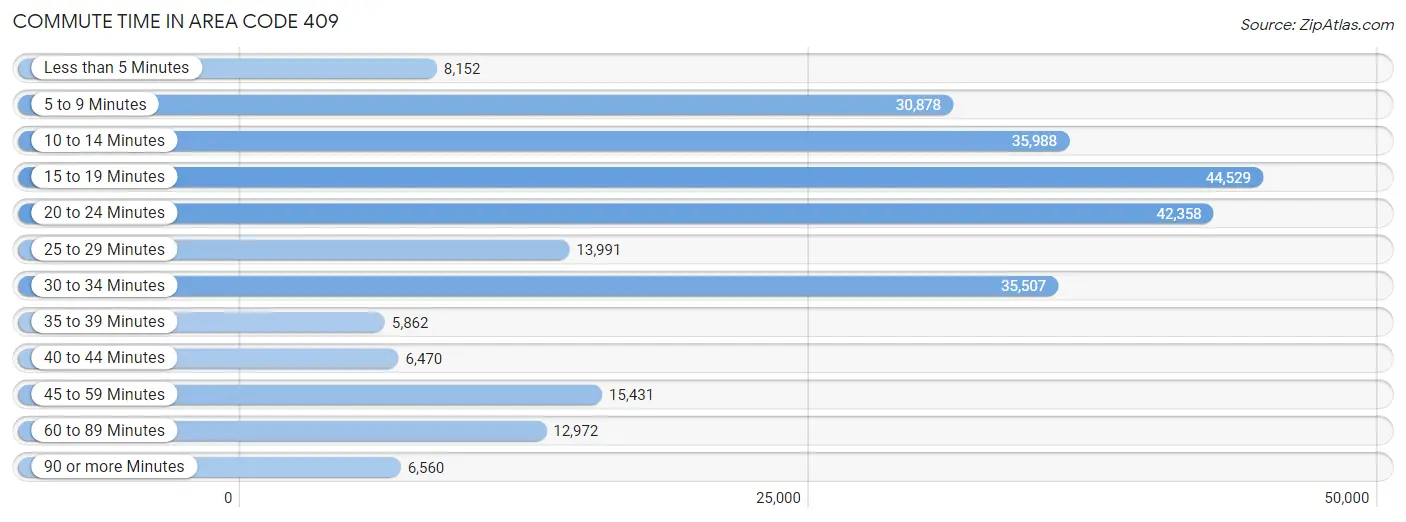
| Commute Time | # Commuters | % Commuters |
| Less than 5 Minutes | 8,152 | 3.2% |
| 5 to 9 Minutes | 30,878 | 11.9% |
| 10 to 14 Minutes | 35,988 | 13.9% |
| 15 to 19 Minutes | 44,529 | 17.2% |
| 20 to 24 Minutes | 42,358 | 16.4% |
| 25 to 29 Minutes | 13,991 | 5.4% |
| 30 to 34 Minutes | 35,507 | 13.7% |
| 35 to 39 Minutes | 5,862 | 2.3% |
| 40 to 44 Minutes | 6,470 | 2.5% |
| 45 to 59 Minutes | 15,431 | 6.0% |
| 60 to 89 Minutes | 12,972 | 5.0% |
| 90 or more Minutes | 6,560 | 2.5% |
Commute Time by Sex in Area Code 409
The most common commute times in Area Code 409 are 20 to 24 minutes (24,539 commuters, 17.4%) for males and 15 to 19 minutes (22,163 commuters, 18.9%) for females.
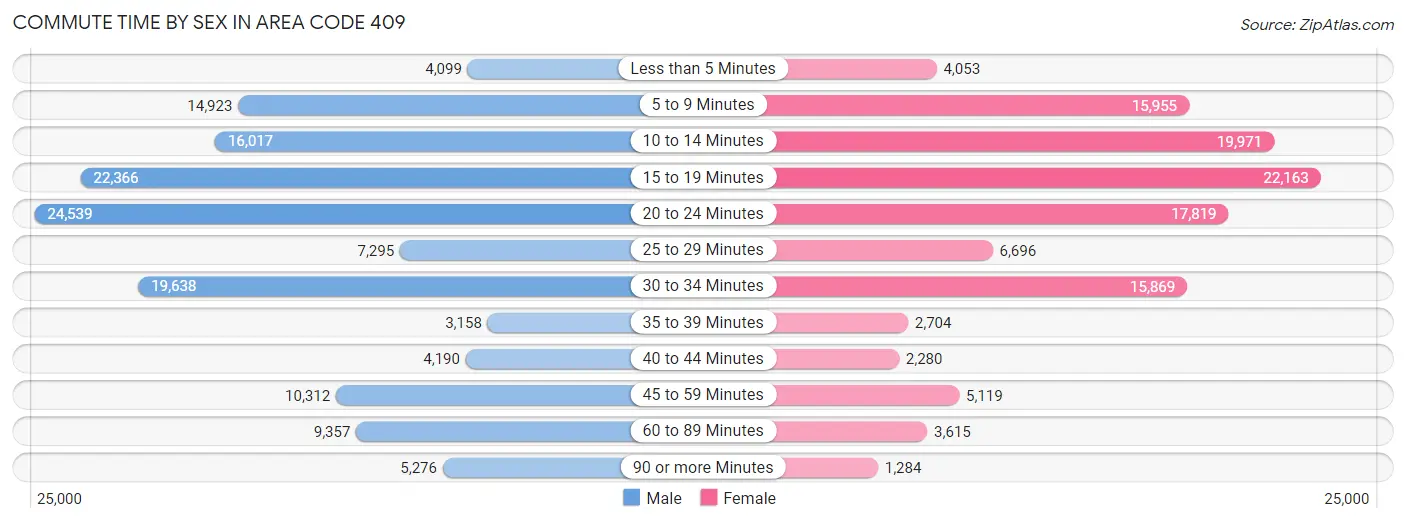
| Commute Time | Male | Female |
| Less than 5 Minutes | 4,099 (2.9%) | 4,053 (3.5%) |
| 5 to 9 Minutes | 14,923 (10.6%) | 15,955 (13.6%) |
| 10 to 14 Minutes | 16,017 (11.4%) | 19,971 (17.0%) |
| 15 to 19 Minutes | 22,366 (15.8%) | 22,163 (18.9%) |
| 20 to 24 Minutes | 24,539 (17.4%) | 17,819 (15.2%) |
| 25 to 29 Minutes | 7,295 (5.2%) | 6,696 (5.7%) |
| 30 to 34 Minutes | 19,638 (13.9%) | 15,869 (13.5%) |
| 35 to 39 Minutes | 3,158 (2.2%) | 2,704 (2.3%) |
| 40 to 44 Minutes | 4,190 (3.0%) | 2,280 (1.9%) |
| 45 to 59 Minutes | 10,312 (7.3%) | 5,119 (4.4%) |
| 60 to 89 Minutes | 9,357 (6.6%) | 3,615 (3.1%) |
| 90 or more Minutes | 5,276 (3.7%) | 1,284 (1.1%) |
Time of Departure to Work by Sex in Area Code 409
The most frequent times of departure to work in Area Code 409 are 12:00 AM to 4:59 AM (18,474, 13.1%) for males and 7:00 AM to 7:29 AM (18,963, 16.1%) for females.
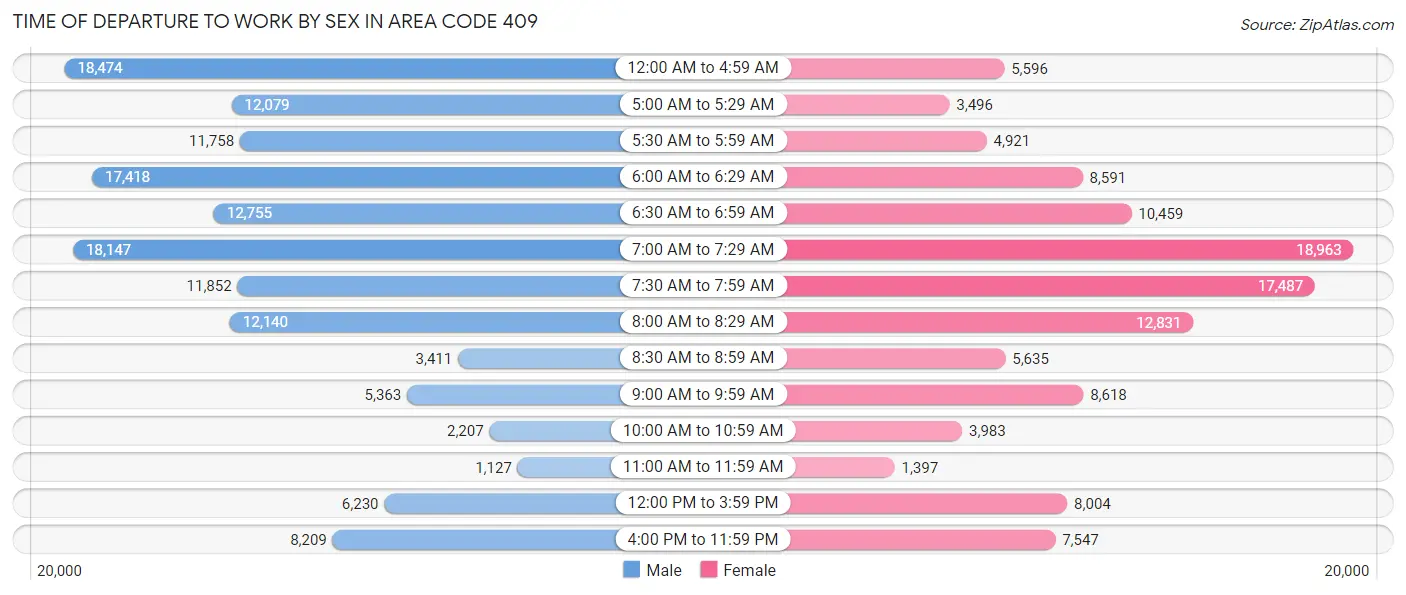
| Time of Departure | Male | Female |
| 12:00 AM to 4:59 AM | 18,474 (13.1%) | 5,596 (4.8%) |
| 5:00 AM to 5:29 AM | 12,079 (8.6%) | 3,496 (3.0%) |
| 5:30 AM to 5:59 AM | 11,758 (8.3%) | 4,921 (4.2%) |
| 6:00 AM to 6:29 AM | 17,418 (12.3%) | 8,591 (7.3%) |
| 6:30 AM to 6:59 AM | 12,755 (9.0%) | 10,459 (8.9%) |
| 7:00 AM to 7:29 AM | 18,147 (12.9%) | 18,963 (16.1%) |
| 7:30 AM to 7:59 AM | 11,852 (8.4%) | 17,487 (14.9%) |
| 8:00 AM to 8:29 AM | 12,140 (8.6%) | 12,831 (10.9%) |
| 8:30 AM to 8:59 AM | 3,411 (2.4%) | 5,635 (4.8%) |
| 9:00 AM to 9:59 AM | 5,363 (3.8%) | 8,618 (7.3%) |
| 10:00 AM to 10:59 AM | 2,207 (1.6%) | 3,983 (3.4%) |
| 11:00 AM to 11:59 AM | 1,127 (0.8%) | 1,397 (1.2%) |
| 12:00 PM to 3:59 PM | 6,230 (4.4%) | 8,004 (6.8%) |
| 4:00 PM to 11:59 PM | 8,209 (5.8%) | 7,547 (6.4%) |
| Total | 141,170 (100.0%) | 117,528 (100.0%) |
Housing Occupancy in Area Code 409
Occupancy by Ownership in Area Code 409
Of the total 245,898 dwellings in Area Code 409, owner-occupied units account for 164,893 (67.1%), while renter-occupied units make up 81,005 (32.9%).
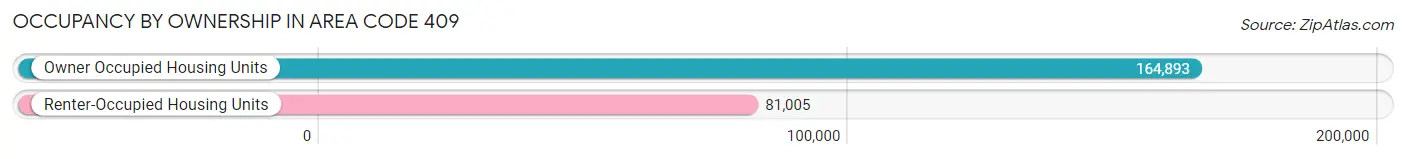
| Occupancy | # Housing Units | % Housing Units |
| Owner Occupied Housing Units | 164,893 | 67.1% |
| Renter-Occupied Housing Units | 81,005 | 32.9% |
| Total Occupied Housing Units | 245,898 | 100.0% |
Occupancy by Household Size in Area Code 409
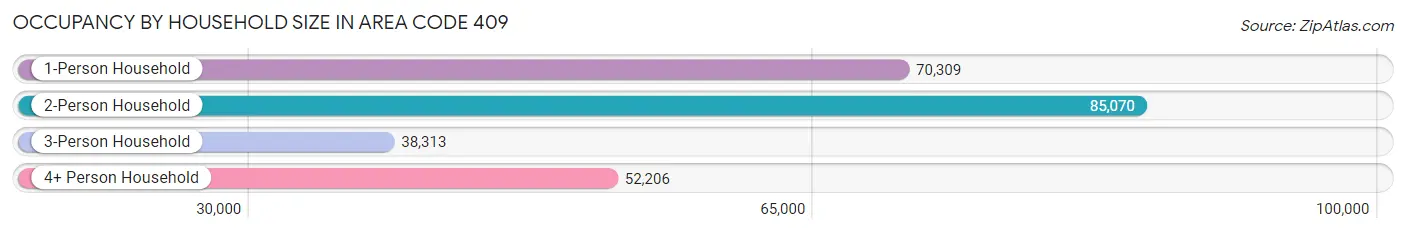
| Household Size | # Housing Units | % Housing Units |
| 1-Person Household | 70,309 | 28.6% |
| 2-Person Household | 85,070 | 34.6% |
| 3-Person Household | 38,313 | 15.6% |
| 4+ Person Household | 52,206 | 21.2% |
| Total Housing Units | 245,898 | 100.0% |
Occupancy by Ownership by Household Size in Area Code 409
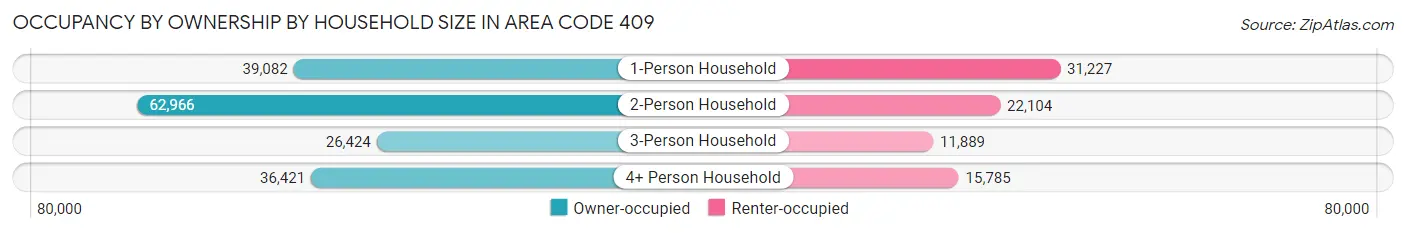
| Household Size | Owner-occupied | Renter-occupied |
| 1-Person Household | 39,082 (55.6%) | 31,227 (44.4%) |
| 2-Person Household | 62,966 (74.0%) | 22,104 (26.0%) |
| 3-Person Household | 26,424 (69.0%) | 11,889 (31.0%) |
| 4+ Person Household | 36,421 (69.8%) | 15,785 (30.2%) |
| Total Housing Units | 164,893 (67.1%) | 81,005 (32.9%) |
Occupancy by Educational Attainment in Area Code 409
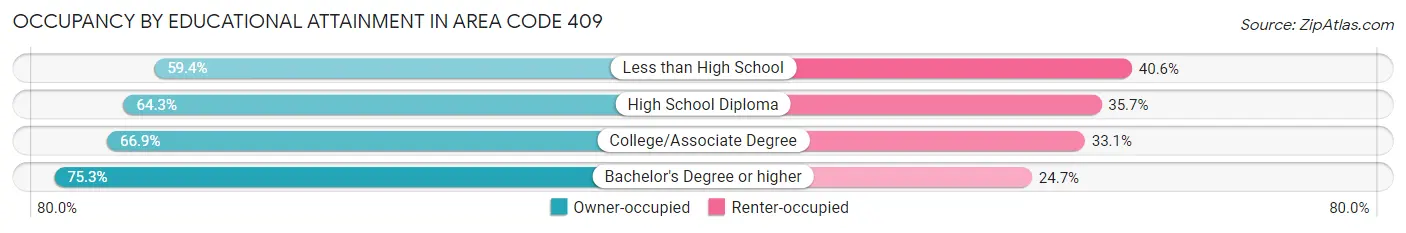
| Household Size | Owner-occupied | Renter-occupied |
| Less than High School | 17,159 (59.4%) | 11,711 (40.6%) |
| High School Diploma | 48,332 (64.3%) | 26,847 (35.7%) |
| College/Associate Degree | 59,129 (66.9%) | 29,236 (33.1%) |
| Bachelor's Degree or higher | 40,273 (75.3%) | 13,211 (24.7%) |
Occupancy by Age of Householder in Area Code 409
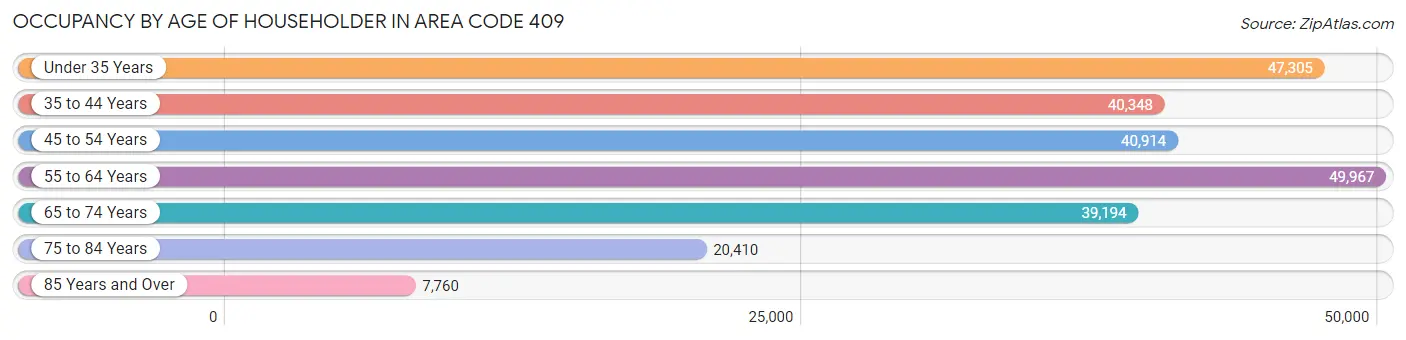
| Age Bracket | # Households | % Households |
| Under 35 Years | 47,305 | 19.2% |
| 35 to 44 Years | 40,348 | 16.4% |
| 45 to 54 Years | 40,914 | 16.6% |
| 55 to 64 Years | 49,967 | 20.3% |
| 65 to 74 Years | 39,194 | 15.9% |
| 75 to 84 Years | 20,410 | 8.3% |
| 85 Years and Over | 7,760 | 3.2% |
| Total | 245,898 | 100.0% |
Housing Finances in Area Code 409
Median Income by Occupancy in Area Code 409
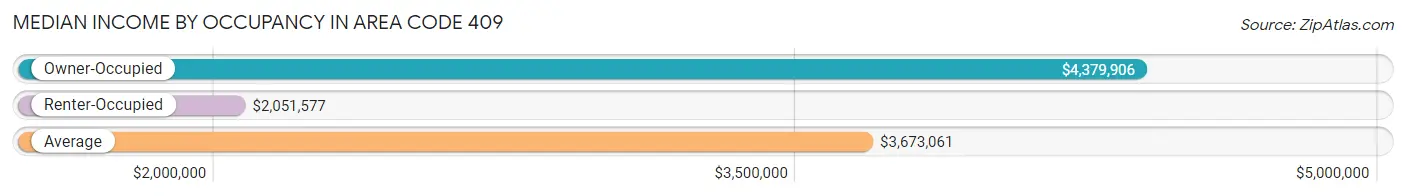
| Occupancy Type | # Households | Median Income |
| Owner-Occupied | 164,893 (67.1%) | $4,379,906 |
| Renter-Occupied | 81,005 (32.9%) | $2,051,577 |
| Average | 245,898 (100.0%) | $3,673,061 |
Occupancy by Householder Income Bracket in Area Code 409
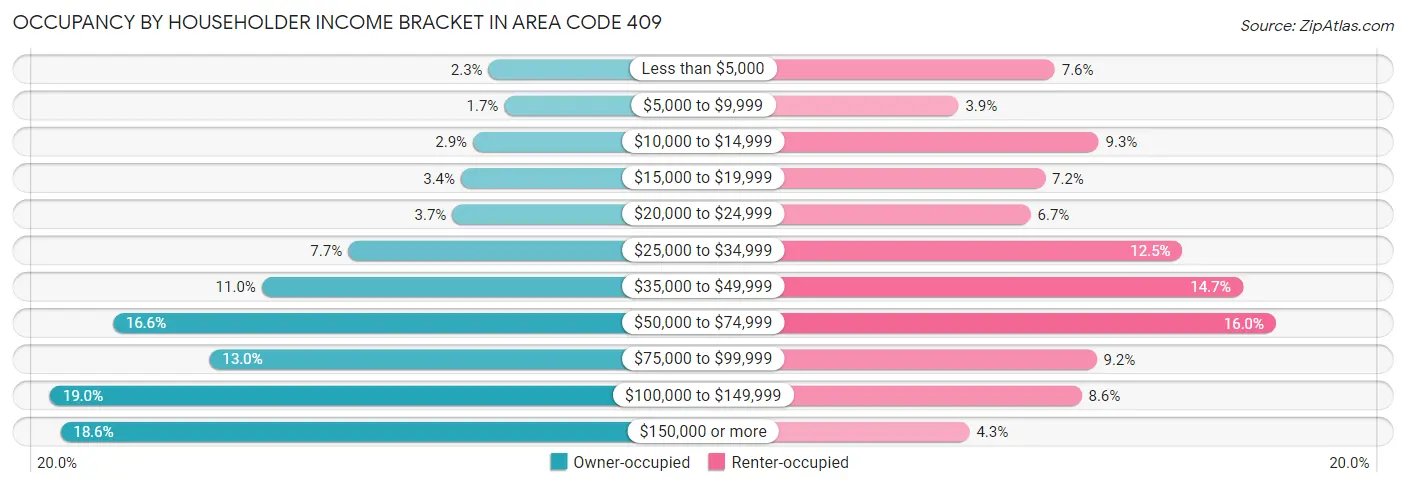
| Income Bracket | Owner-occupied | Renter-occupied |
| Less than $5,000 | 3,840 (2.3%) | 6,147 (7.6%) |
| $5,000 to $9,999 | 2,859 (1.7%) | 3,174 (3.9%) |
| $10,000 to $14,999 | 4,811 (2.9%) | 7,503 (9.3%) |
| $15,000 to $19,999 | 5,578 (3.4%) | 5,851 (7.2%) |
| $20,000 to $24,999 | 6,110 (3.7%) | 5,406 (6.7%) |
| $25,000 to $34,999 | 12,670 (7.7%) | 10,082 (12.4%) |
| $35,000 to $49,999 | 18,086 (11.0%) | 11,938 (14.7%) |
| $50,000 to $74,999 | 27,439 (16.6%) | 12,972 (16.0%) |
| $75,000 to $99,999 | 21,365 (13.0%) | 7,438 (9.2%) |
| $100,000 to $149,999 | 31,397 (19.0%) | 6,977 (8.6%) |
| $150,000 or more | 30,738 (18.6%) | 3,517 (4.3%) |
| Total | 164,893 (100.0%) | 81,005 (100.0%) |
Monthly Housing Cost Tiers in Area Code 409
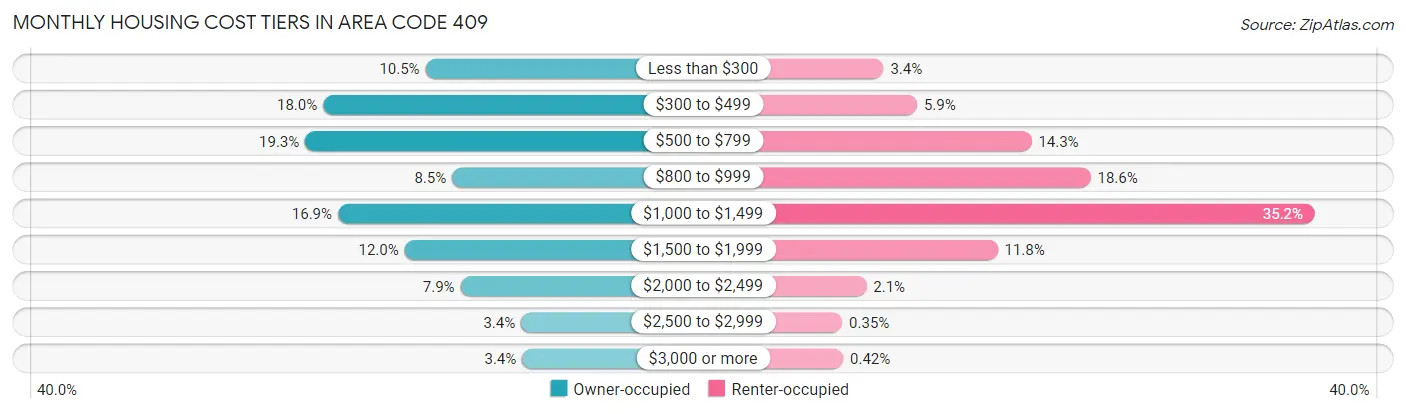
| Monthly Cost | Owner-occupied | Renter-occupied |
| Less than $300 | 17,276 (10.5%) | 2,746 (3.4%) |
| $300 to $499 | 29,718 (18.0%) | 4,744 (5.9%) |
| $500 to $799 | 31,885 (19.3%) | 11,572 (14.3%) |
| $800 to $999 | 14,052 (8.5%) | 15,100 (18.6%) |
| $1,000 to $1,499 | 27,909 (16.9%) | 28,483 (35.2%) |
| $1,500 to $1,999 | 19,820 (12.0%) | 9,549 (11.8%) |
| $2,000 to $2,499 | 13,023 (7.9%) | 1,725 (2.1%) |
| $2,500 to $2,999 | 5,669 (3.4%) | 281 (0.4%) |
| $3,000 or more | 5,541 (3.4%) | 342 (0.4%) |
| Total | 164,893 (100.0%) | 81,005 (100.0%) |
Physical Housing Characteristics in Area Code 409
Housing Structures in Area Code 409
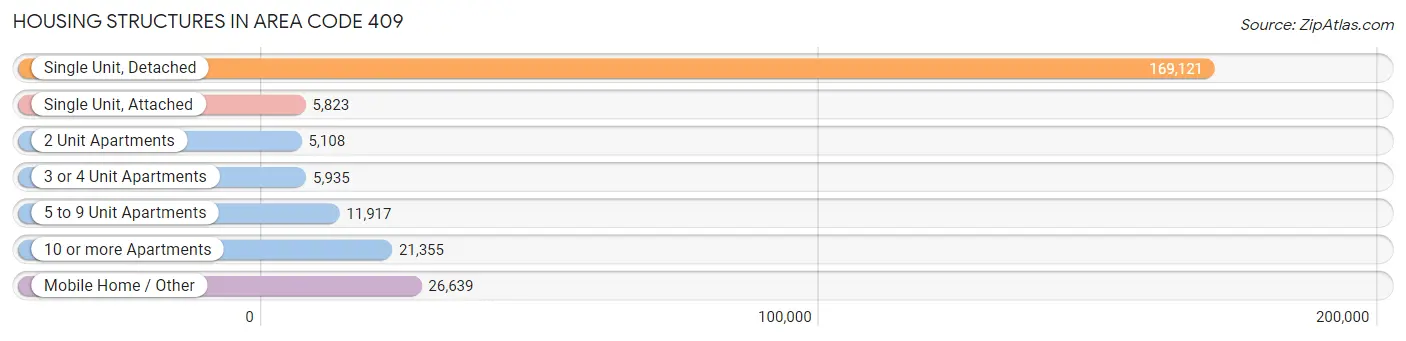
| Structure Type | # Housing Units | % Housing Units |
| Single Unit, Detached | 169,121 | 68.8% |
| Single Unit, Attached | 5,823 | 2.4% |
| 2 Unit Apartments | 5,108 | 2.1% |
| 3 or 4 Unit Apartments | 5,935 | 2.4% |
| 5 to 9 Unit Apartments | 11,917 | 4.9% |
| 10 or more Apartments | 21,355 | 8.7% |
| Mobile Home / Other | 26,639 | 10.8% |
| Total | 245,898 | 100.0% |
Housing Structures by Occupancy in Area Code 409
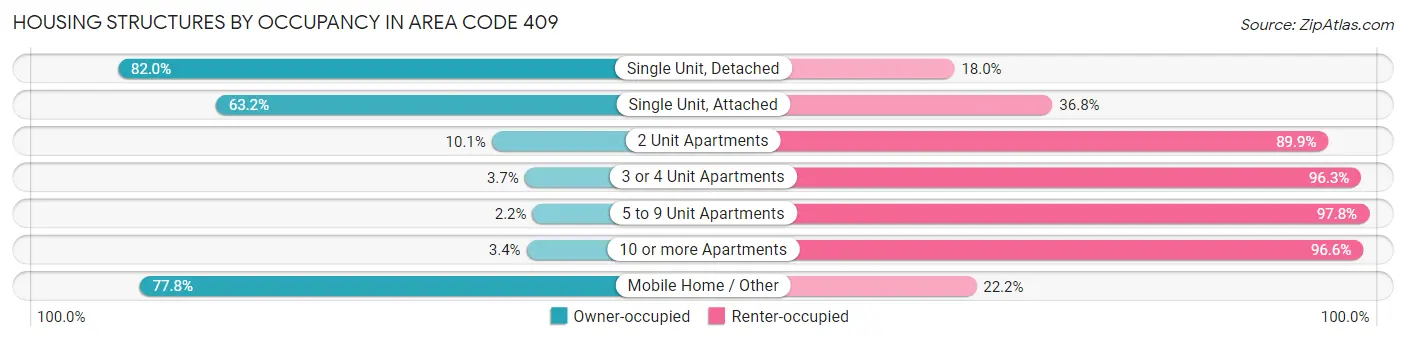
| Structure Type | Owner-occupied | Renter-occupied |
| Single Unit, Detached | 138,755 (82.0%) | 30,366 (18.0%) |
| Single Unit, Attached | 3,679 (63.2%) | 2,144 (36.8%) |
| 2 Unit Apartments | 515 (10.1%) | 4,593 (89.9%) |
| 3 or 4 Unit Apartments | 222 (3.7%) | 5,713 (96.3%) |
| 5 to 9 Unit Apartments | 267 (2.2%) | 11,650 (97.8%) |
| 10 or more Apartments | 719 (3.4%) | 20,636 (96.6%) |
| Mobile Home / Other | 20,736 (77.8%) | 5,903 (22.2%) |
| Total | 164,893 (67.1%) | 81,005 (32.9%) |
Housing Structures by Number of Rooms in Area Code 409
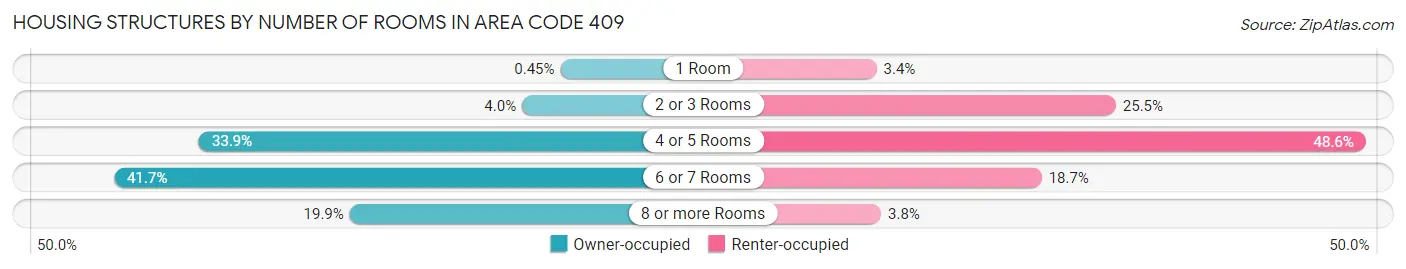
| Number of Rooms | Owner-occupied | Renter-occupied |
| 1 Room | 739 (0.4%) | 2,747 (3.4%) |
| 2 or 3 Rooms | 6,592 (4.0%) | 20,670 (25.5%) |
| 4 or 5 Rooms | 55,858 (33.9%) | 39,388 (48.6%) |
| 6 or 7 Rooms | 68,817 (41.7%) | 15,113 (18.7%) |
| 8 or more Rooms | 32,887 (19.9%) | 3,087 (3.8%) |
| Total | 164,893 (100.0%) | 81,005 (100.0%) |
Housing Structure by Heating Type in Area Code 409
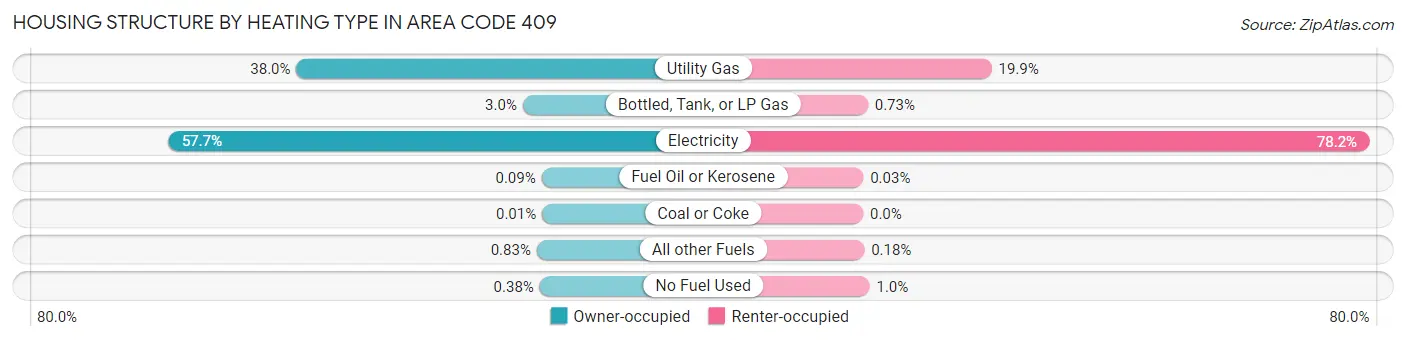
| Heating Type | Owner-occupied | Renter-occupied |
| Utility Gas | 62,642 (38.0%) | 16,088 (19.9%) |
| Bottled, Tank, or LP Gas | 4,928 (3.0%) | 590 (0.7%) |
| Electricity | 95,164 (57.7%) | 63,346 (78.2%) |
| Fuel Oil or Kerosene | 142 (0.1%) | 21 (0.0%) |
| Coal or Coke | 24 (0.0%) | 0 (0.0%) |
| All other Fuels | 1,361 (0.8%) | 148 (0.2%) |
| No Fuel Used | 632 (0.4%) | 812 (1.0%) |
| Total | 164,893 (100.0%) | 81,005 (100.0%) |
Household Vehicle Usage in Area Code 409
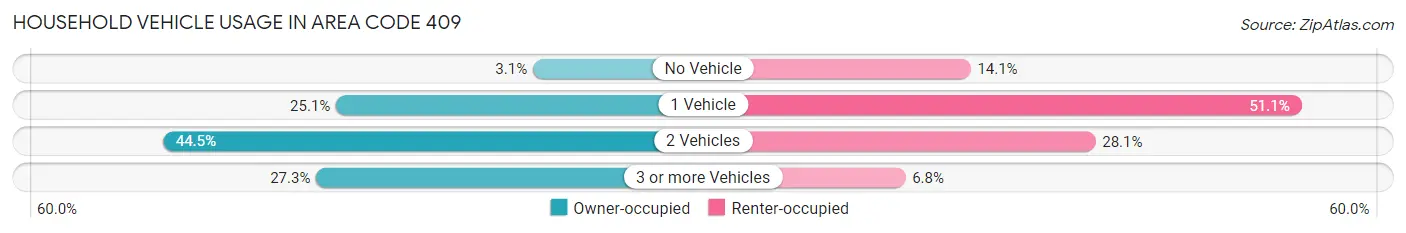
| Vehicles per Household | Owner-occupied | Renter-occupied |
| No Vehicle | 5,024 (3.0%) | 11,387 (14.1%) |
| 1 Vehicle | 41,392 (25.1%) | 41,428 (51.1%) |
| 2 Vehicles | 73,412 (44.5%) | 22,723 (28.1%) |
| 3 or more Vehicles | 45,065 (27.3%) | 5,467 (6.8%) |
| Total | 164,893 (100.0%) | 81,005 (100.0%) |
Real Estate & Mortgages in Area Code 409
Real Estate and Mortgage Overview in Area Code 409
| Characteristic | Without Mortgage | With Mortgage |
| Housing Units | 92,602 | 72,291 |
| Median Property Value | $7,649,800 | $10,758,100 |
| Median Household Income | $3,399,680 | $19,641 |
| Monthly Housing Costs | $29,931 | $5,284 |
| Real Estate Taxes | $86,276 | $3,200 |
Property Value by Mortgage Status in Area Code 409
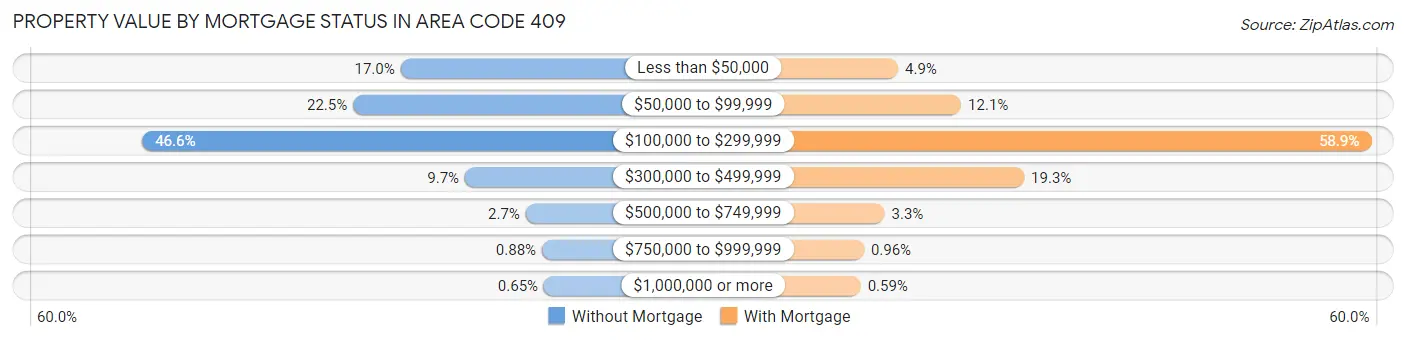
| Property Value | Without Mortgage | With Mortgage |
| Less than $50,000 | 15,779 (17.0%) | 3,516 (4.9%) |
| $50,000 to $99,999 | 20,798 (22.5%) | 8,727 (12.1%) |
| $100,000 to $299,999 | 43,110 (46.6%) | 42,601 (58.9%) |
| $300,000 to $499,999 | 8,965 (9.7%) | 13,932 (19.3%) |
| $500,000 to $749,999 | 2,532 (2.7%) | 2,399 (3.3%) |
| $750,000 to $999,999 | 815 (0.9%) | 692 (1.0%) |
| $1,000,000 or more | 603 (0.6%) | 424 (0.6%) |
| Total | 92,602 (100.0%) | 72,291 (100.0%) |
Household Income by Mortgage Status in Area Code 409
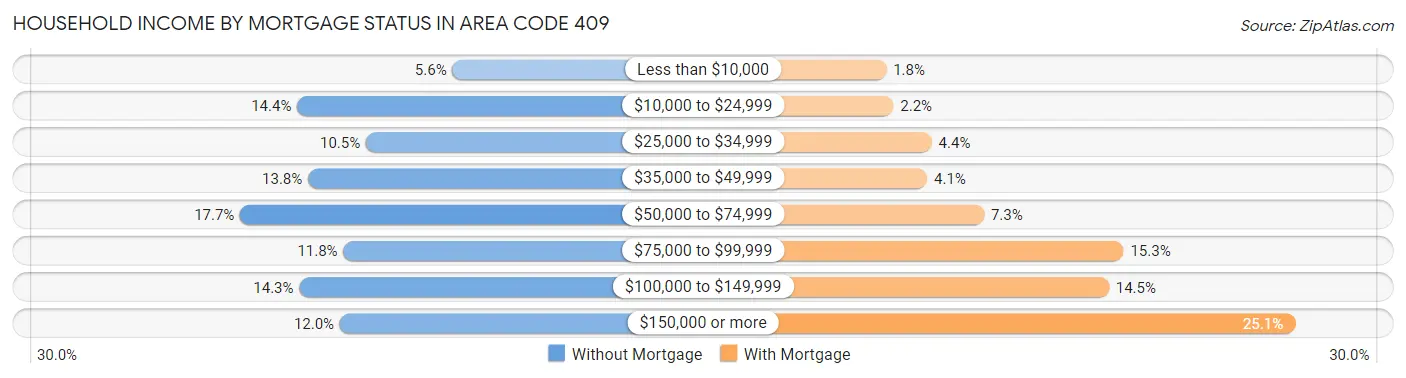
| Household Income | Without Mortgage | With Mortgage |
| Less than $10,000 | 5,135 (5.6%) | 1,263 (1.8%) |
| $10,000 to $24,999 | 13,357 (14.4%) | 1,564 (2.2%) |
| $25,000 to $34,999 | 9,712 (10.5%) | 3,142 (4.3%) |
| $35,000 to $49,999 | 12,778 (13.8%) | 2,958 (4.1%) |
| $50,000 to $74,999 | 16,374 (17.7%) | 5,308 (7.3%) |
| $75,000 to $99,999 | 10,905 (11.8%) | 11,065 (15.3%) |
| $100,000 to $149,999 | 13,244 (14.3%) | 10,460 (14.5%) |
| $150,000 or more | 11,097 (12.0%) | 18,153 (25.1%) |
| Total | 92,602 (100.0%) | 72,291 (100.0%) |
Property Value to Household Income Ratio in Area Code 409
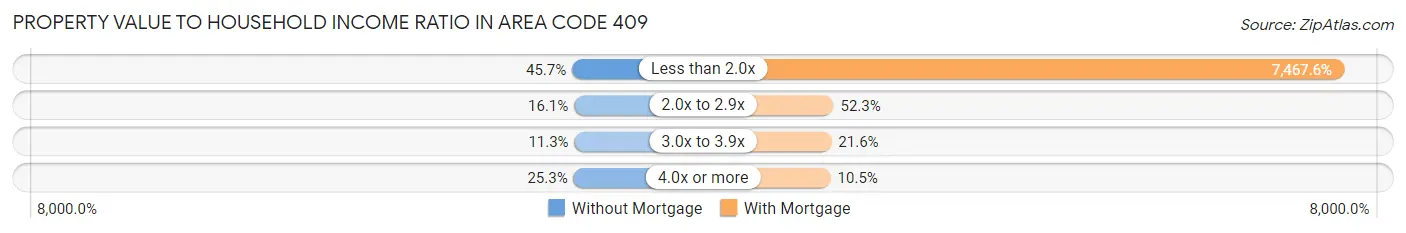
| Value-to-Income Ratio | Without Mortgage | With Mortgage |
| Less than 2.0x | 42,326 (45.7%) | 5,398,365 (7,467.5%) |
| 2.0x to 2.9x | 14,919 (16.1%) | 37,771 (52.2%) |
| 3.0x to 3.9x | 10,486 (11.3%) | 15,610 (21.6%) |
| 4.0x or more | 23,434 (25.3%) | 7,614 (10.5%) |
| Total | 92,602 (100.0%) | 72,291 (100.0%) |
Real Estate Taxes by Mortgage Status in Area Code 409
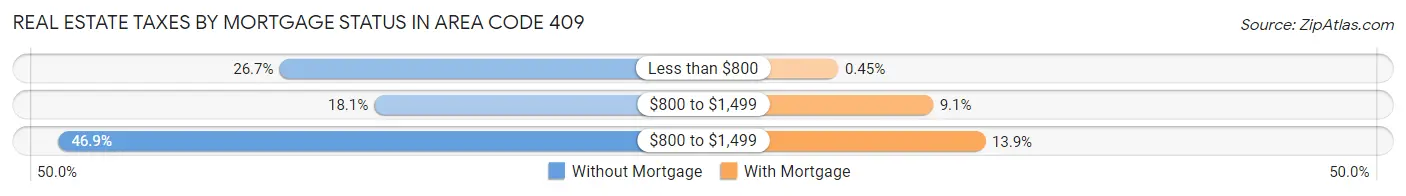
| Property Taxes | Without Mortgage | With Mortgage |
| Less than $800 | 24,759 (26.7%) | 328 (0.4%) |
| $800 to $1,499 | 16,755 (18.1%) | 6,575 (9.1%) |
| $800 to $1,499 | 43,426 (46.9%) | 10,024 (13.9%) |
| Total | 92,602 (100.0%) | 72,291 (100.0%) |
Health & Disability in Area Code 409
Health Insurance Coverage by Age in Area Code 409
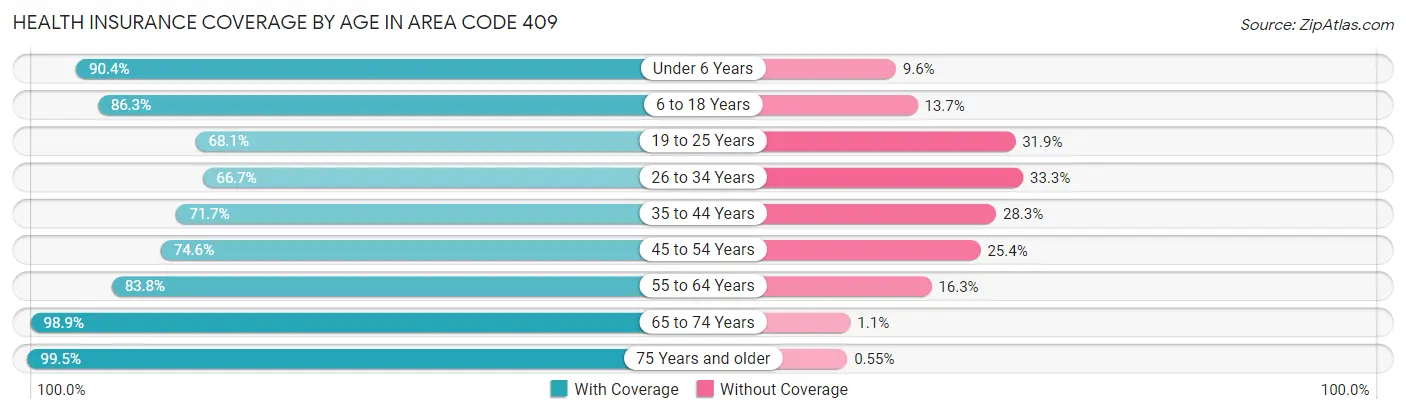
| Age Bracket | With Coverage | Without Coverage |
| Under 6 Years | 44,005 (90.4%) | 4,680 (9.6%) |
| 6 to 18 Years | 95,440 (86.3%) | 15,103 (13.7%) |
| 19 to 25 Years | 37,818 (68.1%) | 17,700 (31.9%) |
| 26 to 34 Years | 49,616 (66.7%) | 24,805 (33.3%) |
| 35 to 44 Years | 54,611 (71.7%) | 21,559 (28.3%) |
| 45 to 54 Years | 55,042 (74.6%) | 18,745 (25.4%) |
| 55 to 64 Years | 70,991 (83.8%) | 13,775 (16.3%) |
| 65 to 74 Years | 61,962 (98.9%) | 712 (1.1%) |
| 75 Years and older | 41,233 (99.5%) | 226 (0.5%) |
| Total | 510,718 (81.3%) | 117,305 (18.7%) |
Health Insurance Coverage by Citizenship Status in Area Code 409
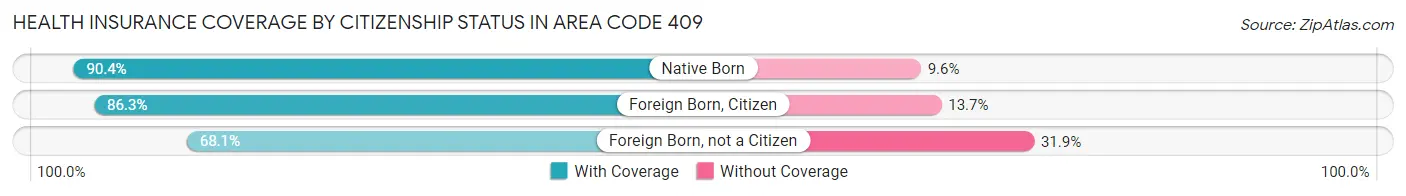
| Citizenship Status | With Coverage | Without Coverage |
| Native Born | 44,005 (90.4%) | 4,680 (9.6%) |
| Foreign Born, Citizen | 95,440 (86.3%) | 15,103 (13.7%) |
| Foreign Born, not a Citizen | 37,818 (68.1%) | 17,700 (31.9%) |
Health Insurance Coverage by Household Income in Area Code 409
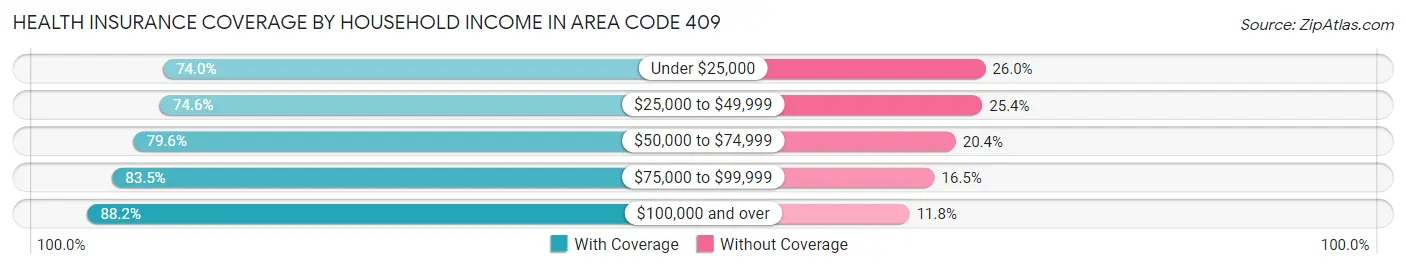
| Household Income | With Coverage | Without Coverage |
| Under $25,000 | 71,655 (74.0%) | 25,144 (26.0%) |
| $25,000 to $49,999 | 91,679 (74.6%) | 31,208 (25.4%) |
| $50,000 to $74,999 | 80,756 (79.6%) | 20,719 (20.4%) |
| $75,000 to $99,999 | 65,785 (83.5%) | 12,963 (16.5%) |
| $100,000 and over | 197,699 (88.2%) | 26,418 (11.8%) |
Public vs Private Health Insurance Coverage by Age in Area Code 409
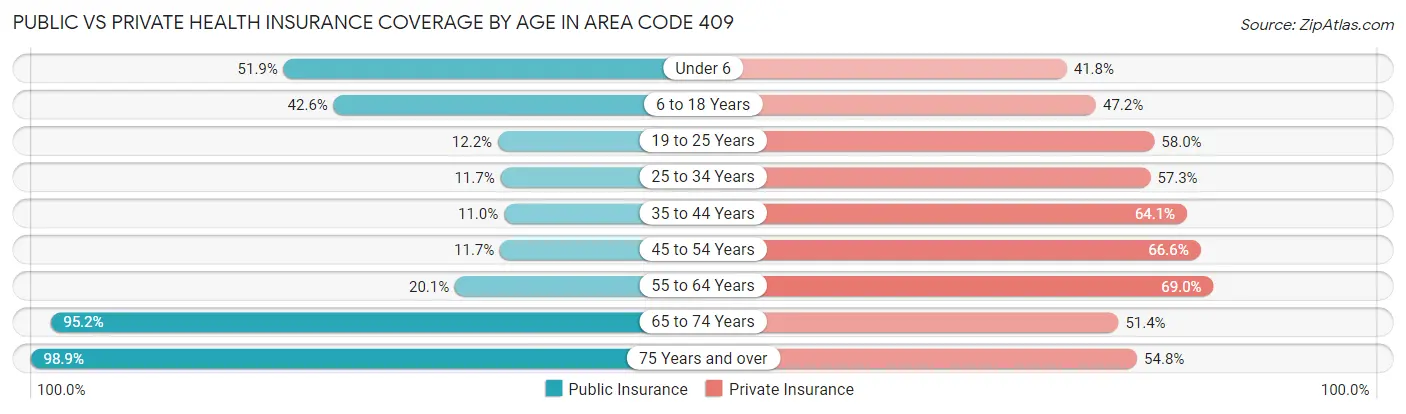
| Age Bracket | Public Insurance | Private Insurance |
| Under 6 | 25,277 (51.9%) | 20,338 (41.8%) |
| 6 to 18 Years | 47,119 (42.6%) | 52,161 (47.2%) |
| 19 to 25 Years | 6,743 (12.1%) | 32,219 (58.0%) |
| 25 to 34 Years | 8,688 (11.7%) | 42,637 (57.3%) |
| 35 to 44 Years | 8,375 (11.0%) | 48,796 (64.1%) |
| 45 to 54 Years | 8,659 (11.7%) | 49,122 (66.6%) |
| 55 to 64 Years | 17,038 (20.1%) | 58,465 (69.0%) |
| 65 to 74 Years | 59,685 (95.2%) | 32,182 (51.3%) |
| 75 Years and over | 41,000 (98.9%) | 22,728 (54.8%) |
| Total | 222,584 (35.4%) | 358,648 (57.1%) |
Disability Status by Sex by Age in Area Code 409
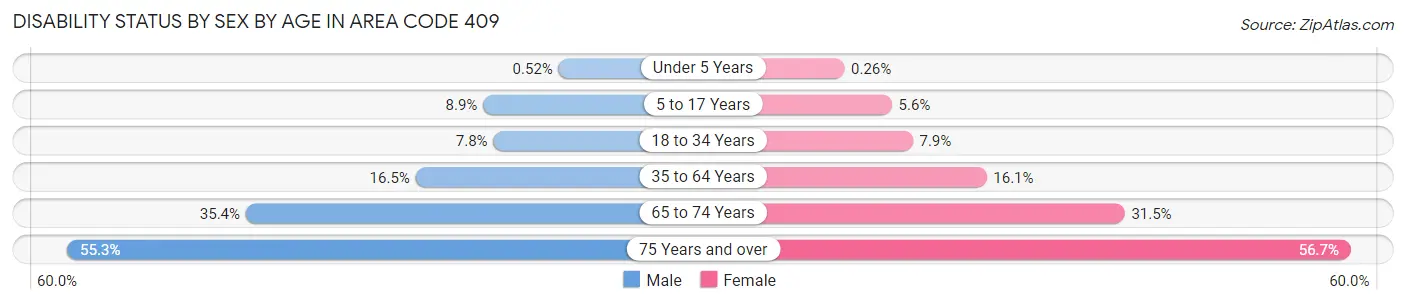
| Age Bracket | Male | Female |
| Under 5 Years | 107 (0.5%) | 50 (0.3%) |
| 5 to 17 Years | 5,013 (8.9%) | 3,059 (5.6%) |
| 18 to 34 Years | 5,430 (7.8%) | 5,366 (7.9%) |
| 35 to 64 Years | 18,874 (16.5%) | 19,320 (16.1%) |
| 65 to 74 Years | 10,590 (35.4%) | 10,303 (31.5%) |
| 75 Years and over | 9,759 (55.3%) | 13,489 (56.7%) |
Disability Class by Sex by Age in Area Code 409
Disability Class: Hearing Difficulty
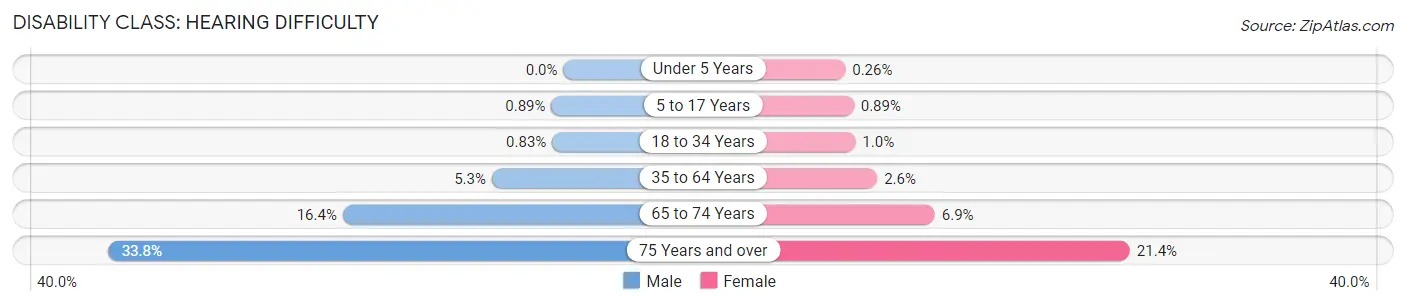
| Age Bracket | Male | Female |
| Under 5 Years | 0 (0.0%) | 50 (0.3%) |
| 5 to 17 Years | 501 (0.9%) | 492 (0.9%) |
| 18 to 34 Years | 582 (0.8%) | 686 (1.0%) |
| 35 to 64 Years | 6,094 (5.3%) | 3,153 (2.6%) |
| 65 to 74 Years | 4,904 (16.4%) | 2,263 (6.9%) |
| 75 Years and over | 5,961 (33.8%) | 5,090 (21.4%) |
Disability Class: Vision Difficulty
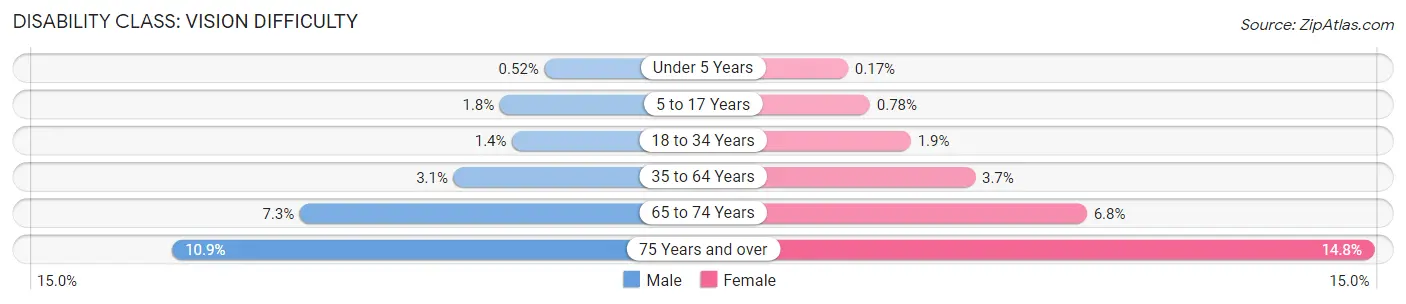
| Age Bracket | Male | Female |
| Under 5 Years | 107 (0.5%) | 34 (0.2%) |
| 5 to 17 Years | 990 (1.8%) | 429 (0.8%) |
| 18 to 34 Years | 990 (1.4%) | 1,306 (1.9%) |
| 35 to 64 Years | 3,496 (3.0%) | 4,454 (3.7%) |
| 65 to 74 Years | 2,195 (7.3%) | 2,233 (6.8%) |
| 75 Years and over | 1,923 (10.9%) | 3,525 (14.8%) |
Disability Class: Cognitive Difficulty
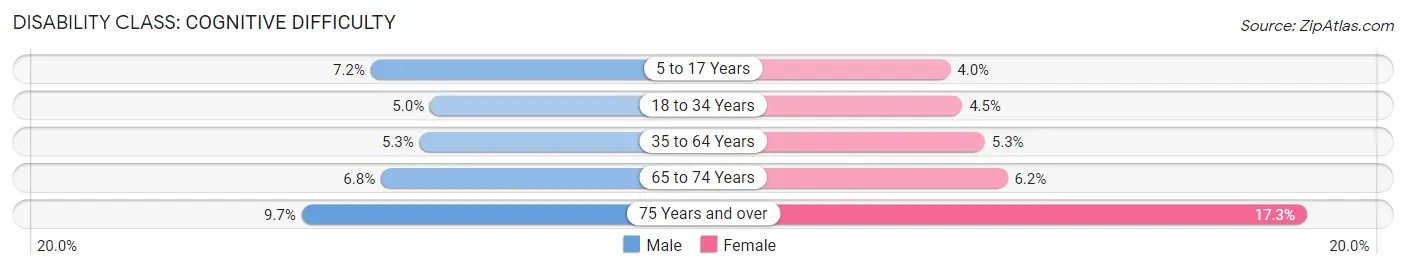
| Age Bracket | Male | Female |
| 5 to 17 Years | 4,014 (7.1%) | 2,220 (4.0%) |
| 18 to 34 Years | 3,450 (5.0%) | 3,043 (4.5%) |
| 35 to 64 Years | 6,126 (5.3%) | 6,373 (5.3%) |
| 65 to 74 Years | 2,026 (6.8%) | 2,014 (6.1%) |
| 75 Years and over | 1,717 (9.7%) | 4,108 (17.3%) |
Disability Class: Ambulatory Difficulty
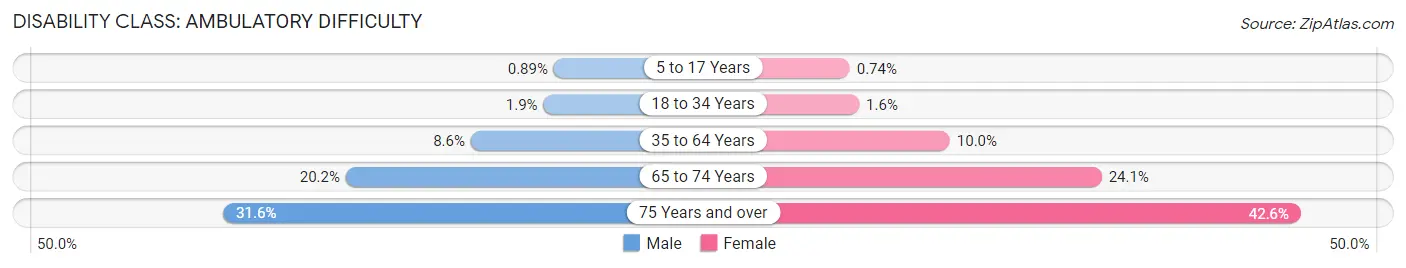
| Age Bracket | Male | Female |
| 5 to 17 Years | 499 (0.9%) | 406 (0.7%) |
| 18 to 34 Years | 1,290 (1.8%) | 1,098 (1.6%) |
| 35 to 64 Years | 9,855 (8.6%) | 12,033 (10.0%) |
| 65 to 74 Years | 6,046 (20.2%) | 7,895 (24.1%) |
| 75 Years and over | 5,576 (31.6%) | 10,139 (42.6%) |
Disability Class: Self-Care Difficulty
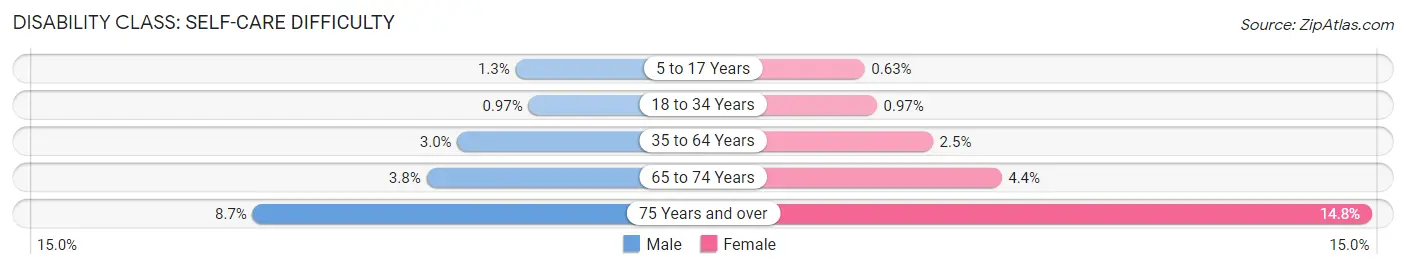
| Age Bracket | Male | Female |
| 5 to 17 Years | 747 (1.3%) | 346 (0.6%) |
| 18 to 34 Years | 674 (1.0%) | 659 (1.0%) |
| 35 to 64 Years | 3,383 (2.9%) | 3,038 (2.5%) |
| 65 to 74 Years | 1,141 (3.8%) | 1,453 (4.4%) |
| 75 Years and over | 1,528 (8.6%) | 3,512 (14.8%) |
Technology Access in Area Code 409
Computing Device Access in Area Code 409
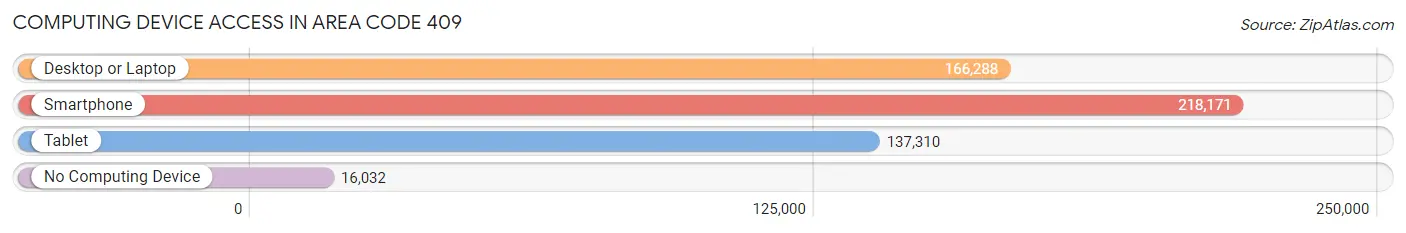
| Device Type | # Households | % Households |
| Desktop or Laptop | 166,288 | 67.6% |
| Smartphone | 218,171 | 88.7% |
| Tablet | 137,310 | 55.8% |
| No Computing Device | 16,032 | 6.5% |
| Total | 245,898 | 100.0% |
Internet Access in Area Code 409
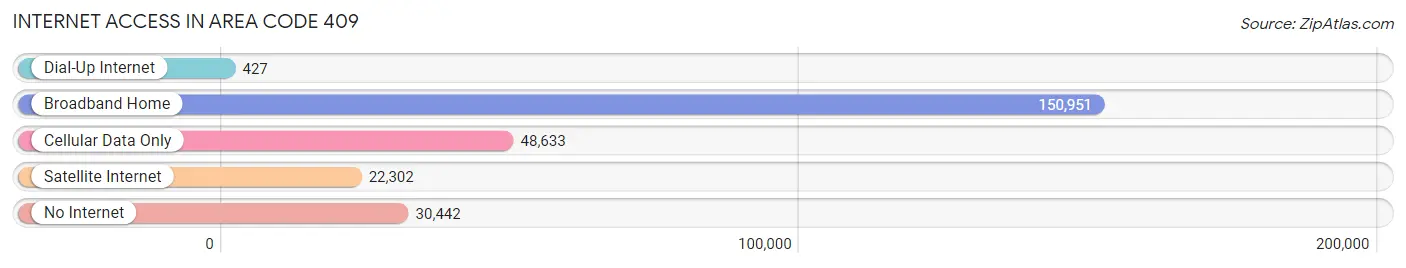
| Internet Type | # Households | % Households |
| Dial-Up Internet | 427 | 0.2% |
| Broadband Home | 150,951 | 61.4% |
| Cellular Data Only | 48,633 | 19.8% |
| Satellite Internet | 22,302 | 9.1% |
| No Internet | 30,442 | 12.4% |
| Total | 245,898 | 100.0% |
Area Code 409 Summary
Geography
Area code 409 is located in the southeastern corner of Texas, covering the cities of Beaumont, Galveston, and Port Arthur. It also covers the counties of Hardin, Jefferson, Orange, and Tyler.
Social
Area code 409 is home to a diverse population of people from all walks of life. The area is known for its strong sense of community and friendly atmosphere.
Economics
Area code 409 is an economically diverse region, with a mix of industries ranging from oil and gas to tourism and manufacturing. The area is also home to several universities and colleges, providing a strong educational base for the region.
Demographics
Area code 409 is home to a population of over 1.2 million people. The population is largely made up of African Americans, Hispanics, and Caucasians. The median household income is around $45,000, and the unemployment rate is around 5%.
Common Questions
What is Per Capita Income in Area Code 409?
Per Capita income in Area Code 409 is $32,246.
What is the Median Family Income in Area Code 409?
Median Family Income in Area Code 409 is $74,911.
What is the Median Household income in Area Code 409?
Median Household Income in Area Code 409 is $61,218.
What is Income or Wage Gap in Area Code 409?
Income or Wage Gap in Area Code 409 is 39.7%.
Women in Area Code 409 earn 60.3 cents for every dollar earned by a man.
What is Family Income Deficit in Area Code 409?
Family Income Deficit in Area Code 409 is $11,958.
Families that are below poverty line in Area Code 409 earn $11,958 less on average than the poverty threshold level.
What is Inequality or Gini Index in Area Code 409?
Inequality or Gini Index in Area Code 409 is 27.39.
What is the Total Population of Area Code 409?
Total Population of Area Code 409 is 649,887.
What is the Total Male Population of Area Code 409?
Total Male Population of Area Code 409 is 327,320.
What is the Total Female Population of Area Code 409?
Total Female Population of Area Code 409 is 322,567.
What is the Ratio of Males per 100 Females in Area Code 409?
There are 101.47 Males per 100 Females in Area Code 409.
What is the Ratio of Females per 100 Males in Area Code 409?
There are 98.55 Females per 100 Males in Area Code 409.
What is the Median Population Age in Area Code 409?
Median Population Age in Area Code 409 is 41.9 Years.
What is the Average Family Size in Area Code 409
Average Family Size in Area Code 409 is 3.1 People.
What is the Average Household Size in Area Code 409
Average Household Size in Area Code 409 is 2.6 People.
How Large is the Labor Force in Area Code 409?
There are 290,472 People in the Labor Forcein in Area Code 409.
What is the Percentage of People in the Labor Force in Area Code 409?
56.4% of People are in the Labor Force in Area Code 409.
What is the Unemployment Rate in Area Code 409?
Unemployment Rate in Area Code 409 is 8.1%.