Area Code 504 Map & Demographics
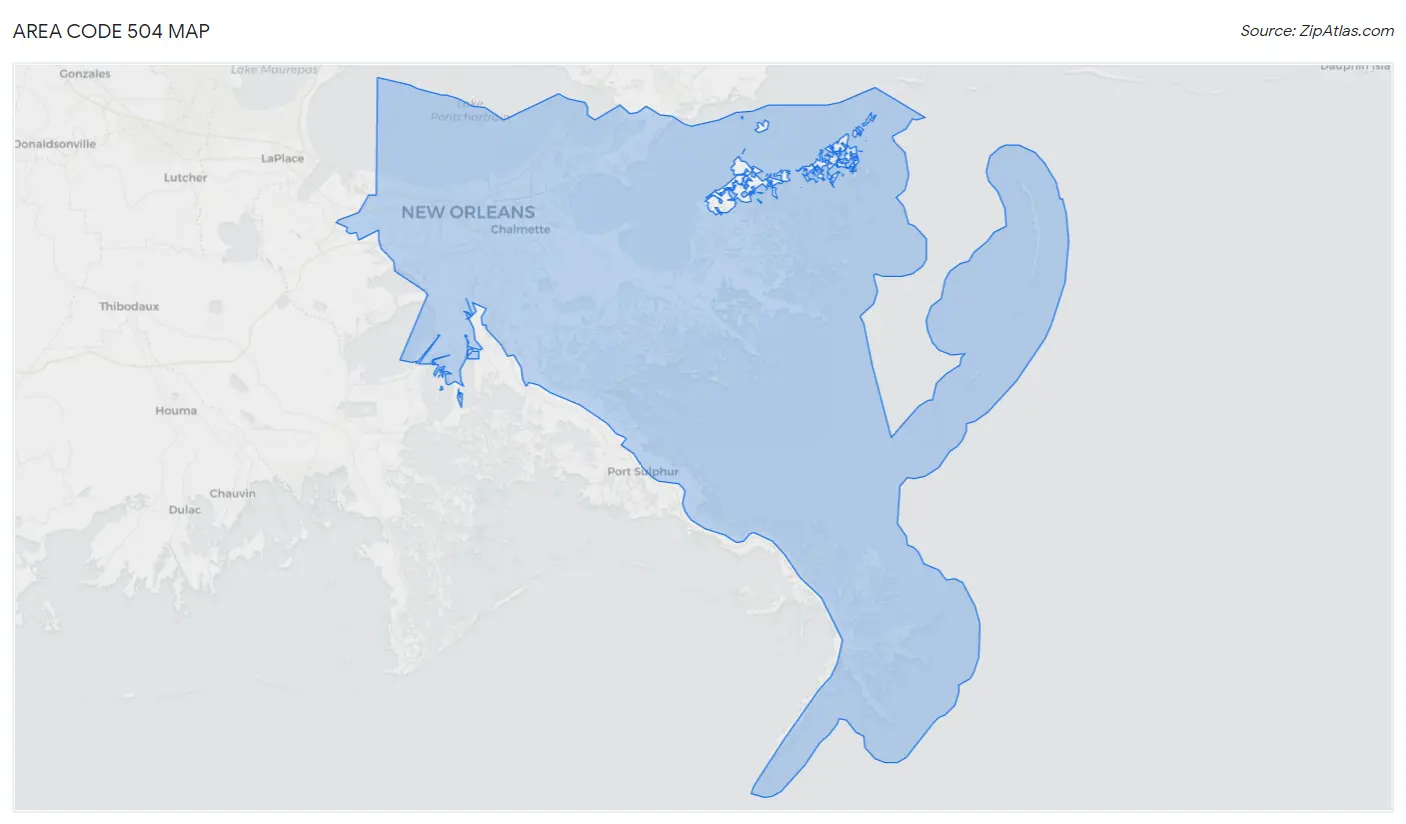
Area Code 504 Map
Area Code 504 Overview
$34,661
PER CAPITA INCOME
$75,753
AVG FAMILY INCOME
$56,699
AVG HOUSEHOLD INCOME
25.9%
WAGE / INCOME GAP [ % ]
74.1¢/ $1
WAGE / INCOME GAP [ $ ]
$10,811
FAMILY INCOME DEFICIT
21.51
INEQUALITY / GINI INDEX
858,154
TOTAL POPULATION
412,367
MALE POPULATION
445,787
FEMALE POPULATION
92.50
MALES / 100 FEMALES
108.10
FEMALES / 100 MALES
38.7
MEDIAN AGE
3.4
AVG FAMILY SIZE
2.5
AVG HOUSEHOLD SIZE
421,816
LABOR FORCE [ PEOPLE ]
60.7%
PERCENT IN LABOR FORCE
7.6%
UNEMPLOYMENT RATE
Income in Area Code 504
Income Overview in Area Code 504
Per Capita Income in Area Code 504 is $34,661, while median incomes of families and households are $75,753 and $56,699 respectively.
| Characteristic | Number | Measure |
| Per Capita Income | 858,154 | $34,661 |
| Median Family Income | 191,933 | $75,753 |
| Mean Family Income | 191,933 | $4,333,433 |
| Median Household Income | 346,811 | $56,699 |
| Mean Household Income | 346,811 | $3,516,225 |
| Income Deficit | 191,933 | $10,811 |
| Wage / Income Gap (%) | 858,154 | 25.86% |
| Wage / Income Gap ($) | 858,154 | 74.14¢ per $1 |
| Gini / Inequality Index | 858,154 | 21.51 |
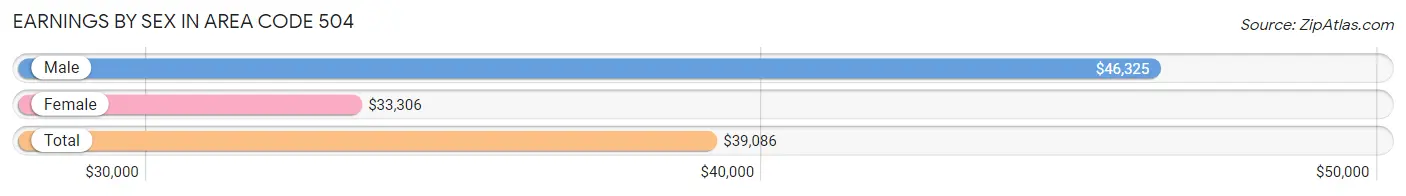
Earnings by Sex in Area Code 504
Average Earnings in Area Code 504 are $39,086, $46,325 for men and $33,306 for women, a difference of 28.1%.
| Sex | Number | Average Earnings |
| Male | 224,719 (49.9%) | $46,325 |
| Female | 225,466 (50.1%) | $33,306 |
| Total | 450,185 (100.0%) | $39,086 |
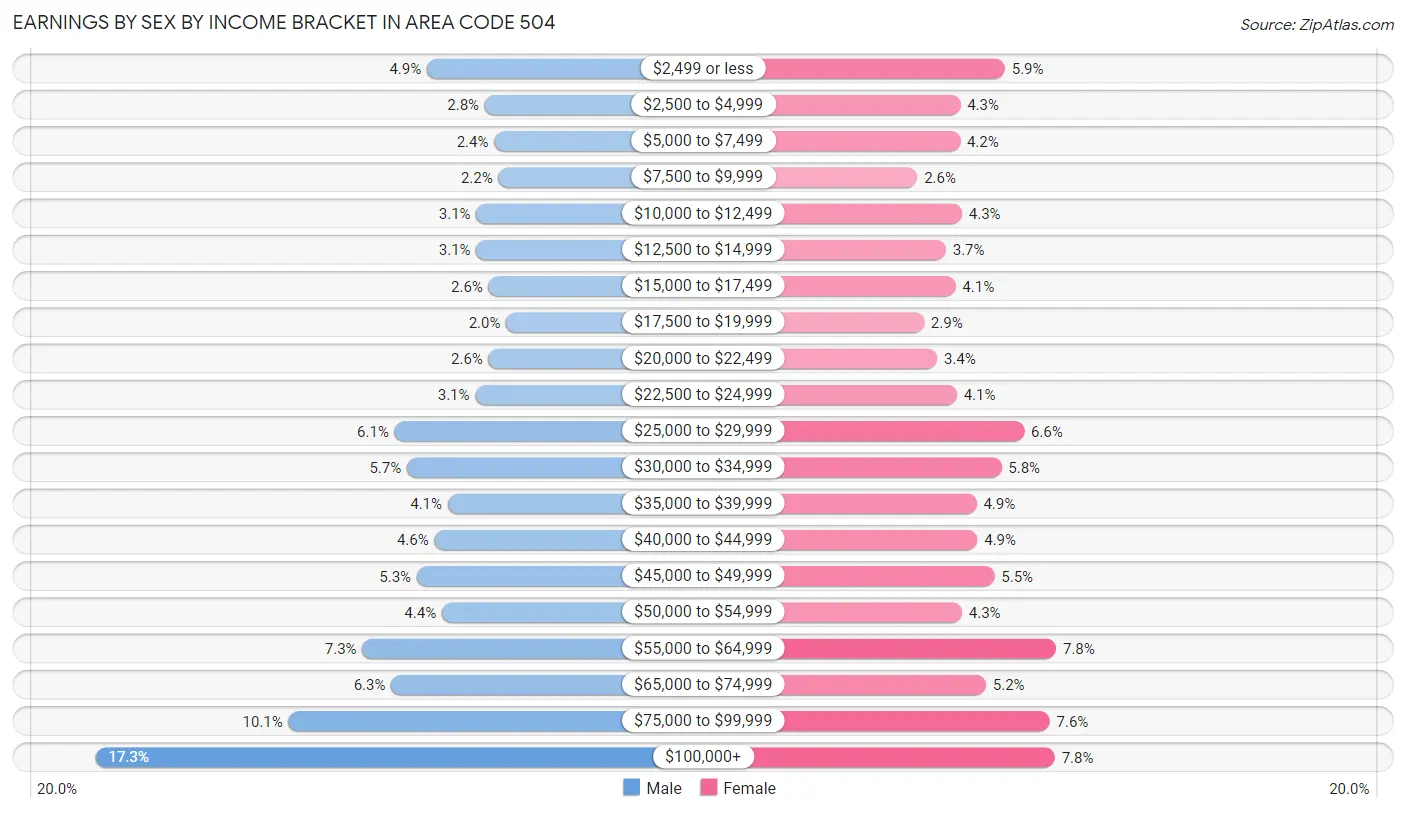
Earnings by Sex by Income Bracket in Area Code 504
The most common earnings brackets in Area Code 504 are $100,000+ for men (38,963 | 17.3%) and $55,000 to $64,999 for women (17,680 | 7.8%).
| Income | Male | Female |
| $2,499 or less | 11,051 (4.9%) | 13,342 (5.9%) |
| $2,500 to $4,999 | 6,170 (2.8%) | 9,581 (4.3%) |
| $5,000 to $7,499 | 5,404 (2.4%) | 9,565 (4.2%) |
| $7,500 to $9,999 | 5,024 (2.2%) | 5,945 (2.6%) |
| $10,000 to $12,499 | 6,897 (3.1%) | 9,721 (4.3%) |
| $12,500 to $14,999 | 6,892 (3.1%) | 8,370 (3.7%) |
| $15,000 to $17,499 | 5,859 (2.6%) | 9,174 (4.1%) |
| $17,500 to $19,999 | 4,376 (1.9%) | 6,521 (2.9%) |
| $20,000 to $22,499 | 5,859 (2.6%) | 7,613 (3.4%) |
| $22,500 to $24,999 | 6,993 (3.1%) | 9,299 (4.1%) |
| $25,000 to $29,999 | 13,782 (6.1%) | 14,978 (6.6%) |
| $30,000 to $34,999 | 12,748 (5.7%) | 13,048 (5.8%) |
| $35,000 to $39,999 | 9,298 (4.1%) | 10,968 (4.9%) |
| $40,000 to $44,999 | 10,427 (4.6%) | 11,031 (4.9%) |
| $45,000 to $49,999 | 11,905 (5.3%) | 12,474 (5.5%) |
| $50,000 to $54,999 | 9,796 (4.4%) | 9,718 (4.3%) |
| $55,000 to $64,999 | 16,501 (7.3%) | 17,680 (7.8%) |
| $65,000 to $74,999 | 14,060 (6.3%) | 11,736 (5.2%) |
| $75,000 to $99,999 | 22,714 (10.1%) | 17,145 (7.6%) |
| $100,000+ | 38,963 (17.3%) | 17,557 (7.8%) |
| Total | 224,719 (100.0%) | 225,466 (100.0%) |
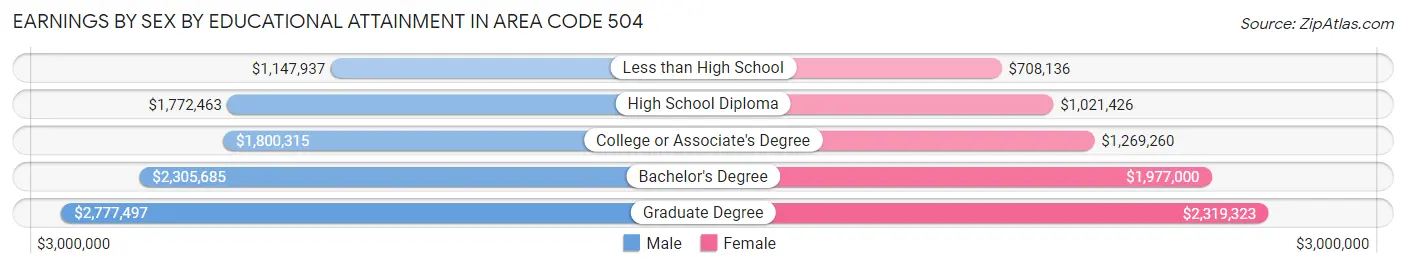
Earnings by Sex by Educational Attainment in Area Code 504
Average earnings in Area Code 504 are $2,174,482 for men and $1,605,397 for women, a difference of 26.2%. Men with an educational attainment of graduate degree enjoy the highest average annual earnings of $2,777,497, while those with less than high school education earn the least with $1,147,937. Women with an educational attainment of graduate degree earn the most with the average annual earnings of $2,319,323, while those with less than high school education have the smallest earnings of $708,136.
| Educational Attainment | Male Income | Female Income |
| Less than High School | $1,147,937 | $708,136 |
| High School Diploma | $1,772,463 | $1,021,426 |
| College or Associate's Degree | $1,800,315 | $1,269,260 |
| Bachelor's Degree | $2,305,685 | $1,977,000 |
| Graduate Degree | $2,777,497 | $2,319,323 |
| Total | $2,174,482 | $1,605,397 |
Family Income in Area Code 504
Family Income Brackets in Area Code 504
According to the Area Code 504 family income data, there are 1,300,730 families falling into the $100,000 to $149,999 income range, which is the most common income bracket and makes up 677.7% of all families. Conversely, the $10,000 to $14,999 income bracket is the least frequent group with only 313,235 families (163.2%) belonging to this category.
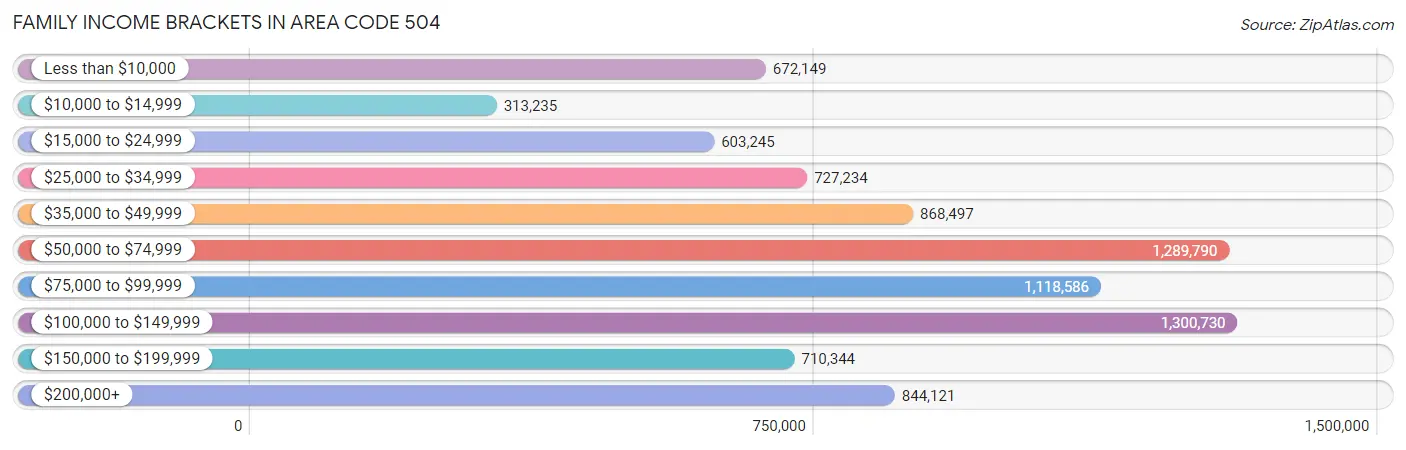
| Income Bracket | # Families | % Families |
| Less than $10,000 | 672,149 | 350.2% |
| $10,000 to $14,999 | 313,235 | 163.2% |
| $15,000 to $24,999 | 603,245 | 314.3% |
| $25,000 to $34,999 | 727,234 | 378.9% |
| $35,000 to $49,999 | 868,497 | 452.5% |
| $50,000 to $74,999 | 1,289,790 | 672.0% |
| $75,000 to $99,999 | 1,118,586 | 582.8% |
| $100,000 to $149,999 | 1,300,730 | 677.7% |
| $150,000 to $199,999 | 710,344 | 370.1% |
| $200,000+ | 844,121 | 439.8% |
Family Income by Famaliy Size in Area Code 504
6-person families (4,606 | 2.4%) account for the highest median family income in Area Code 504 with $116,045 per family, while 2-person families (93,687 | 48.8%) have the highest median income of $35,023 per family member.
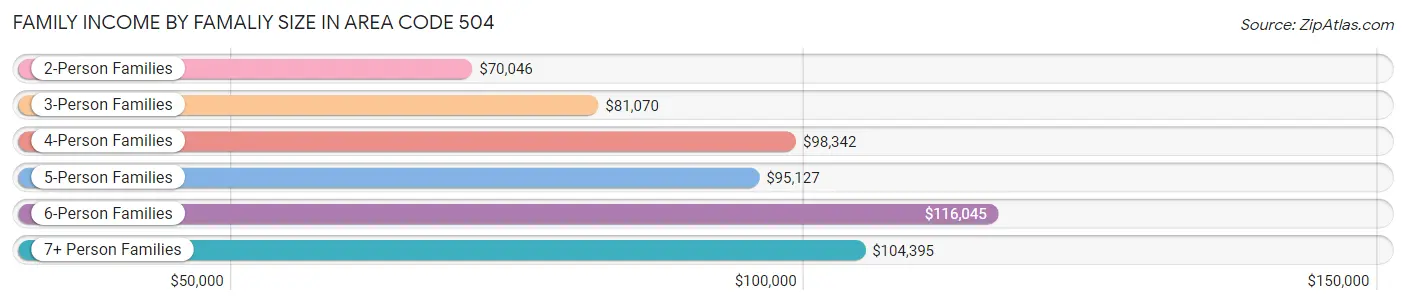
| Income Bracket | # Families | Median Income |
| 2-Person Families | 93,687 (48.8%) | $70,046 |
| 3-Person Families | 45,911 (23.9%) | $81,070 |
| 4-Person Families | 32,622 (17.0%) | $98,342 |
| 5-Person Families | 12,736 (6.6%) | $95,127 |
| 6-Person Families | 4,606 (2.4%) | $116,045 |
| 7+ Person Families | 2,371 (1.2%) | $104,395 |
| Total | 191,933 (100.0%) | $75,753 |
Family Income by Number of Earners in Area Code 504
The median family income in Area Code 504 is $75,753, with families comprising 3+ earners (17,465) having the highest median family income of $140,777, while families with no earners (28,618) have the lowest median family income of $36,453, accounting for 9.1% and 14.9% of families, respectively.
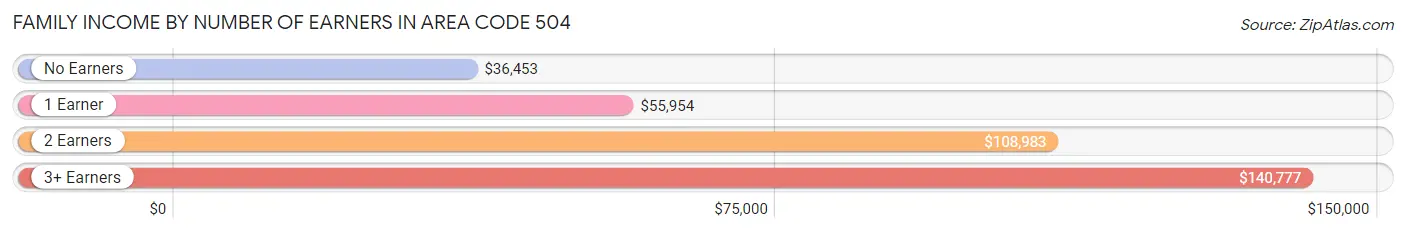
| Number of Earners | # Families | Median Income |
| No Earners | 28,618 (14.9%) | $36,453 |
| 1 Earner | 69,241 (36.1%) | $55,954 |
| 2 Earners | 76,609 (39.9%) | $108,983 |
| 3+ Earners | 17,465 (9.1%) | $140,777 |
| Total | 191,933 (100.0%) | $75,753 |
Household Income in Area Code 504
Household Income Brackets in Area Code 504
With 2,376,349 households falling in the category, the $50,000 to $74,999 income range is the most frequent in Area Code 504, accounting for 685.2% of all households. In contrast, only 955,464 households (275.5%) fall into the $10,000 to $14,999 income bracket, making it the least populous group.
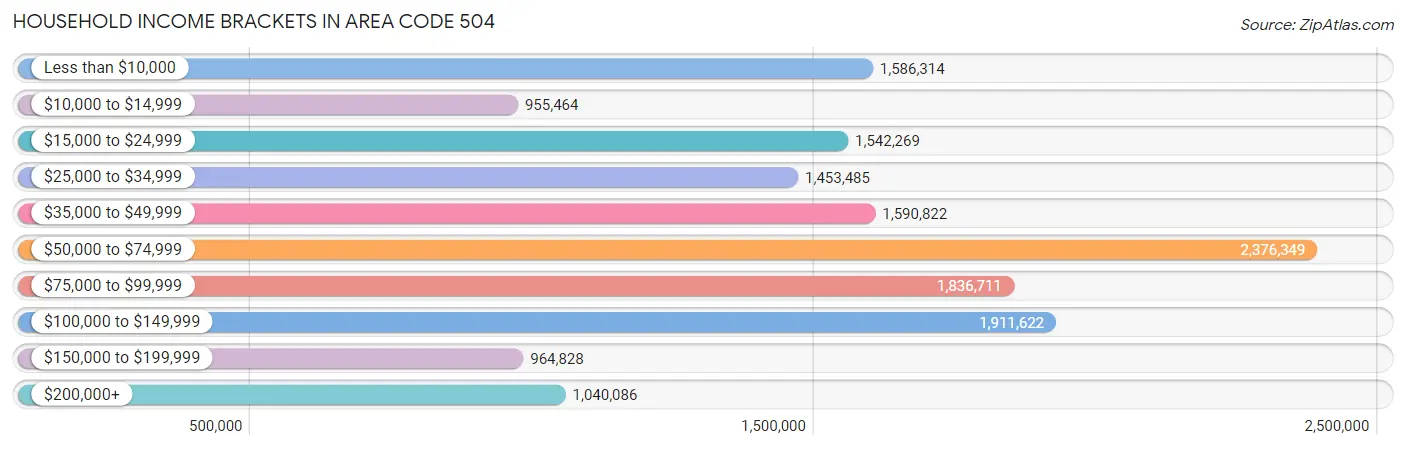
| Income Bracket | # Households | % Households |
| Less than $10,000 | 1,586,314 | 457.4% |
| $10,000 to $14,999 | 955,464 | 275.5% |
| $15,000 to $24,999 | 1,542,269 | 444.7% |
| $25,000 to $34,999 | 1,453,485 | 419.1% |
| $35,000 to $49,999 | 1,590,822 | 458.7% |
| $50,000 to $74,999 | 2,376,349 | 685.2% |
| $75,000 to $99,999 | 1,836,711 | 529.6% |
| $100,000 to $149,999 | 1,911,622 | 551.2% |
| $150,000 to $199,999 | 964,828 | 278.2% |
| $200,000+ | 1,040,086 | 299.9% |
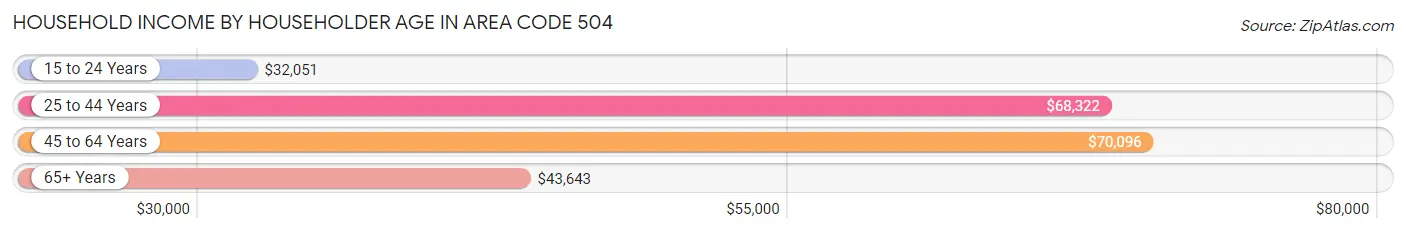
Household Income by Householder Age in Area Code 504
The median household income in Area Code 504 is $56,699, with the highest median household income of $70,096 found in the 45 to 64 years age bracket for the primary householder. A total of 125,796 households (36.3%) fall into this category. Meanwhile, the 15 to 24 years age bracket for the primary householder has the lowest median household income of $32,051, with 8,546 households (2.5%) in this group.
| Income Bracket | # Households | Median Income |
| 15 to 24 Years | 8,546 (2.5%) | $32,051 |
| 25 to 44 Years | 119,596 (34.5%) | $68,322 |
| 45 to 64 Years | 125,796 (36.3%) | $70,096 |
| 65+ Years | 92,873 (26.8%) | $43,643 |
| Total | 346,811 (100.0%) | $56,699 |
Poverty in Area Code 504
Income Below Poverty by Sex and Age in Area Code 504
With 17.3% poverty level for males and 19.7% for females among the residents of Area Code 504, under 5 year old males and 15 year old females are the most vulnerable to poverty, with 7,046 males (27.3%) and 1,252 females (27.6%) in their respective age groups living below the poverty level.
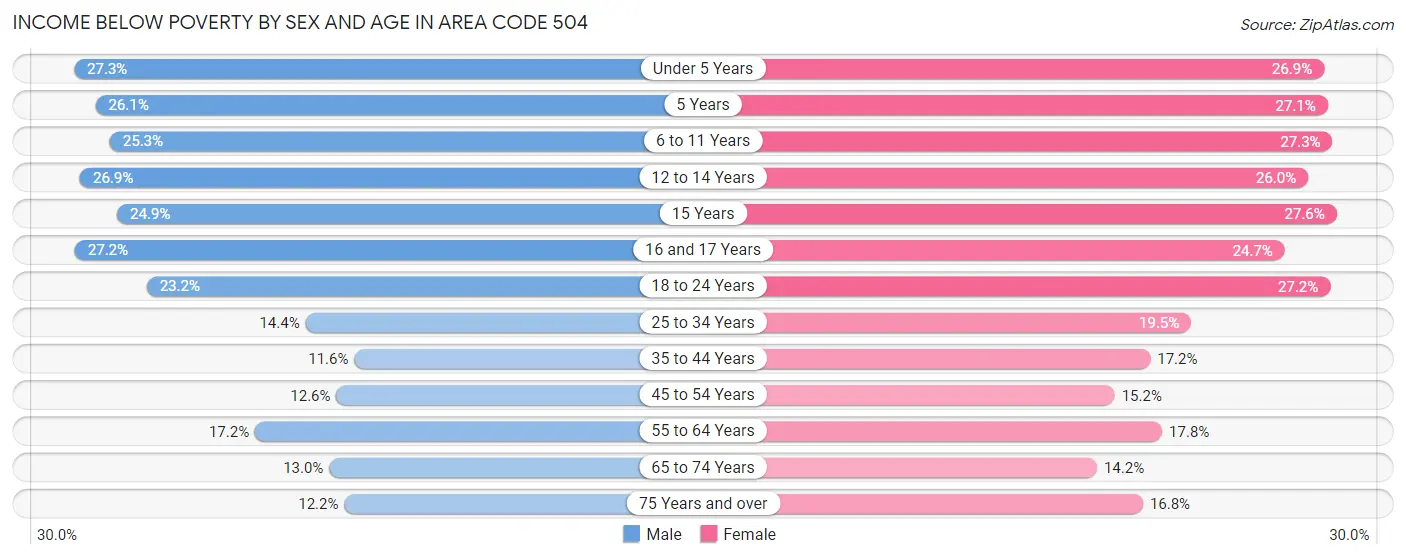
| Age Bracket | Male | Female |
| Under 5 Years | 7,046 (27.3%) | 6,577 (26.9%) |
| 5 Years | 1,217 (26.1%) | 1,190 (27.1%) |
| 6 to 11 Years | 7,695 (25.3%) | 8,154 (27.3%) |
| 12 to 14 Years | 4,344 (26.9%) | 3,970 (26.0%) |
| 15 Years | 1,312 (24.8%) | 1,252 (27.6%) |
| 16 and 17 Years | 2,588 (27.2%) | 2,539 (24.7%) |
| 18 to 24 Years | 7,191 (23.2%) | 8,486 (27.2%) |
| 25 to 34 Years | 8,556 (14.4%) | 12,982 (19.5%) |
| 35 to 44 Years | 6,658 (11.6%) | 10,401 (17.2%) |
| 45 to 54 Years | 6,072 (12.6%) | 7,802 (15.2%) |
| 55 to 64 Years | 9,298 (17.2%) | 10,470 (17.8%) |
| 65 to 74 Years | 5,252 (13.0%) | 6,628 (14.2%) |
| 75 Years and over | 2,667 (12.2%) | 5,435 (16.8%) |
| Total | 69,896 (17.3%) | 85,886 (19.7%) |
Income Above Poverty by Sex and Age in Area Code 504
According to the poverty statistics in Area Code 504, males aged 35 to 44 years and females aged 65 to 74 years are the age groups that are most secure financially, with 88.4% of males and 85.8% of females in these age groups living above the poverty line.
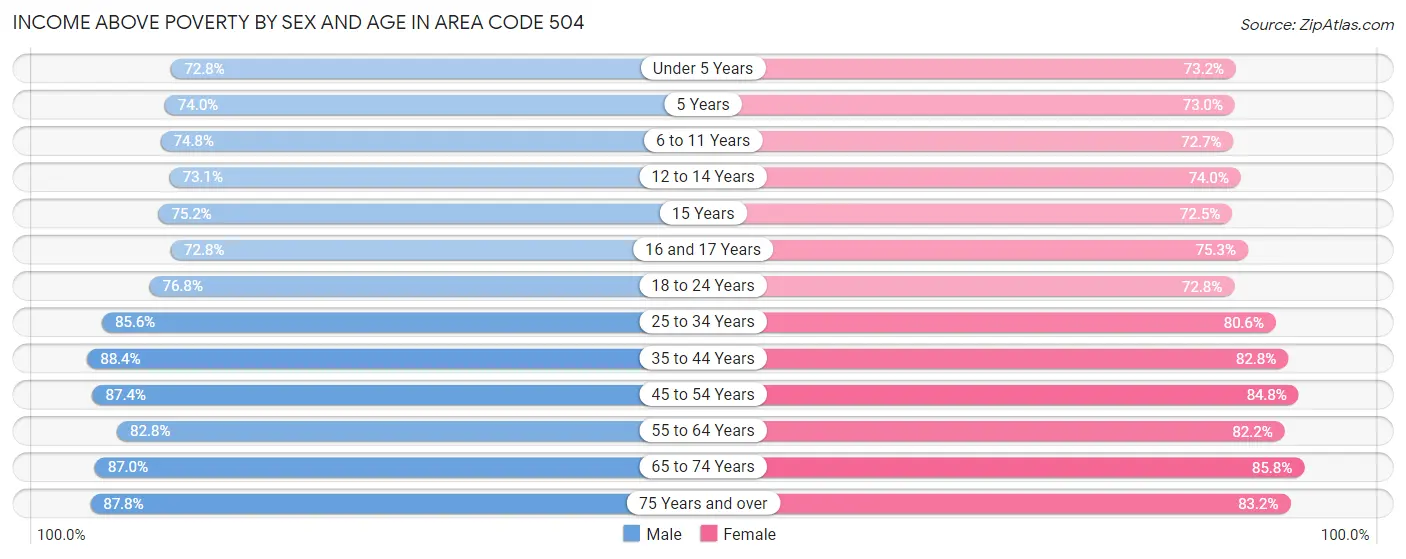
| Age Bracket | Male | Female |
| Under 5 Years | 18,809 (72.8%) | 17,915 (73.2%) |
| 5 Years | 3,455 (74.0%) | 3,209 (73.0%) |
| 6 to 11 Years | 22,783 (74.8%) | 21,691 (72.7%) |
| 12 to 14 Years | 11,801 (73.1%) | 11,323 (74.0%) |
| 15 Years | 3,968 (75.1%) | 3,293 (72.5%) |
| 16 and 17 Years | 6,926 (72.8%) | 7,758 (75.3%) |
| 18 to 24 Years | 23,803 (76.8%) | 22,723 (72.8%) |
| 25 to 34 Years | 51,013 (85.6%) | 53,752 (80.5%) |
| 35 to 44 Years | 50,527 (88.4%) | 50,137 (82.8%) |
| 45 to 54 Years | 41,966 (87.4%) | 43,517 (84.8%) |
| 55 to 64 Years | 44,863 (82.8%) | 48,224 (82.2%) |
| 65 to 74 Years | 35,025 (87.0%) | 40,008 (85.8%) |
| 75 Years and over | 19,187 (87.8%) | 26,966 (83.2%) |
| Total | 334,126 (82.7%) | 350,516 (80.3%) |
Income Below Poverty Among Married-Couple Families in Area Code 504
The poverty statistics for married-couple families in Area Code 504 show that 5.4% or 6,640 of the total 122,551 families live below the poverty line. Families with 5 or more children have the highest poverty rate of 30.9%, comprising of 195 families. On the other hand, families with no children have the lowest poverty rate of 3.8%, which includes 2,840 families.
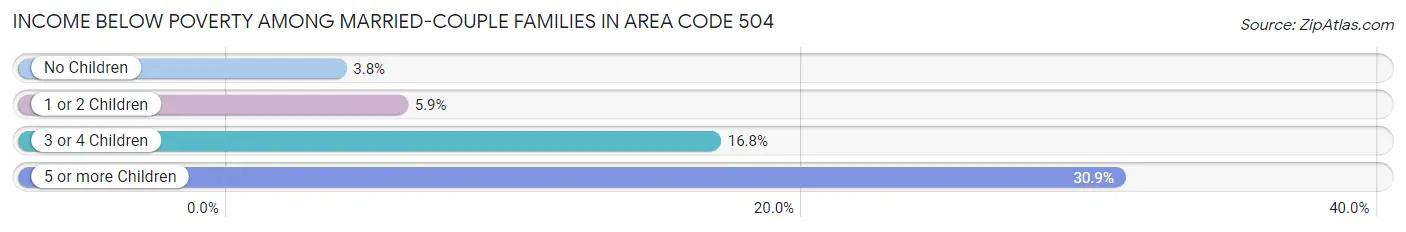
| Children | Above Poverty | Below Poverty |
| No Children | 72,414 (96.2%) | 2,840 (3.8%) |
| 1 or 2 Children | 36,601 (94.1%) | 2,300 (5.9%) |
| 3 or 4 Children | 6,460 (83.2%) | 1,305 (16.8%) |
| 5 or more Children | 436 (69.1%) | 195 (30.9%) |
| Total | 115,911 (94.6%) | 6,640 (5.4%) |
Income Below Poverty Among Single-Parent Households in Area Code 504
According to the poverty data in Area Code 504, 19.7% or 3,207 single-father households and 30.5% or 16,172 single-mother households are living below the poverty line. Among single-father households, those with 3 or 4 children have the highest poverty rate, with 441 households (33.8%) experiencing poverty. Likewise, among single-mother households, those with 5 or more children have the highest poverty rate, with 376 households (70.8%) falling below the poverty line.
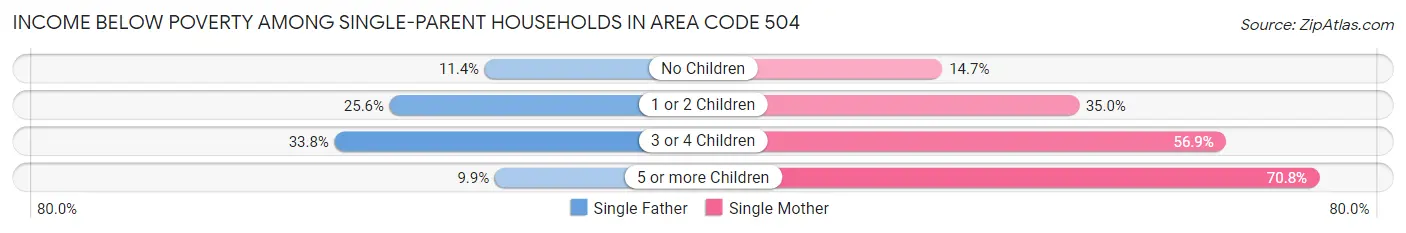
| Children | Single Father | Single Mother |
| No Children | 847 (11.4%) | 2,845 (14.7%) |
| 1 or 2 Children | 1,909 (25.6%) | 9,494 (35.0%) |
| 3 or 4 Children | 441 (33.8%) | 3,457 (56.9%) |
| 5 or more Children | 10 (9.9%) | 376 (70.8%) |
| Total | 3,207 (19.7%) | 16,172 (30.5%) |
Income Below Poverty Among Married-Couple vs Single-Parent Households in Area Code 504
The poverty data for Area Code 504 shows that 6,640 of the married-couple family households (5.4%) and 19,379 of the single-parent households (27.9%) are living below the poverty level. Within the married-couple family households, those with 5 or more children have the highest poverty rate, with 195 households (30.9%) falling below the poverty line. Among the single-parent households, those with 5 or more children have the highest poverty rate, with 386 household (61.1%) living below poverty.
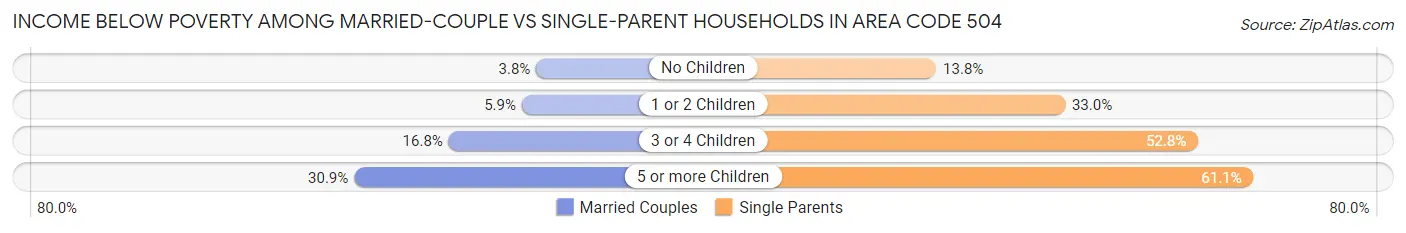
| Children | Married-Couple Families | Single-Parent Households |
| No Children | 2,840 (3.8%) | 3,692 (13.8%) |
| 1 or 2 Children | 2,300 (5.9%) | 11,403 (33.0%) |
| 3 or 4 Children | 1,305 (16.8%) | 3,898 (52.8%) |
| 5 or more Children | 195 (30.9%) | 386 (61.1%) |
| Total | 6,640 (5.4%) | 19,379 (27.9%) |
Race in Area Code 504
The most populous races in Area Code 504 are White / Caucasian (423,932 | 49.4%), Black / African American (316,468 | 36.9%), and Hispanic or Latino (90,949 | 10.6%).
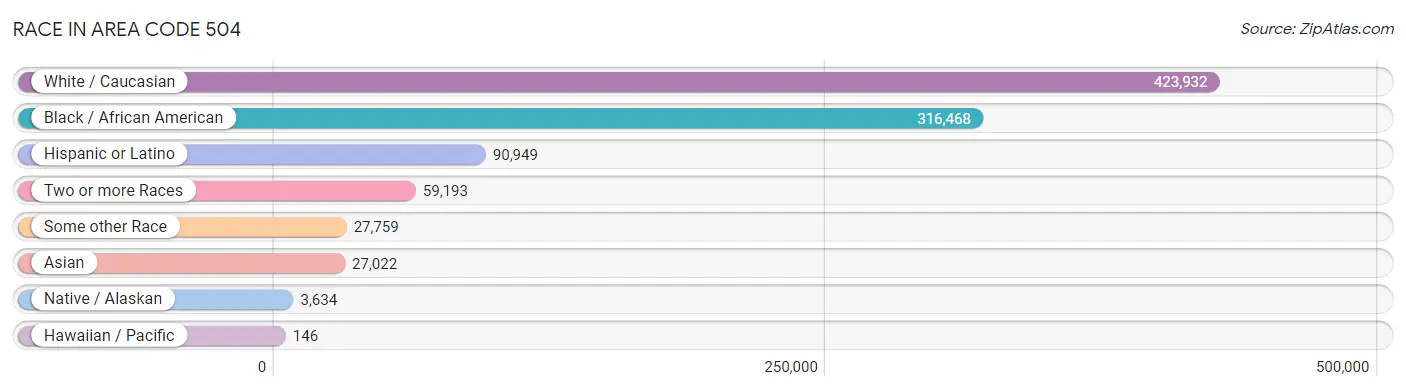
| Race | # Population | % Population |
| Asian | 27,022 | 3.2% |
| Black / African American | 316,468 | 36.9% |
| Hawaiian / Pacific | 146 | 0.0% |
| Hispanic or Latino | 90,949 | 10.6% |
| Native / Alaskan | 3,634 | 0.4% |
| White / Caucasian | 423,932 | 49.4% |
| Two or more Races | 59,193 | 6.9% |
| Some other Race | 27,759 | 3.2% |
| Total | 858,154 | 100.0% |
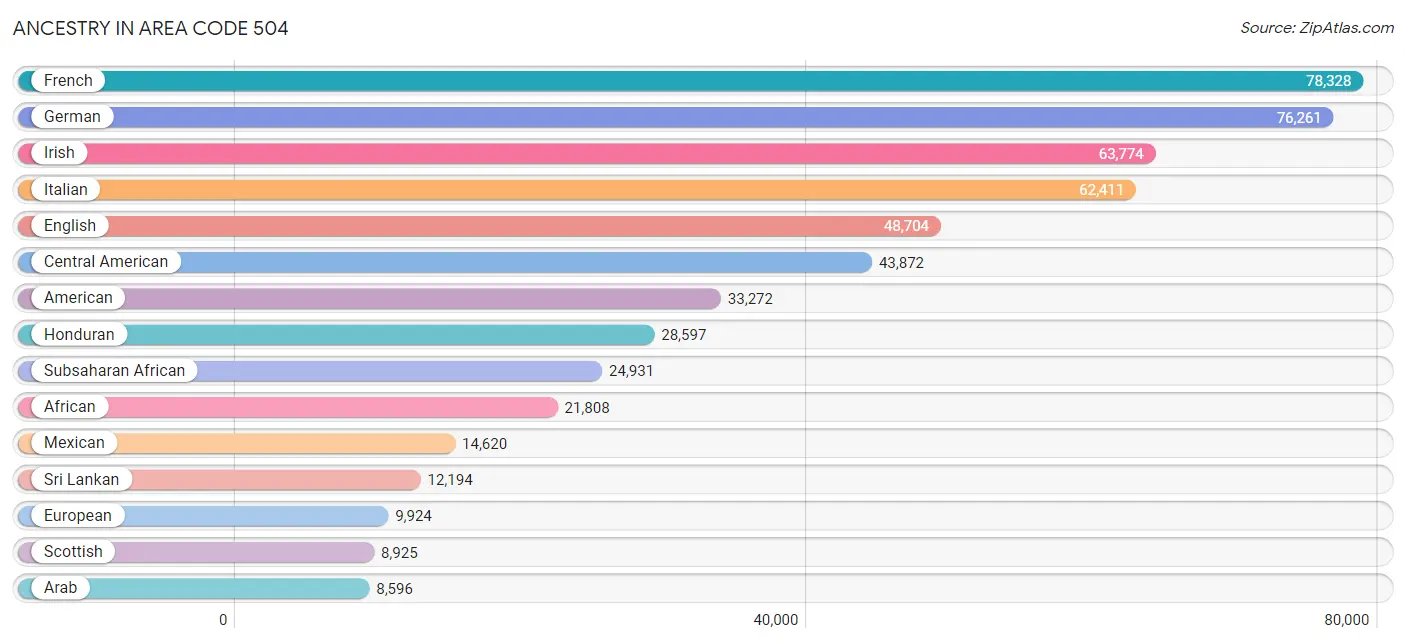
Ancestry in Area Code 504
The most populous ancestries reported in Area Code 504 are French (78,328 | 9.1%), German (76,261 | 8.9%), Irish (63,774 | 7.4%), Italian (62,411 | 7.3%), and English (48,704 | 5.7%), together accounting for 38.4% of all Area Code 504 residents.
| Ancestry | # Population | % Population |
| African | 21,808 | 2.5% |
| Alaska Native | 38 | 0.0% |
| Alaskan Athabascan | 21 | 0.0% |
| Albanian | 113 | 0.0% |
| Aleut | 16 | 0.0% |
| Alsatian | 56 | 0.0% |
| American | 33,272 | 3.9% |
| Apache | 140 | 0.0% |
| Arab | 8,596 | 1.0% |
| Arapaho | 4 | 0.0% |
| Argentinean | 276 | 0.0% |
| Armenian | 221 | 0.0% |
| Australian | 83 | 0.0% |
| Austrian | 843 | 0.1% |
| Bahamian | 109 | 0.0% |
| Barbadian | 192 | 0.0% |
| Basque | 192 | 0.0% |
| Belgian | 750 | 0.1% |
| Belizean | 611 | 0.1% |
| Bhutanese | 1,662 | 0.2% |
| Blackfeet | 294 | 0.0% |
| Bolivian | 339 | 0.0% |
| Brazilian | 1,038 | 0.1% |
| British | 3,886 | 0.4% |
| British West Indian | 129 | 0.0% |
| Bulgarian | 207 | 0.0% |
| Burmese | 1,236 | 0.1% |
| Cajun | 3,546 | 0.4% |
| Cambodian | 26 | 0.0% |
| Canadian | 739 | 0.1% |
| Cape Verdean | 25 | 0.0% |
| Carpatho Rusyn | 6 | 0.0% |
| Celtic | 47 | 0.0% |
| Central American | 43,872 | 5.1% |
| Central American Indian | 1,451 | 0.2% |
| Cherokee | 1,832 | 0.2% |
| Chickasaw | 101 | 0.0% |
| Chilean | 151 | 0.0% |
| Chippewa | 94 | 0.0% |
| Choctaw | 740 | 0.1% |
| Colombian | 1,234 | 0.1% |
| Comanche | 13 | 0.0% |
| Costa Rican | 630 | 0.1% |
| Cree | 36 | 0.0% |
| Creek | 234 | 0.0% |
| Croatian | 1,698 | 0.2% |
| Crow | 68 | 0.0% |
| Cuban | 6,688 | 0.8% |
| Cypriot | 8 | 0.0% |
| Czech | 778 | 0.1% |
| Czechoslovakian | 259 | 0.0% |
| Danish | 753 | 0.1% |
| Delaware | 85 | 0.0% |
| Dominican | 3,942 | 0.5% |
| Dutch | 3,258 | 0.4% |
| Eastern European | 1,682 | 0.2% |
| Ecuadorian | 844 | 0.1% |
| Egyptian | 1,317 | 0.2% |
| English | 48,704 | 5.7% |
| Estonian | 51 | 0.0% |
| Ethiopian | 885 | 0.1% |
| European | 9,924 | 1.2% |
| Fijian | 51 | 0.0% |
| Filipino | 308 | 0.0% |
| Finnish | 326 | 0.0% |
| French | 78,328 | 9.1% |
| French American Indian | 414 | 0.1% |
| French Canadian | 6,608 | 0.8% |
| German | 76,261 | 8.9% |
| German Russian | 9 | 0.0% |
| Ghanaian | 105 | 0.0% |
| Greek | 2,391 | 0.3% |
| Guamanian / Chamorro | 35 | 0.0% |
| Guatemalan | 4,297 | 0.5% |
| Guyanese | 63 | 0.0% |
| Haitian | 1,945 | 0.2% |
| Honduran | 28,597 | 3.3% |
| Hopi | 11 | 0.0% |
| Houma | 492 | 0.1% |
| Hungarian | 1,186 | 0.1% |
| Icelander | 52 | 0.0% |
| Indian (Asian) | 6,556 | 0.8% |
| Indonesian | 248 | 0.0% |
| Inupiat | 1 | 0.0% |
| Iranian | 718 | 0.1% |
| Iraqi | 121 | 0.0% |
| Irish | 63,774 | 7.4% |
| Iroquois | 73 | 0.0% |
| Israeli | 396 | 0.1% |
| Italian | 62,411 | 7.3% |
| Jamaican | 1,097 | 0.1% |
| Japanese | 615 | 0.1% |
| Jordanian | 1,187 | 0.1% |
| Kenyan | 160 | 0.0% |
| Korean | 4,615 | 0.5% |
| Laotian | 265 | 0.0% |
| Latvian | 135 | 0.0% |
| Lebanese | 1,456 | 0.2% |
| Lithuanian | 849 | 0.1% |
| Luxembourger | 8 | 0.0% |
| Macedonian | 20 | 0.0% |
| Malaysian | 200 | 0.0% |
| Maltese | 7 | 0.0% |
| Mexican | 14,620 | 1.7% |
| Mexican American Indian | 262 | 0.0% |
| Mongolian | 55 | 0.0% |
| Moroccan | 102 | 0.0% |
| Native Hawaiian | 265 | 0.0% |
| Navajo | 149 | 0.0% |
| New Zealander | 4 | 0.0% |
| Nicaraguan | 5,085 | 0.6% |
| Nigerian | 845 | 0.1% |
| Northern European | 620 | 0.1% |
| Norwegian | 2,391 | 0.3% |
| Osage | 9 | 0.0% |
| Paiute | 3 | 0.0% |
| Pakistani | 553 | 0.1% |
| Palestinian | 1,816 | 0.2% |
| Panamanian | 415 | 0.1% |
| Paraguayan | 53 | 0.0% |
| Pennsylvania German | 86 | 0.0% |
| Peruvian | 756 | 0.1% |
| Polish | 6,300 | 0.7% |
| Portuguese | 1,218 | 0.1% |
| Potawatomi | 18 | 0.0% |
| Pueblo | 73 | 0.0% |
| Puerto Rican | 4,371 | 0.5% |
| Romanian | 772 | 0.1% |
| Russian | 3,090 | 0.4% |
| Salvadoran | 3,226 | 0.4% |
| Samoan | 28 | 0.0% |
| Scandinavian | 1,317 | 0.2% |
| Scotch-Irish | 4,775 | 0.6% |
| Scottish | 8,925 | 1.0% |
| Seminole | 70 | 0.0% |
| Senegalese | 136 | 0.0% |
| Serbian | 165 | 0.0% |
| Sioux | 212 | 0.0% |
| Slavic | 222 | 0.0% |
| Slovak | 287 | 0.0% |
| Slovene | 361 | 0.0% |
| Somali | 77 | 0.0% |
| South African | 67 | 0.0% |
| South American | 4,376 | 0.5% |
| South American Indian | 93 | 0.0% |
| Spaniard | 3,418 | 0.4% |
| Spanish | 4,560 | 0.5% |
| Spanish American | 26 | 0.0% |
| Spanish American Indian | 64 | 0.0% |
| Sri Lankan | 12,194 | 1.4% |
| Subsaharan African | 24,931 | 2.9% |
| Sudanese | 31 | 0.0% |
| Swedish | 2,705 | 0.3% |
| Swiss | 670 | 0.1% |
| Syrian | 537 | 0.1% |
| Thai | 3,505 | 0.4% |
| Trinidadian and Tobagonian | 342 | 0.0% |
| Tsimshian | 12 | 0.0% |
| Turkish | 317 | 0.0% |
| U.S. Virgin Islander | 24 | 0.0% |
| Ugandan | 221 | 0.0% |
| Ukrainian | 743 | 0.1% |
| Uruguayan | 94 | 0.0% |
| Venezuelan | 538 | 0.1% |
| Vietnamese | 158 | 0.0% |
| Welsh | 2,607 | 0.3% |
| West Indian | 1,247 | 0.2% |
| Yaqui | 24 | 0.0% |
| Yugoslavian | 311 | 0.0% |
| Zimbabwean | 50 | 0.0% | View All 170 Rows |
Immigrants in Area Code 504
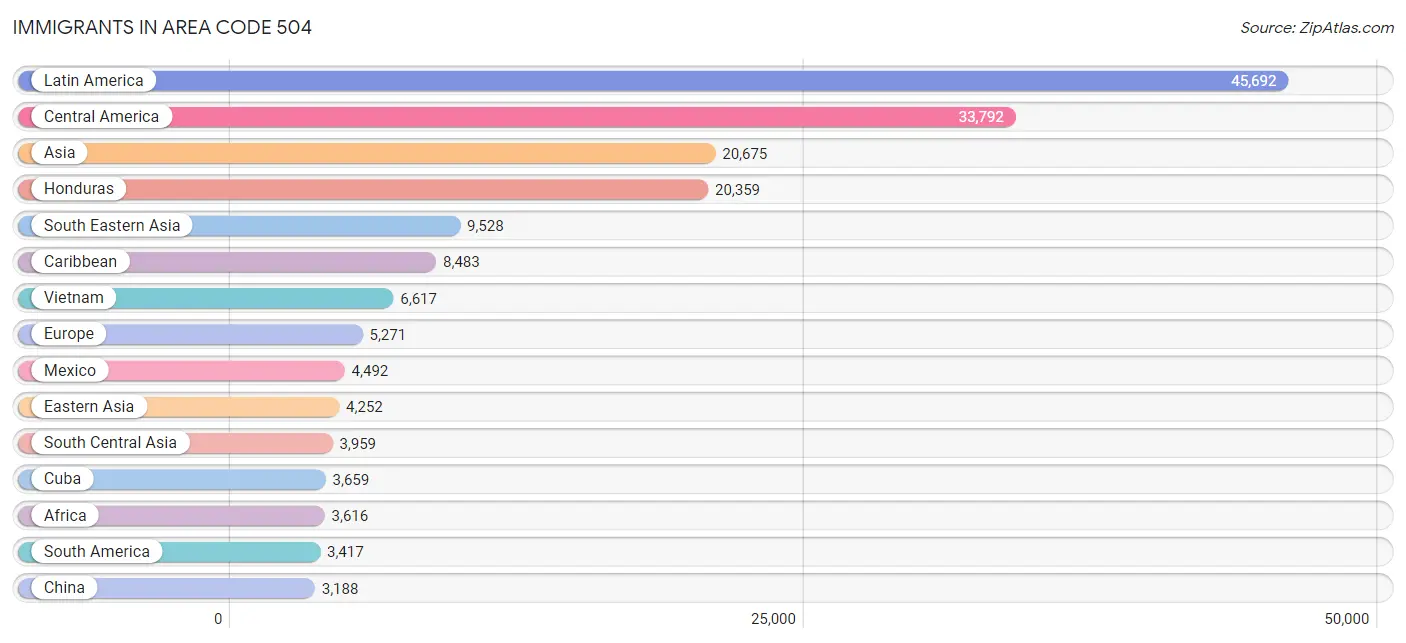
The most numerous immigrant groups reported in Area Code 504 came from Latin America (45,692 | 5.3%), Central America (33,792 | 3.9%), Asia (20,675 | 2.4%), Honduras (20,359 | 2.4%), and South Eastern Asia (9,528 | 1.1%), together accounting for 15.1% of all Area Code 504 residents.
| Immigration Origin | # Population | % Population |
| Africa | 3,616 | 0.4% |
| Albania | 68 | 0.0% |
| Argentina | 124 | 0.0% |
| Asia | 20,675 | 2.4% |
| Australia | 54 | 0.0% |
| Austria | 27 | 0.0% |
| Bahamas | 28 | 0.0% |
| Bangladesh | 154 | 0.0% |
| Barbados | 95 | 0.0% |
| Belarus | 24 | 0.0% |
| Belgium | 45 | 0.0% |
| Belize | 441 | 0.1% |
| Bolivia | 101 | 0.0% |
| Bosnia and Herzegovina | 155 | 0.0% |
| Brazil | 1,102 | 0.1% |
| Bulgaria | 200 | 0.0% |
| Cambodia | 233 | 0.0% |
| Cameroon | 68 | 0.0% |
| Canada | 949 | 0.1% |
| Caribbean | 8,483 | 1.0% |
| Central America | 33,792 | 3.9% |
| Chile | 32 | 0.0% |
| China | 3,188 | 0.4% |
| Colombia | 663 | 0.1% |
| Congo | 19 | 0.0% |
| Costa Rica | 281 | 0.0% |
| Croatia | 83 | 0.0% |
| Cuba | 3,659 | 0.4% |
| Czechoslovakia | 67 | 0.0% |
| Denmark | 6 | 0.0% |
| Dominica | 134 | 0.0% |
| Dominican Republic | 2,255 | 0.3% |
| Eastern Africa | 902 | 0.1% |
| Eastern Asia | 4,252 | 0.5% |
| Eastern Europe | 1,865 | 0.2% |
| Ecuador | 455 | 0.1% |
| Egypt | 1,033 | 0.1% |
| El Salvador | 1,662 | 0.2% |
| England | 381 | 0.0% |
| Eritrea | 29 | 0.0% |
| Ethiopia | 522 | 0.1% |
| Europe | 5,271 | 0.6% |
| France | 458 | 0.1% |
| Germany | 571 | 0.1% |
| Ghana | 11 | 0.0% |
| Greece | 245 | 0.0% |
| Guatemala | 2,828 | 0.3% |
| Guyana | 56 | 0.0% |
| Haiti | 1,179 | 0.1% |
| Honduras | 20,359 | 2.4% |
| Hong Kong | 99 | 0.0% |
| Hungary | 70 | 0.0% |
| India | 1,530 | 0.2% |
| Indonesia | 147 | 0.0% |
| Iran | 534 | 0.1% |
| Iraq | 177 | 0.0% |
| Ireland | 76 | 0.0% |
| Israel | 398 | 0.1% |
| Italy | 432 | 0.1% |
| Jamaica | 683 | 0.1% |
| Japan | 380 | 0.0% |
| Jordan | 635 | 0.1% |
| Kazakhstan | 25 | 0.0% |
| Kenya | 67 | 0.0% |
| Korea | 678 | 0.1% |
| Kuwait | 285 | 0.0% |
| Laos | 196 | 0.0% |
| Latin America | 45,692 | 5.3% |
| Latvia | 17 | 0.0% |
| Lebanon | 292 | 0.0% |
| Lithuania | 20 | 0.0% |
| Malaysia | 64 | 0.0% |
| Mexico | 4,492 | 0.5% |
| Middle Africa | 109 | 0.0% |
| Moldova | 267 | 0.0% |
| Morocco | 76 | 0.0% |
| Nepal | 289 | 0.0% |
| Netherlands | 330 | 0.0% |
| Nicaragua | 2,689 | 0.3% |
| Nigeria | 576 | 0.1% |
| Northern Africa | 1,499 | 0.2% |
| Northern Europe | 1,051 | 0.1% |
| Norway | 70 | 0.0% |
| Oceania | 63 | 0.0% |
| Pakistan | 1,328 | 0.2% |
| Panama | 258 | 0.0% |
| Peru | 528 | 0.1% |
| Philippines | 1,619 | 0.2% |
| Poland | 127 | 0.0% |
| Portugal | 10 | 0.0% |
| Romania | 137 | 0.0% |
| Russia | 390 | 0.1% |
| Saudi Arabia | 56 | 0.0% |
| Scotland | 31 | 0.0% |
| Senegal | 66 | 0.0% |
| Singapore | 19 | 0.0% |
| Somalia | 9 | 0.0% |
| South Africa | 41 | 0.0% |
| South America | 3,417 | 0.4% |
| South Central Asia | 3,959 | 0.5% |
| South Eastern Asia | 9,528 | 1.1% |
| Southern Europe | 887 | 0.1% |
| Spain | 200 | 0.0% |
| Sri Lanka | 64 | 0.0% |
| St. Vincent and the Grenadines | 7 | 0.0% |
| Sudan | 12 | 0.0% |
| Sweden | 35 | 0.0% |
| Switzerland | 22 | 0.0% |
| Syria | 308 | 0.0% |
| Taiwan | 415 | 0.1% |
| Thailand | 327 | 0.0% |
| Trinidad and Tobago | 296 | 0.0% |
| Turkey | 239 | 0.0% |
| Uganda | 63 | 0.0% |
| Ukraine | 209 | 0.0% |
| Uruguay | 56 | 0.0% |
| Venezuela | 222 | 0.0% |
| Vietnam | 6,617 | 0.8% |
| West Indies | 23 | 0.0% |
| Western Africa | 979 | 0.1% |
| Western Asia | 2,461 | 0.3% |
| Western Europe | 1,455 | 0.2% |
| Zaire | 3 | 0.0% |
| Zimbabwe | 50 | 0.0% | View All 124 Rows |
Sex and Age in Area Code 504
Sex and Age in Area Code 504
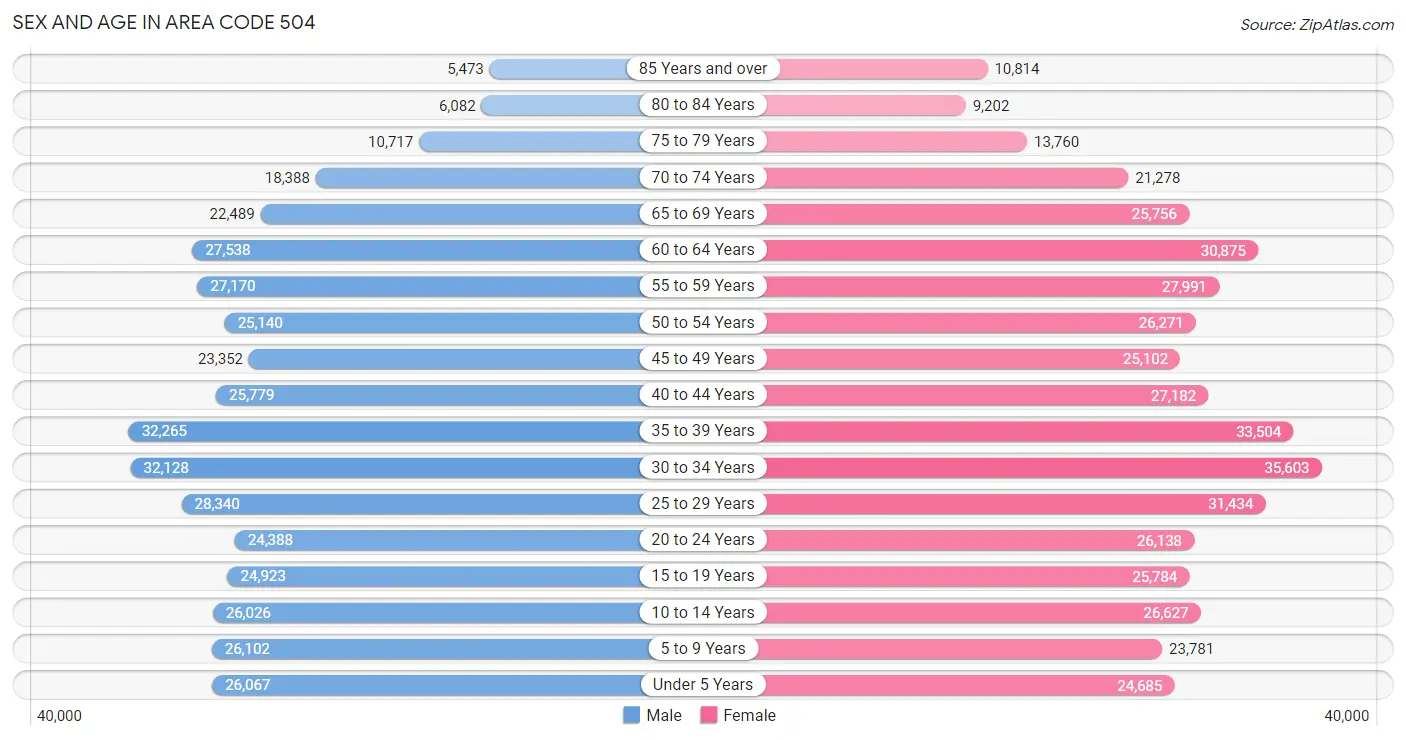
The most populous age groups in Area Code 504 are 35 to 39 Years (32,265 | 7.8%) for men and 30 to 34 Years (35,603 | 8.0%) for women.
| Age Bracket | Male | Female |
| Under 5 Years | 26,067 (6.3%) | 24,685 (5.5%) |
| 5 to 9 Years | 26,102 (6.3%) | 23,781 (5.3%) |
| 10 to 14 Years | 26,026 (6.3%) | 26,627 (6.0%) |
| 15 to 19 Years | 24,923 (6.0%) | 25,784 (5.8%) |
| 20 to 24 Years | 24,388 (5.9%) | 26,138 (5.9%) |
| 25 to 29 Years | 28,340 (6.9%) | 31,434 (7.0%) |
| 30 to 34 Years | 32,128 (7.8%) | 35,603 (8.0%) |
| 35 to 39 Years | 32,265 (7.8%) | 33,504 (7.5%) |
| 40 to 44 Years | 25,779 (6.2%) | 27,182 (6.1%) |
| 45 to 49 Years | 23,352 (5.7%) | 25,102 (5.6%) |
| 50 to 54 Years | 25,140 (6.1%) | 26,271 (5.9%) |
| 55 to 59 Years | 27,170 (6.6%) | 27,991 (6.3%) |
| 60 to 64 Years | 27,538 (6.7%) | 30,875 (6.9%) |
| 65 to 69 Years | 22,489 (5.4%) | 25,756 (5.8%) |
| 70 to 74 Years | 18,388 (4.5%) | 21,278 (4.8%) |
| 75 to 79 Years | 10,717 (2.6%) | 13,760 (3.1%) |
| 80 to 84 Years | 6,082 (1.5%) | 9,202 (2.1%) |
| 85 Years and over | 5,473 (1.3%) | 10,814 (2.4%) |
| Total | 412,367 (100.0%) | 445,787 (100.0%) |
Families and Households in Area Code 504
Median Family Size in Area Code 504
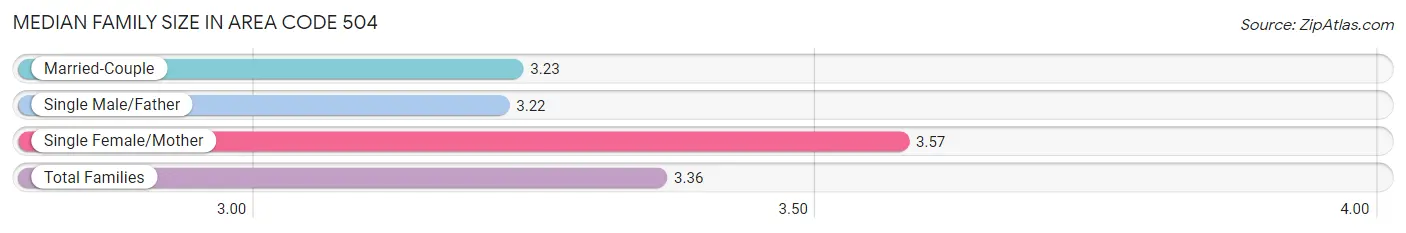
The median family size in Area Code 504 is 3.36 persons per family, with single female/mother families (53,081 | 27.7%) accounting for the largest median family size of 3.57395 persons per family. On the other hand, single male/father families (16,301 | 8.5%) represent the smallest median family size with 3.22 persons per family.
| Family Type | # Families | Family Size |
| Married-Couple | 122,551 (63.8%) | 3.23 |
| Single Male/Father | 16,301 (8.5%) | 3.22 |
| Single Female/Mother | 53,081 (27.7%) | 3.57 |
| Total Families | 191,933 (100.0%) | 3.36 |
Median Household Size in Area Code 504
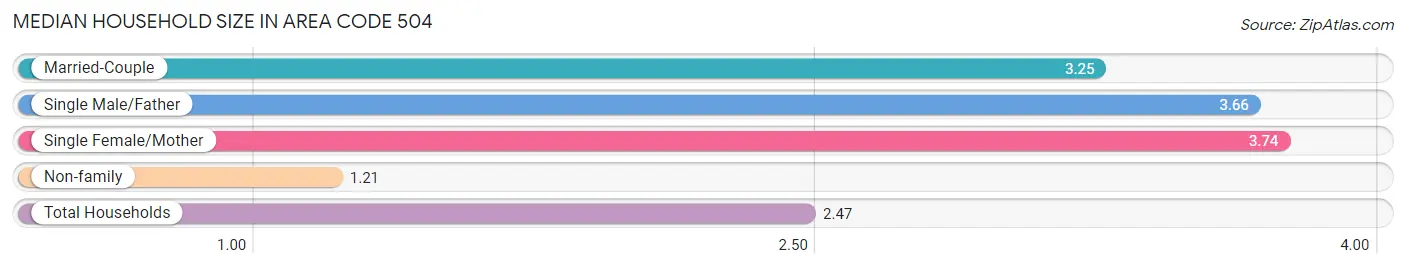
The median household size in Area Code 504 is 2.47 persons per household, with single female/mother households (53,081 | 15.3%) accounting for the largest median household size of 3.74116 persons per household. non-family households (154,878 | 44.7%) represent the smallest median household size with 1.21 persons per household.
| Household Type | # Households | Household Size |
| Married-Couple | 122,551 (35.3%) | 3.25 |
| Single Male/Father | 16,301 (4.7%) | 3.66 |
| Single Female/Mother | 53,081 (15.3%) | 3.74 |
| Non-family | 154,878 (44.7%) | 1.21 |
| Total Households | 346,811 (100.0%) | 2.47 |
Household Size by Marriage Status in Area Code 504
Out of a total of 346,811 households in Area Code 504, 191,933 (55.3%) are family households, while 154,878 (44.7%) are nonfamily households. The most numerous type of family households are 2-person households, comprising 86,821, and the most common type of nonfamily households are 1-person households, comprising 132,799.
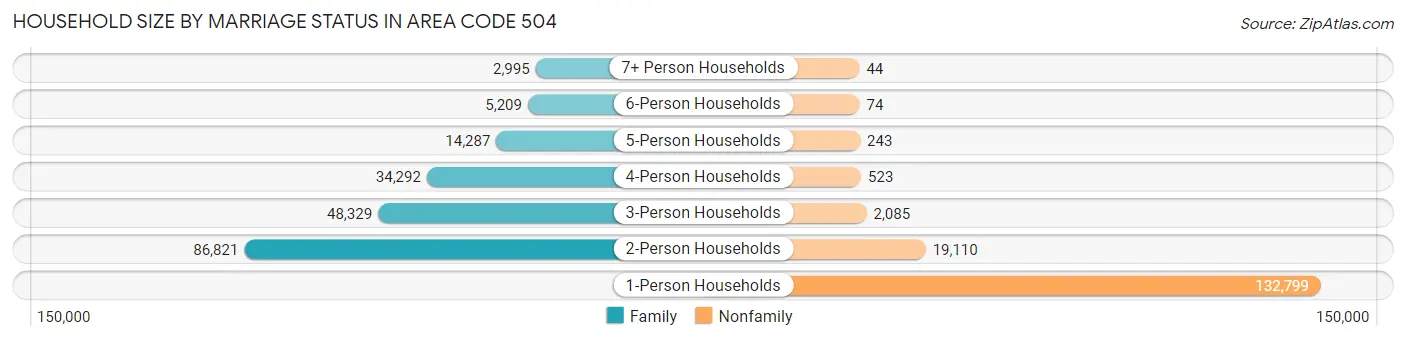
| Household Size | Family Households | Nonfamily Households |
| 1-Person Households | - | 132,799 (38.3%) |
| 2-Person Households | 86,821 (25.0%) | 19,110 (5.5%) |
| 3-Person Households | 48,329 (13.9%) | 2,085 (0.6%) |
| 4-Person Households | 34,292 (9.9%) | 523 (0.2%) |
| 5-Person Households | 14,287 (4.1%) | 243 (0.1%) |
| 6-Person Households | 5,209 (1.5%) | 74 (0.0%) |
| 7+ Person Households | 2,995 (0.9%) | 44 (0.0%) |
| Total | 191,933 (55.3%) | 154,878 (44.7%) |
Female Fertility in Area Code 504
Fertility by Age in Area Code 504
Average fertility rate in Area Code 504 is 50.0 births per 1,000 women. Women in the age bracket of 20 to 34 years have the highest fertility rate with 83.2 births per 1,000 women. Women in the age bracket of 20 to 34 years acount for 69.0% of all women with births.
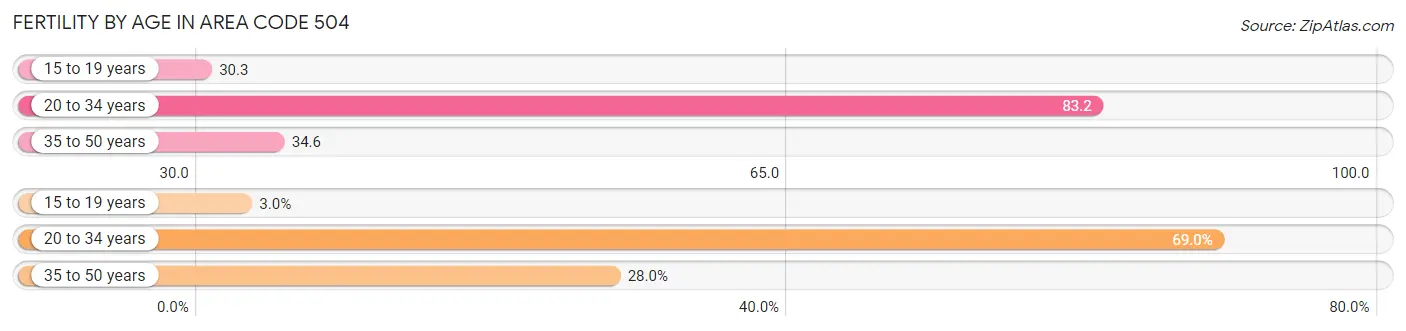
| Age Bracket | Women with Births | Births / 1,000 Women |
| 15 to 19 years | 326 (3.0%) | 30.2 |
| 20 to 34 years | 7,476 (69.0%) | 83.2 |
| 35 to 50 years | 3,035 (28.0%) | 34.6 |
| Total | 10,837 (100.0%) | 50.0 |
Fertility by Age by Marriage Status in Area Code 504
45.1% of women with births (10,837) in Area Code 504 are married. The highest percentage of unmarried women with births falls into 15 to 19 years age bracket with 100.0% of them unmarried at the time of birth, while the lowest percentage of unmarried women with births belong to 35 to 50 years age bracket with 46.7% of them unmarried.
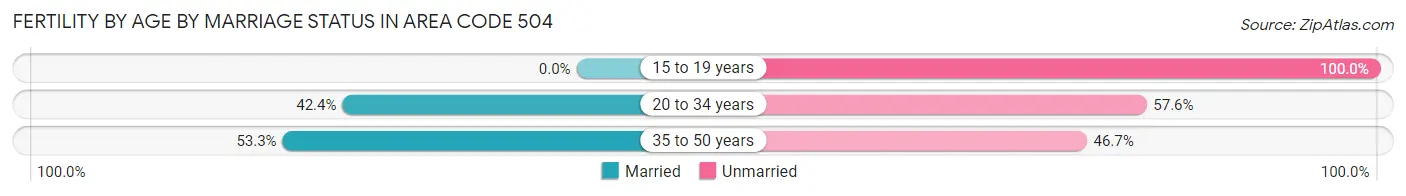
| Age Bracket | Married | Unmarried |
| 15 to 19 years | 0 (0.0%) | 326 (100.0%) |
| 20 to 34 years | 3,173 (42.4%) | 4,303 (57.6%) |
| 35 to 50 years | 1,617 (53.3%) | 1,418 (46.7%) |
| Total | 4,892 (45.1%) | 5,945 (54.9%) |
Fertility by Education in Area Code 504
Average fertility rate in Area Code 504 is 50.0 births per 1,000 women. Women with the education attainment of graduate degree have the highest fertility rate of 83.5 births per 1,000 women, while women with the education attainment of less than high school have the lowest fertility at 53.8 births per 1,000 women. Women with the education attainment of college or associate's degree represent 29.3% of all women with births.
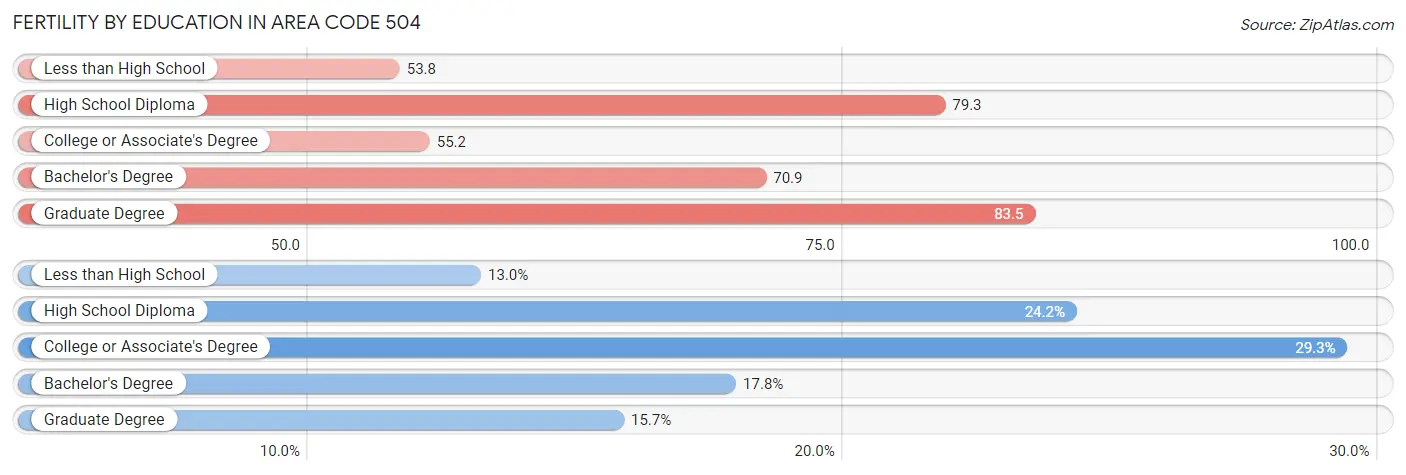
| Educational Attainment | Women with Births | Births / 1,000 Women |
| Less than High School | 1,412 (13.0%) | 53.8 |
| High School Diploma | 2,622 (24.2%) | 79.3 |
| College or Associate's Degree | 3,171 (29.3%) | 55.2 |
| Bachelor's Degree | 1,930 (17.8%) | 70.9 |
| Graduate Degree | 1,702 (15.7%) | 83.5 |
| Total | 10,837 (100.0%) | 50.0 |
Fertility by Education by Marriage Status in Area Code 504
54.9% of women with births in Area Code 504 are unmarried. Women with the educational attainment of graduate degree are most likely to be married with 69.0% of them married at childbirth, while women with the educational attainment of less than high school are least likely to be married with 73.0% of them unmarried at childbirth.
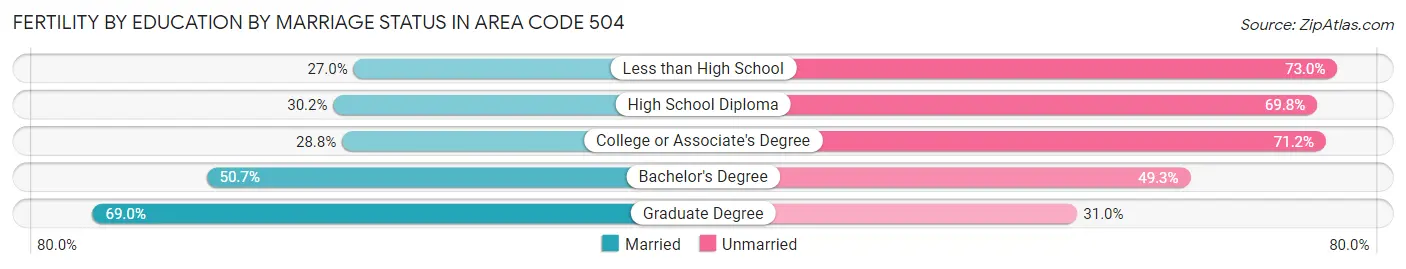
| Educational Attainment | Married | Unmarried |
| Less than High School | 381 (27.0%) | 1,031 (73.0%) |
| High School Diploma | 793 (30.2%) | 1,829 (69.8%) |
| College or Associate's Degree | 914 (28.8%) | 2,257 (71.2%) |
| Bachelor's Degree | 978 (50.7%) | 952 (49.3%) |
| Graduate Degree | 1,175 (69.0%) | 527 (31.0%) |
| Total | 4,892 (45.1%) | 5,945 (54.9%) |
Employment Characteristics in Area Code 504
Employment by Class of Employer in Area Code 504
Among the 394,360 employed individuals in Area Code 504, private company employees (251,595 | 63.8%), not-for-profit organizations (40,352 | 10.2%), and self-employed (not incorporated) (26,995 | 6.9%) make up the most common classes of employment.
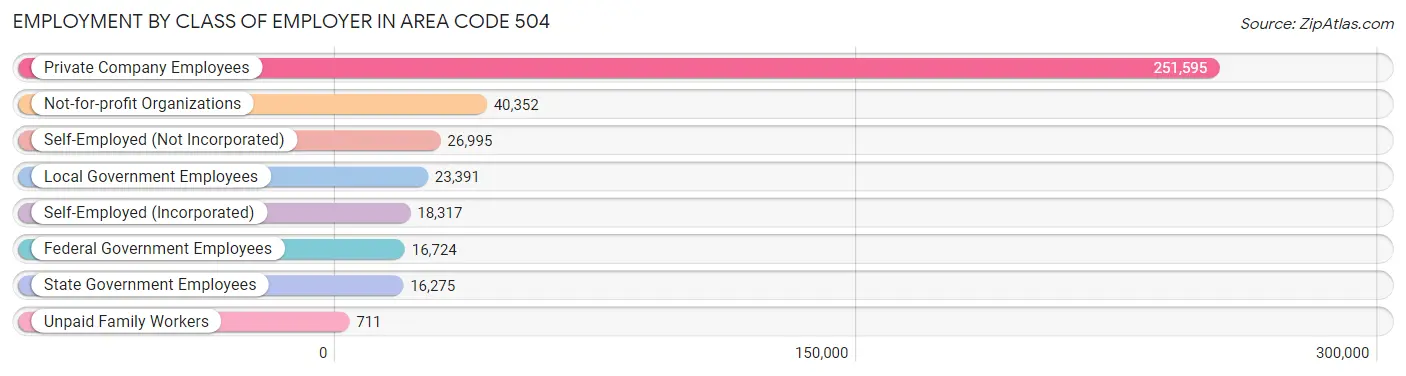
| Employer Class | # Employees | % Employees |
| Private Company Employees | 251,595 | 63.8% |
| Self-Employed (Incorporated) | 18,317 | 4.6% |
| Self-Employed (Not Incorporated) | 26,995 | 6.9% |
| Not-for-profit Organizations | 40,352 | 10.2% |
| Local Government Employees | 23,391 | 5.9% |
| State Government Employees | 16,275 | 4.1% |
| Federal Government Employees | 16,724 | 4.2% |
| Unpaid Family Workers | 711 | 0.2% |
| Total | 394,360 | 100.0% |
Employment Status by Age in Area Code 504
According to the labor force statistics for Area Code 504, out of the total population over 16 years of age (695,024), 60.7% or 421,810 individuals are in the labor force, with 7.6% or 31,889 of them unemployed. The age group with the highest labor force participation rate is 30 to 34 years, with 83.6% or 56,650 individuals in the labor force. Within the labor force, the 16 to 19 years age range has the highest percentage of unemployed individuals, with 784.6% or 102,539 of them being unemployed.
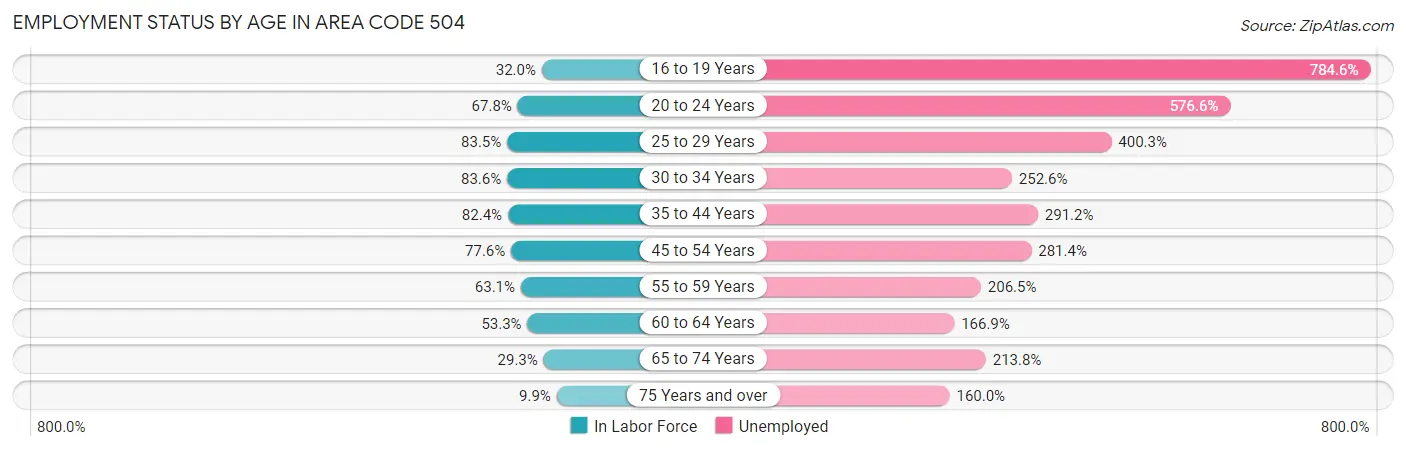
| Age Bracket | In Labor Force | Unemployed |
| 16 to 19 Years | 13,069 (32.0%) | 102,539 (784.6%) |
| 20 to 24 Years | 34,278 (67.8%) | 197,641 (576.6%) |
| 25 to 29 Years | 49,896 (83.5%) | 199,746 (400.3%) |
| 30 to 34 Years | 56,652 (83.6%) | 143,098 (252.6%) |
| 35 to 44 Years | 97,782 (82.4%) | 284,753 (291.2%) |
| 45 to 54 Years | 77,488 (77.6%) | 218,043 (281.4%) |
| 55 to 59 Years | 34,790 (63.1%) | 71,841 (206.5%) |
| 60 to 64 Years | 31,122 (53.3%) | 51,943 (166.9%) |
| 65 to 74 Years | 25,747 (29.3%) | 55,051 (213.8%) |
| 75 Years and over | 5,535 (9.9%) | 8,861 (160.0%) |
| Total | 421,816 (60.7%) | 31,887 (7.6%) |
Employment Status by Educational Attainment in Area Code 504
According to labor force statistics for Area Code 504, 75.8% of individuals (348,249) out of the total population between 25 and 64 years of age (459,674) are in the labor force, with 282.3% or 983,107 of them being unemployed. The group with the highest labor force participation rate are those with the educational attainment of bachelor's degree or higher, with 86.8% or 145,507 individuals in the labor force. Within the labor force, individuals with less than high school education have the highest percentage of unemployment, with 579.1% or 164,424 of them being unemployed.
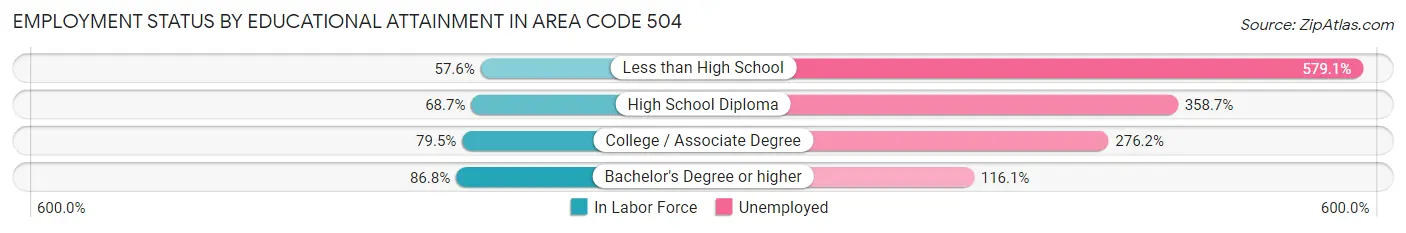
| Educational Attainment | In Labor Force | Unemployed |
| Less than High School | 28,393 (57.6%) | 285,554 (579.1%) |
| High School Diploma | 74,071 (68.7%) | 386,926 (358.7%) |
| College / Associate Degree | 107,210 (79.5%) | 372,536 (276.2%) |
| Bachelor's Degree or higher | 145,502 (86.8%) | 194,602 (116.1%) |
| Total | 348,266 (75.8%) | 1,297,660 (282.3%) |
Employment Occupations by Sex in Area Code 504
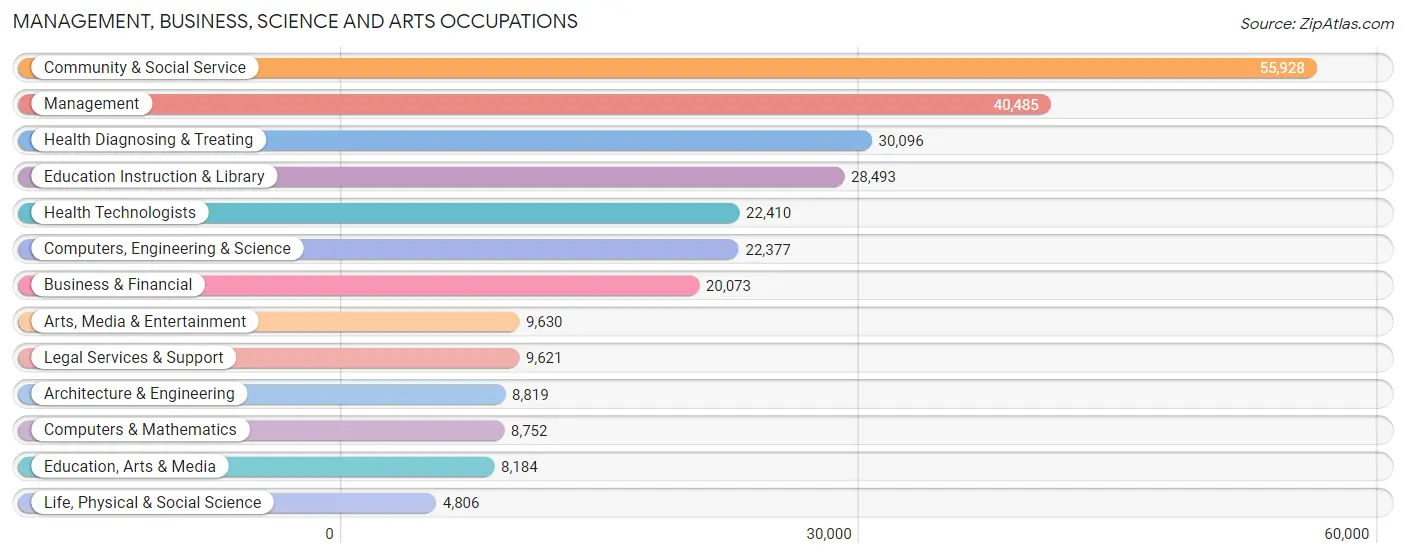
Management, Business, Science and Arts Occupations
The most common Management, Business, Science and Arts occupations in Area Code 504 are Community & Social Service (55,928 | 13.9%), Management (40,485 | 10.1%), Health Diagnosing & Treating (30,096 | 7.5%), Education Instruction & Library (28,493 | 7.1%), and Health Technologists (22,410 | 5.6%).
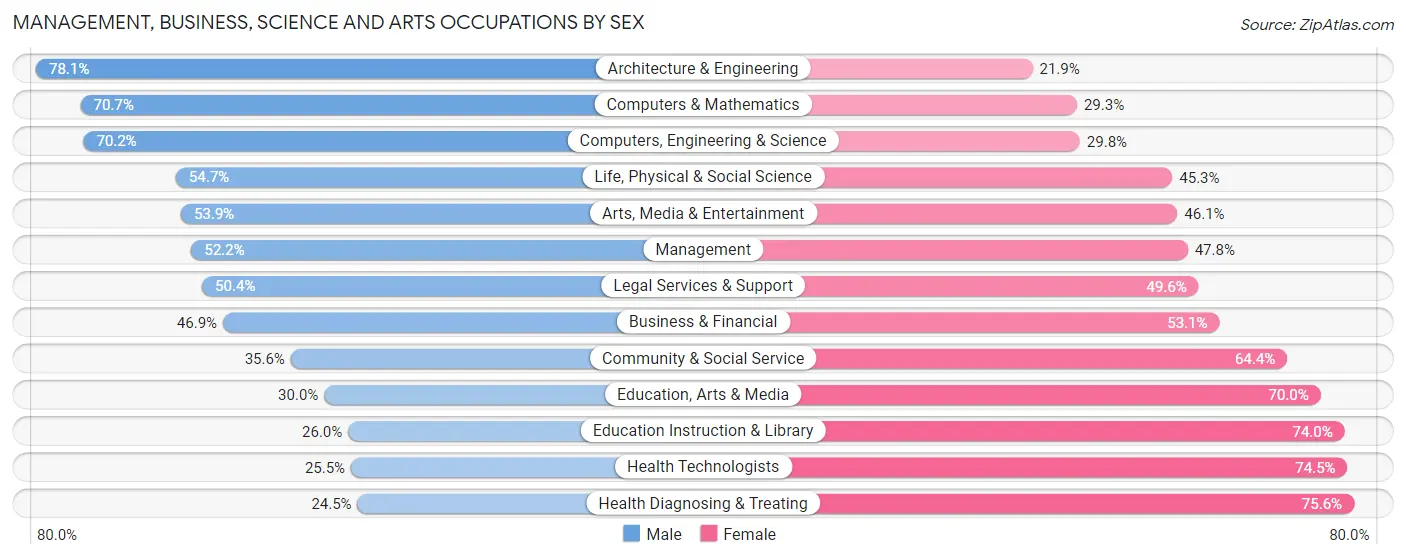
Management, Business, Science and Arts Occupations by Sex
Within the Management, Business, Science and Arts occupations in Area Code 504, the most male-oriented occupations are Architecture & Engineering (78.1%), Computers & Mathematics (70.7%), and Computers, Engineering & Science (70.2%), while the most female-oriented occupations are Health Diagnosing & Treating (75.5%), Health Technologists (74.5%), and Education Instruction & Library (74.0%).
| Occupation | Male | Female |
| Management | 21,126 (52.2%) | 19,359 (47.8%) |
| Business & Financial | 9,416 (46.9%) | 10,657 (53.1%) |
| Computers, Engineering & Science | 15,701 (70.2%) | 6,676 (29.8%) |
| Computers & Mathematics | 6,184 (70.7%) | 2,568 (29.3%) |
| Architecture & Engineering | 6,886 (78.1%) | 1,933 (21.9%) |
| Life, Physical & Social Science | 2,631 (54.7%) | 2,175 (45.3%) |
| Community & Social Service | 19,903 (35.6%) | 36,025 (64.4%) |
| Education, Arts & Media | 2,456 (30.0%) | 5,728 (70.0%) |
| Legal Services & Support | 4,845 (50.4%) | 4,776 (49.6%) |
| Education Instruction & Library | 7,411 (26.0%) | 21,082 (74.0%) |
| Arts, Media & Entertainment | 5,191 (53.9%) | 4,439 (46.1%) |
| Health Diagnosing & Treating | 7,357 (24.4%) | 22,739 (75.5%) |
| Health Technologists | 5,723 (25.5%) | 16,687 (74.5%) |
| Total (Category) | 73,503 (43.5%) | 95,456 (56.5%) |
| Total (Overall) | 199,297 (49.7%) | 201,995 (50.3%) |
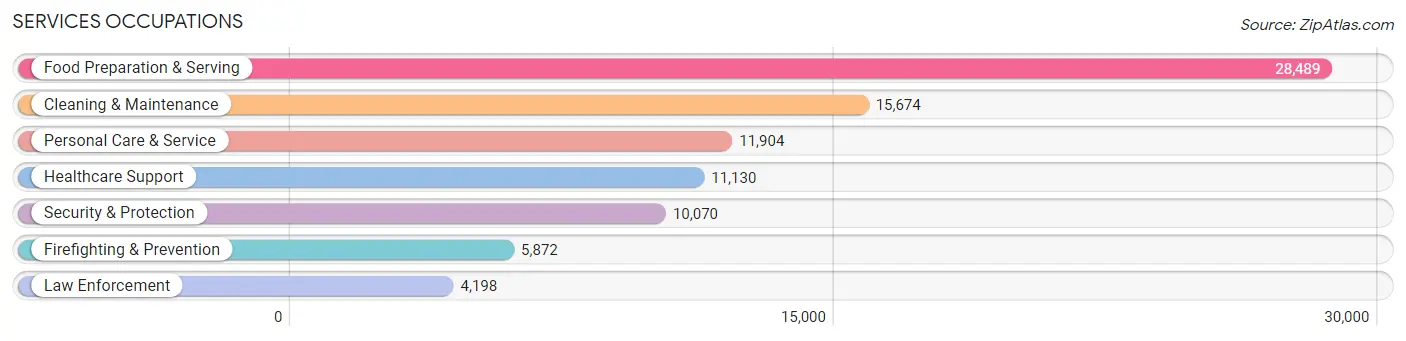
Services Occupations
The most common Services occupations in Area Code 504 are Food Preparation & Serving (28,489 | 7.1%), Cleaning & Maintenance (15,674 | 3.9%), Personal Care & Service (11,904 | 3.0%), Healthcare Support (11,130 | 2.8%), and Security & Protection (10,070 | 2.5%).
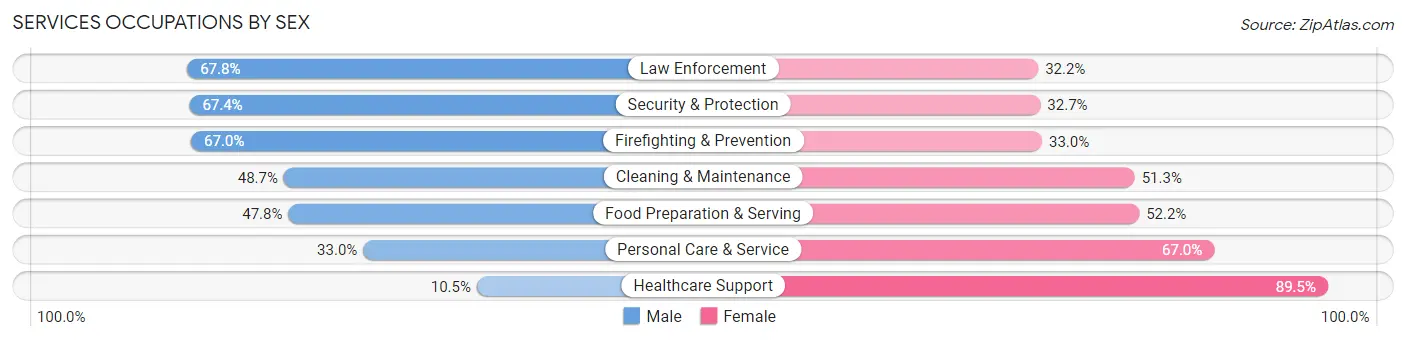
Services Occupations by Sex
Within the Services occupations in Area Code 504, the most male-oriented occupations are Law Enforcement (67.8%), Security & Protection (67.3%), and Firefighting & Prevention (67.0%), while the most female-oriented occupations are Healthcare Support (89.5%), Personal Care & Service (67.0%), and Food Preparation & Serving (52.2%).
| Occupation | Male | Female |
| Healthcare Support | 1,164 (10.5%) | 9,966 (89.5%) |
| Security & Protection | 6,782 (67.3%) | 3,288 (32.7%) |
| Firefighting & Prevention | 3,936 (67.0%) | 1,936 (33.0%) |
| Law Enforcement | 2,846 (67.8%) | 1,352 (32.2%) |
| Food Preparation & Serving | 13,614 (47.8%) | 14,875 (52.2%) |
| Cleaning & Maintenance | 7,630 (48.7%) | 8,044 (51.3%) |
| Personal Care & Service | 3,923 (33.0%) | 7,981 (67.0%) |
| Total (Category) | 33,113 (42.9%) | 44,154 (57.1%) |
| Total (Overall) | 199,297 (49.7%) | 201,995 (50.3%) |
Sales and Office Occupations
The most common Sales and Office occupations in Area Code 504 are Office & Administration (40,100 | 10.0%), and Sales & Related (40,050 | 10.0%).
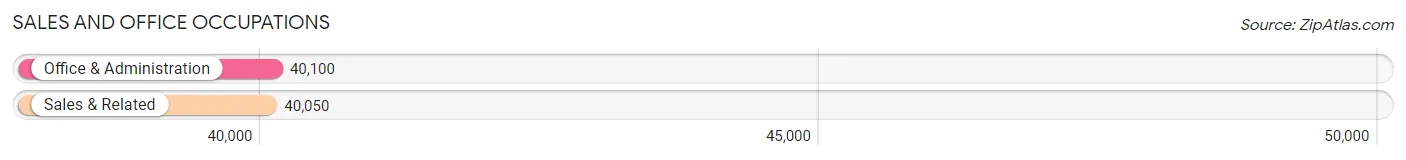
Sales and Office Occupations by Sex
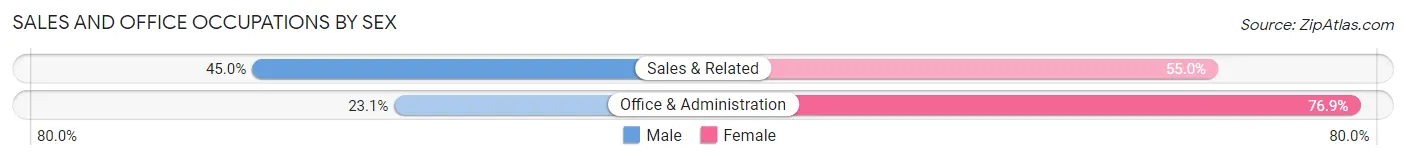
| Occupation | Male | Female |
| Sales & Related | 18,029 (45.0%) | 22,021 (55.0%) |
| Office & Administration | 9,280 (23.1%) | 30,820 (76.9%) |
| Total (Category) | 27,309 (34.1%) | 52,841 (65.9%) |
| Total (Overall) | 199,297 (49.7%) | 201,995 (50.3%) |
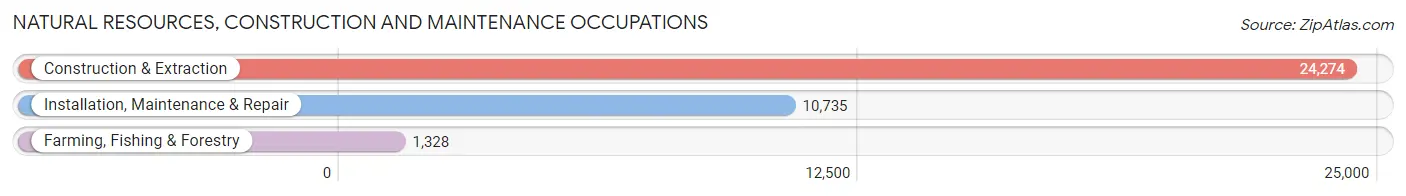
Natural Resources, Construction and Maintenance Occupations
The most common Natural Resources, Construction and Maintenance occupations in Area Code 504 are Construction & Extraction (24,274 | 6.0%), Installation, Maintenance & Repair (10,735 | 2.7%), and Farming, Fishing & Forestry (1,328 | 0.3%).
Natural Resources, Construction and Maintenance Occupations by Sex
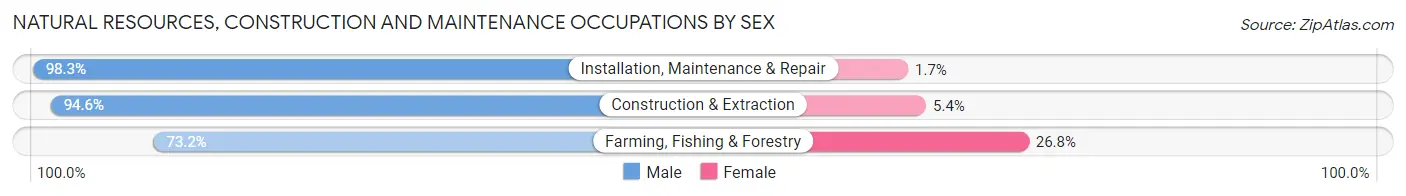
| Occupation | Male | Female |
| Farming, Fishing & Forestry | 972 (73.2%) | 356 (26.8%) |
| Construction & Extraction | 22,954 (94.6%) | 1,320 (5.4%) |
| Installation, Maintenance & Repair | 10,552 (98.3%) | 183 (1.7%) |
| Total (Category) | 34,478 (94.9%) | 1,859 (5.1%) |
| Total (Overall) | 199,297 (49.7%) | 201,995 (50.3%) |
Production, Transportation and Moving Occupations
The most common Production, Transportation and Moving occupations in Area Code 504 are Transportation (15,732 | 3.9%), Production (12,687 | 3.2%), and Material Moving (10,160 | 2.5%).
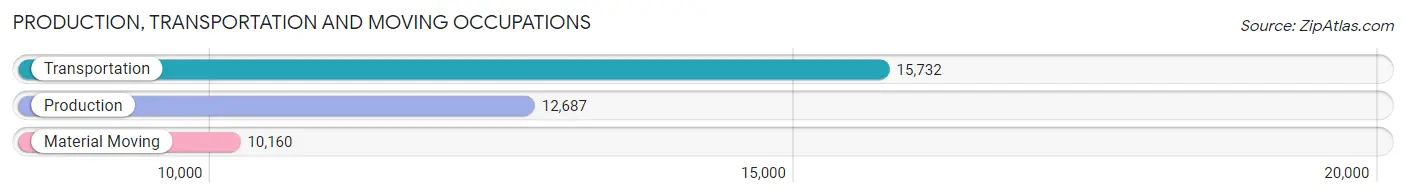
Production, Transportation and Moving Occupations by Sex
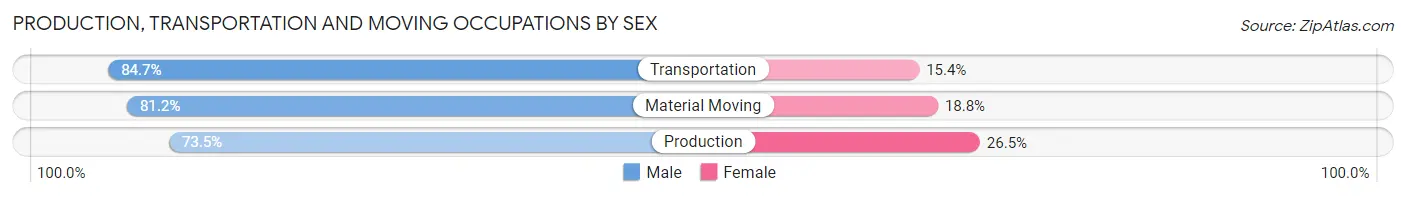
| Occupation | Male | Female |
| Production | 9,326 (73.5%) | 3,361 (26.5%) |
| Transportation | 13,317 (84.7%) | 2,415 (15.3%) |
| Material Moving | 8,251 (81.2%) | 1,909 (18.8%) |
| Total (Category) | 30,894 (80.1%) | 7,685 (19.9%) |
| Total (Overall) | 199,297 (49.7%) | 201,995 (50.3%) |
Employment Industries by Sex in Area Code 504
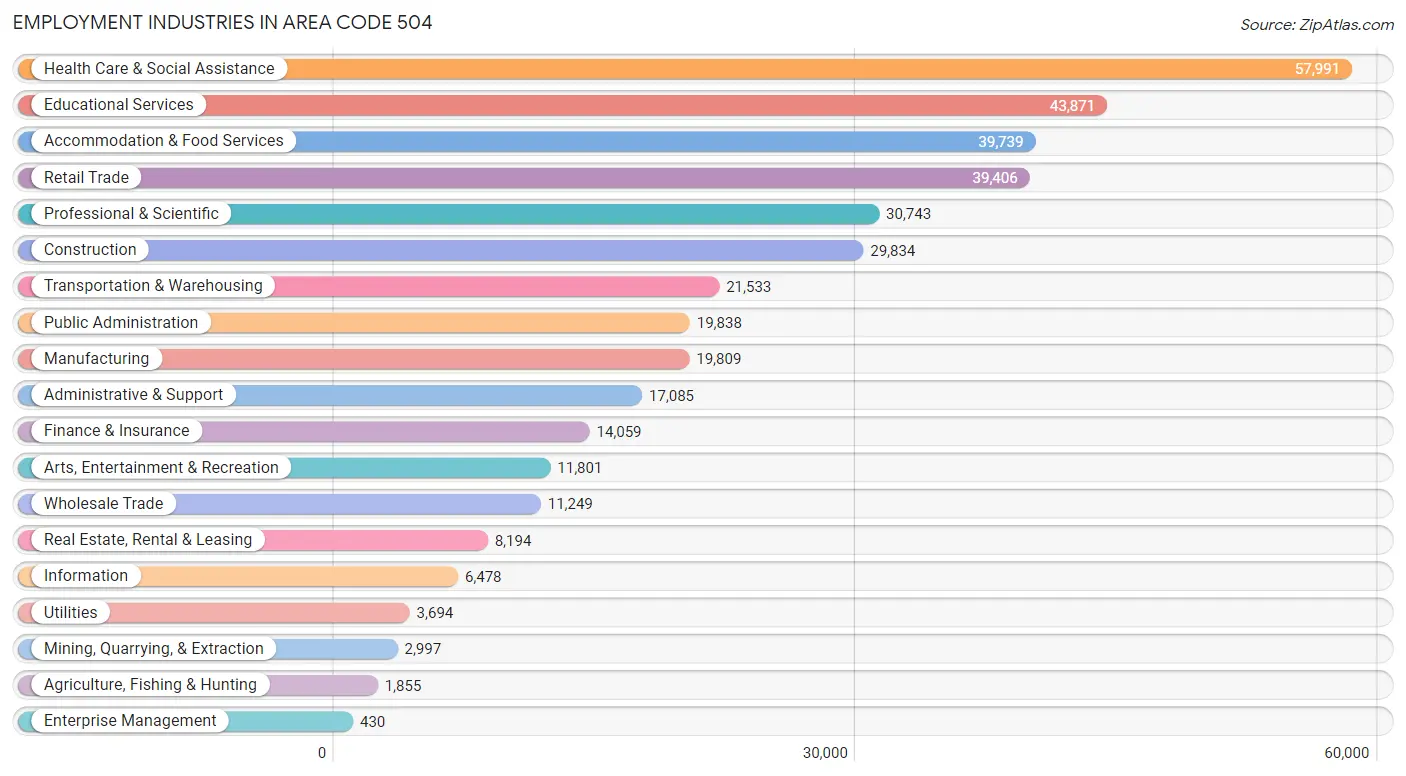
Employment Industries in Area Code 504
The major employment industries in Area Code 504 include Health Care & Social Assistance (57,991 | 14.4%), Educational Services (43,871 | 10.9%), Accommodation & Food Services (39,739 | 9.9%), Retail Trade (39,406 | 9.8%), and Professional & Scientific (30,743 | 7.7%).
Employment Industries by Sex in Area Code 504
The Area Code 504 industries that see more men than women are Construction (87.9%), Mining, Quarrying, & Extraction (83.1%), and Agriculture, Fishing & Hunting (77.9%), whereas the industries that tend to have a higher number of women are Health Care & Social Assistance (80.9%), Enterprise Management (72.1%), and Educational Services (70.0%).
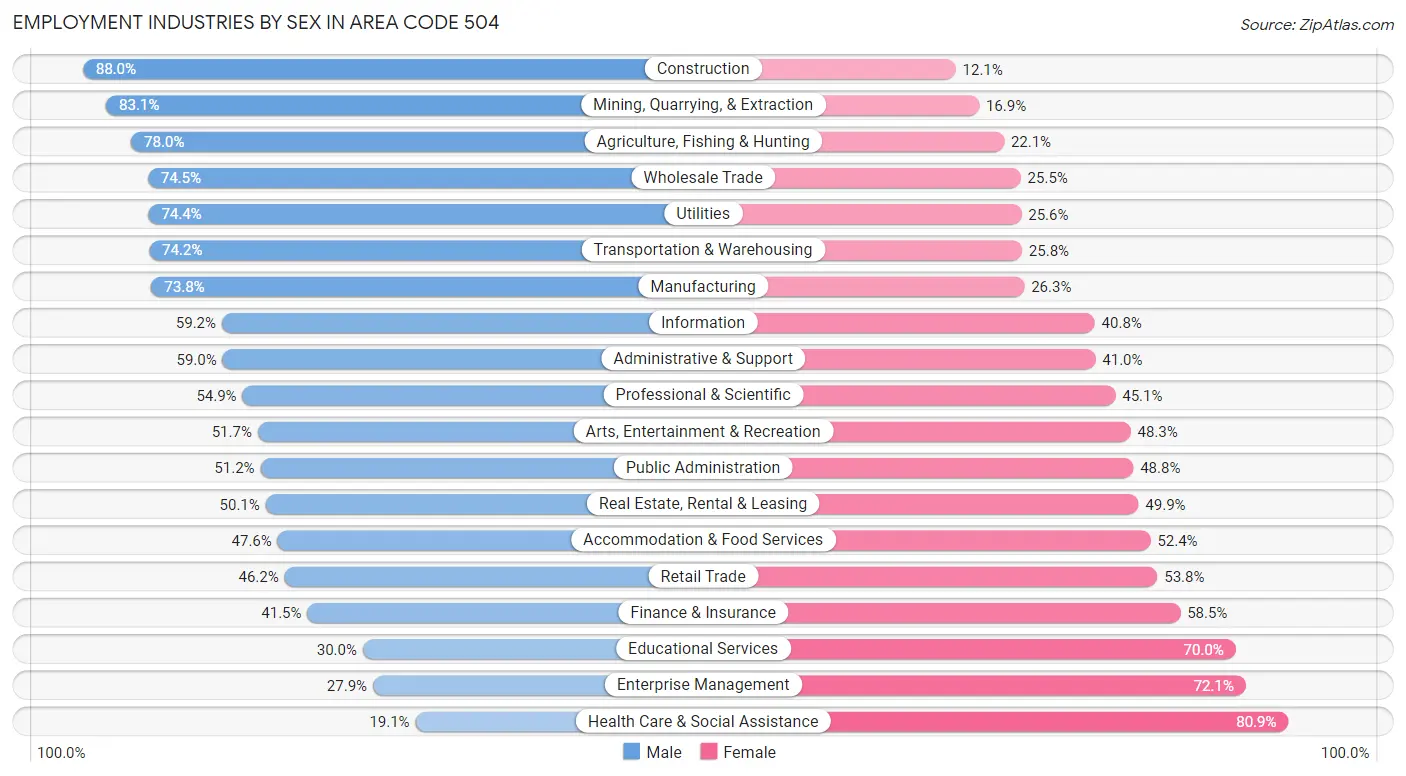
| Industry | Male | Female |
| Agriculture, Fishing & Hunting | 1,446 (77.9%) | 409 (22.1%) |
| Mining, Quarrying, & Extraction | 2,491 (83.1%) | 506 (16.9%) |
| Construction | 26,239 (87.9%) | 3,595 (12.0%) |
| Manufacturing | 14,610 (73.8%) | 5,199 (26.3%) |
| Wholesale Trade | 8,379 (74.5%) | 2,870 (25.5%) |
| Retail Trade | 18,205 (46.2%) | 21,201 (53.8%) |
| Transportation & Warehousing | 15,984 (74.2%) | 5,549 (25.8%) |
| Utilities | 2,747 (74.4%) | 947 (25.6%) |
| Information | 3,833 (59.2%) | 2,645 (40.8%) |
| Finance & Insurance | 5,830 (41.5%) | 8,229 (58.5%) |
| Real Estate, Rental & Leasing | 4,107 (50.1%) | 4,087 (49.9%) |
| Professional & Scientific | 16,880 (54.9%) | 13,863 (45.1%) |
| Enterprise Management | 120 (27.9%) | 310 (72.1%) |
| Administrative & Support | 10,086 (59.0%) | 6,999 (41.0%) |
| Educational Services | 13,163 (30.0%) | 30,708 (70.0%) |
| Health Care & Social Assistance | 11,079 (19.1%) | 46,912 (80.9%) |
| Arts, Entertainment & Recreation | 6,106 (51.7%) | 5,695 (48.3%) |
| Accommodation & Food Services | 18,926 (47.6%) | 20,813 (52.4%) |
| Public Administration | 10,156 (51.2%) | 9,682 (48.8%) |
| Total | 199,297 (49.7%) | 201,995 (50.3%) |
Education in Area Code 504
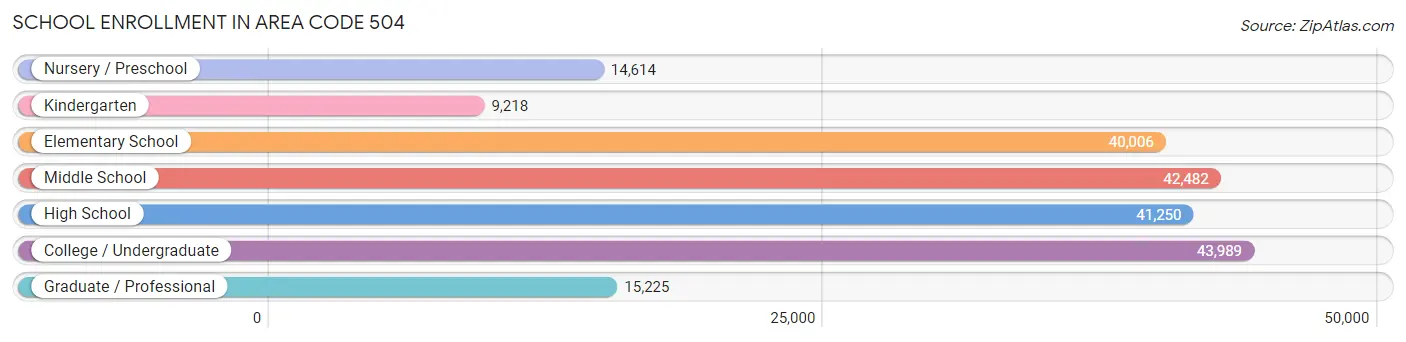
School Enrollment in Area Code 504
The most common levels of schooling among the 206,784 students in Area Code 504 are college / undergraduate (43,989 | 21.3%), middle school (42,482 | 20.5%), and high school (41,250 | 20.0%).
| School Level | # Students | % Students |
| Nursery / Preschool | 14,614 | 7.1% |
| Kindergarten | 9,218 | 4.5% |
| Elementary School | 40,006 | 19.4% |
| Middle School | 42,482 | 20.5% |
| High School | 41,250 | 20.0% |
| College / Undergraduate | 43,989 | 21.3% |
| Graduate / Professional | 15,225 | 7.4% |
| Total | 206,784 | 100.0% |
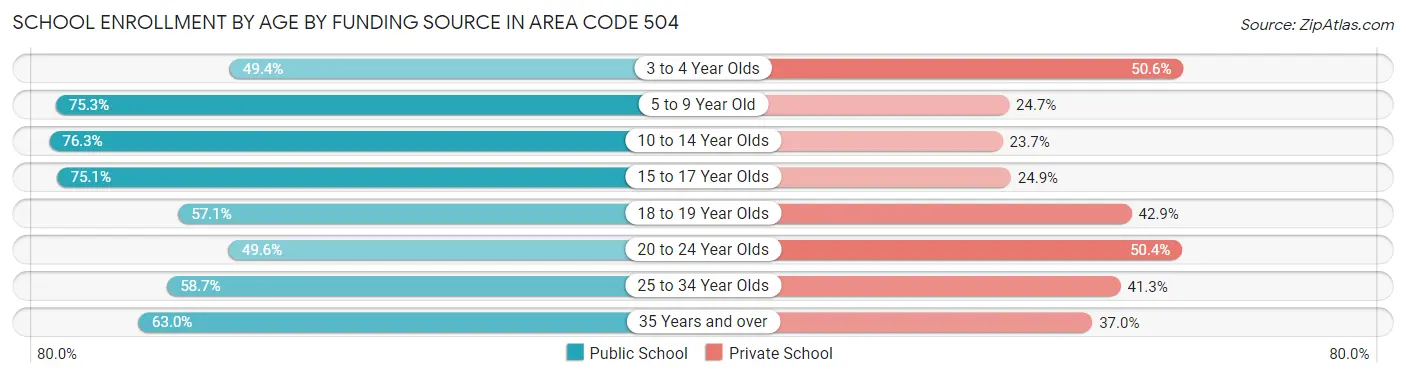
School Enrollment by Age by Funding Source in Area Code 504
Out of a total of 206,784 students who are enrolled in schools in Area Code 504, 66,459 (32.1%) attend a private institution, while the remaining 140,325 (67.9%) are enrolled in public schools. The age group of 3 to 4 year olds has the highest likelihood of being enrolled in private schools, with 5,953 (50.6% in the age bracket) enrolled. Conversely, the age group of 10 to 14 year olds has the lowest likelihood of being enrolled in a private school, with 39,050 (76.3% in the age bracket) attending a public institution.
| Age Bracket | Public School | Private School |
| 3 to 4 Year Olds | 5,811 (49.4%) | 5,953 (50.6%) |
| 5 to 9 Year Old | 36,128 (75.3%) | 11,823 (24.7%) |
| 10 to 14 Year Olds | 39,050 (76.3%) | 12,118 (23.7%) |
| 15 to 17 Year Olds | 21,698 (75.1%) | 7,202 (24.9%) |
| 18 to 19 Year Olds | 8,989 (57.1%) | 6,757 (42.9%) |
| 20 to 24 Year Olds | 10,794 (49.6%) | 10,986 (50.4%) |
| 25 to 34 Year Olds | 10,030 (58.7%) | 7,045 (41.3%) |
| 35 Years and over | 7,807 (63.0%) | 4,593 (37.0%) |
| Total | 140,325 (67.9%) | 66,459 (32.1%) |
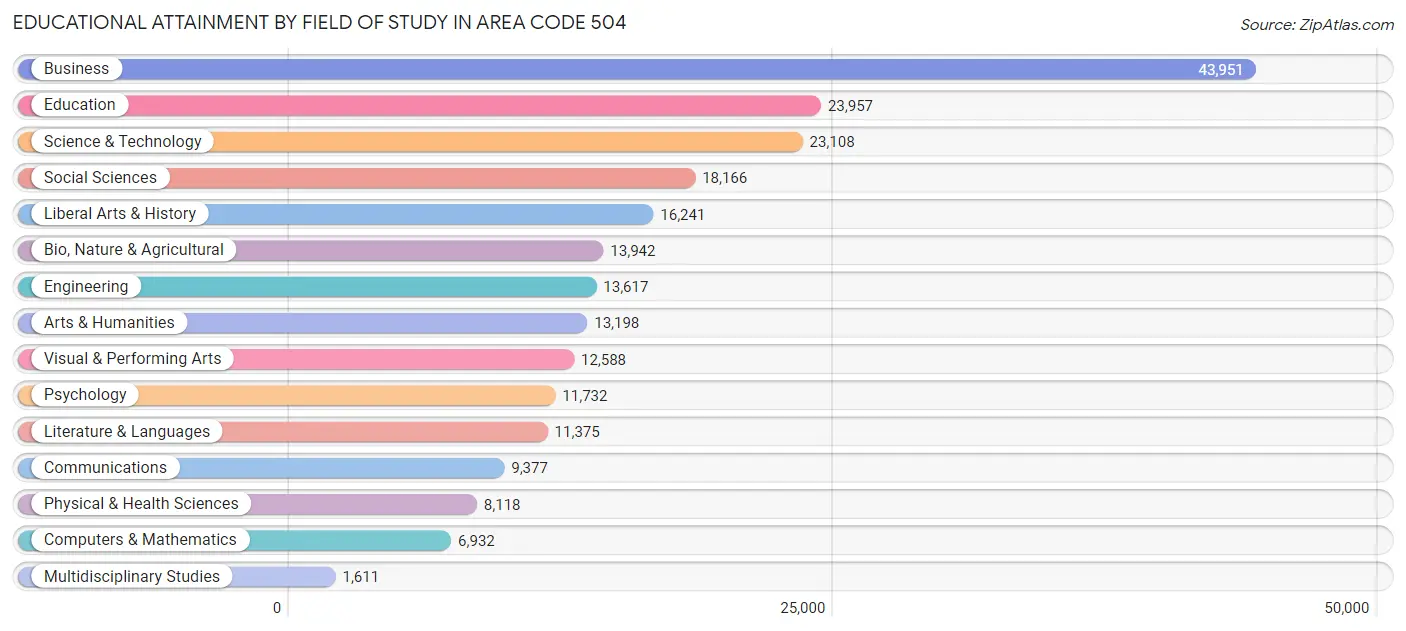
Educational Attainment by Field of Study in Area Code 504
Business (43,951 | 19.3%), education (23,957 | 10.5%), science & technology (23,108 | 10.1%), social sciences (18,166 | 8.0%), and liberal arts & history (16,241 | 7.1%) are the most common fields of study among 227,913 individuals in Area Code 504 who have obtained a bachelor's degree or higher.
| Field of Study | # Graduates | % Graduates |
| Computers & Mathematics | 6,932 | 3.0% |
| Bio, Nature & Agricultural | 13,942 | 6.1% |
| Physical & Health Sciences | 8,118 | 3.6% |
| Psychology | 11,732 | 5.1% |
| Social Sciences | 18,166 | 8.0% |
| Engineering | 13,617 | 6.0% |
| Multidisciplinary Studies | 1,611 | 0.7% |
| Science & Technology | 23,108 | 10.1% |
| Business | 43,951 | 19.3% |
| Education | 23,957 | 10.5% |
| Literature & Languages | 11,375 | 5.0% |
| Liberal Arts & History | 16,241 | 7.1% |
| Visual & Performing Arts | 12,588 | 5.5% |
| Communications | 9,377 | 4.1% |
| Arts & Humanities | 13,198 | 5.8% |
| Total | 227,913 | 100.0% |
Transportation & Commute in Area Code 504
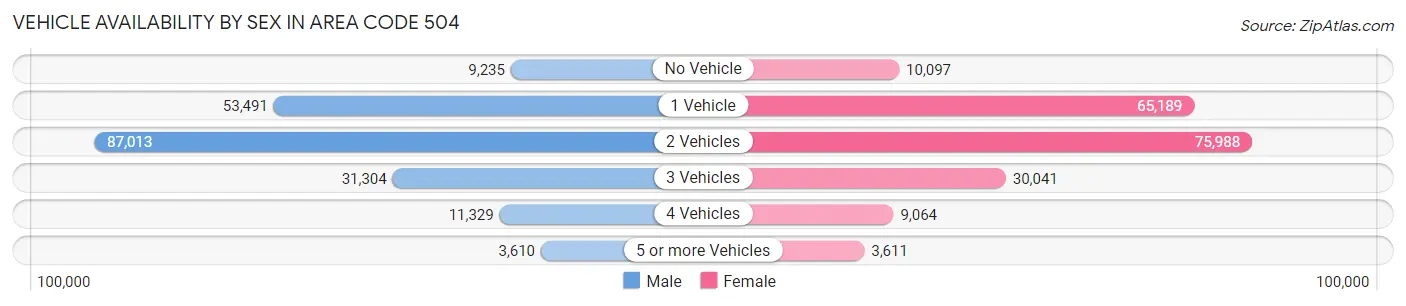
Vehicle Availability by Sex in Area Code 504
The most prevalent vehicle ownership categories in Area Code 504 are males with 2 vehicles (87,013, accounting for 44.4%) and females with 2 vehicles (75,988, making up 44.9%).
| Vehicles Available | Male | Female |
| No Vehicle | 9,235 (4.7%) | 10,097 (5.2%) |
| 1 Vehicle | 53,491 (27.3%) | 65,189 (33.6%) |
| 2 Vehicles | 87,013 (44.4%) | 75,988 (39.2%) |
| 3 Vehicles | 31,304 (16.0%) | 30,041 (15.5%) |
| 4 Vehicles | 11,329 (5.8%) | 9,064 (4.7%) |
| 5 or more Vehicles | 3,610 (1.8%) | 3,611 (1.9%) |
| Total | 195,982 (100.0%) | 193,990 (100.0%) |
Commute Time in Area Code 504
The most frequently occuring commute durations in Area Code 504 are 15 to 19 minutes (67,985 commuters, 18.9%), 20 to 24 minutes (60,037 commuters, 16.7%), and 30 to 34 minutes (56,337 commuters, 15.7%).
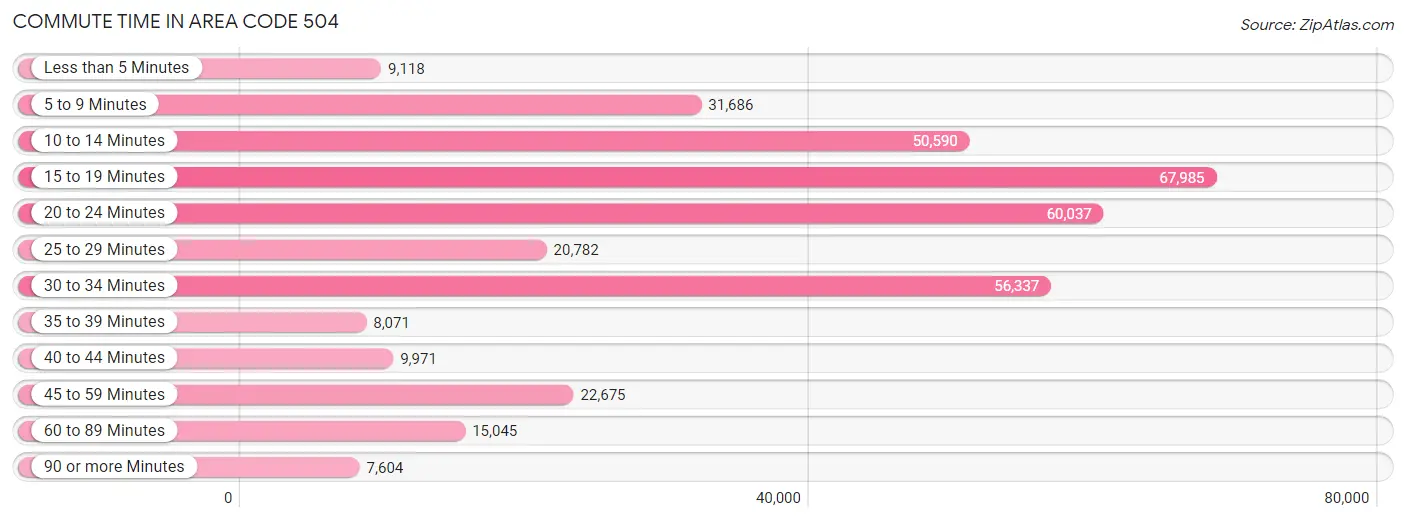
| Commute Time | # Commuters | % Commuters |
| Less than 5 Minutes | 9,118 | 2.5% |
| 5 to 9 Minutes | 31,686 | 8.8% |
| 10 to 14 Minutes | 50,590 | 14.1% |
| 15 to 19 Minutes | 67,985 | 18.9% |
| 20 to 24 Minutes | 60,037 | 16.7% |
| 25 to 29 Minutes | 20,782 | 5.8% |
| 30 to 34 Minutes | 56,337 | 15.7% |
| 35 to 39 Minutes | 8,071 | 2.2% |
| 40 to 44 Minutes | 9,971 | 2.8% |
| 45 to 59 Minutes | 22,675 | 6.3% |
| 60 to 89 Minutes | 15,045 | 4.2% |
| 90 or more Minutes | 7,604 | 2.1% |
Commute Time by Sex in Area Code 504
The most common commute times in Area Code 504 are 15 to 19 minutes (32,591 commuters, 17.9%) for males and 15 to 19 minutes (35,394 commuters, 19.9%) for females.
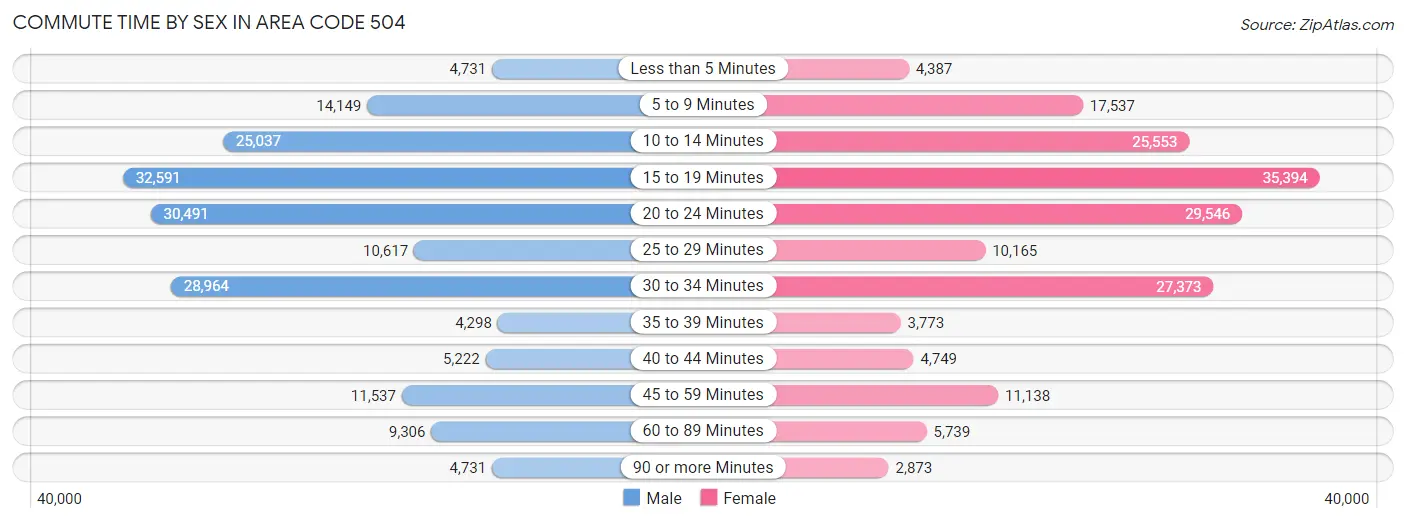
| Commute Time | Male | Female |
| Less than 5 Minutes | 4,731 (2.6%) | 4,387 (2.5%) |
| 5 to 9 Minutes | 14,149 (7.8%) | 17,537 (9.8%) |
| 10 to 14 Minutes | 25,037 (13.8%) | 25,553 (14.3%) |
| 15 to 19 Minutes | 32,591 (17.9%) | 35,394 (19.9%) |
| 20 to 24 Minutes | 30,491 (16.8%) | 29,546 (16.6%) |
| 25 to 29 Minutes | 10,617 (5.8%) | 10,165 (5.7%) |
| 30 to 34 Minutes | 28,964 (15.9%) | 27,373 (15.4%) |
| 35 to 39 Minutes | 4,298 (2.4%) | 3,773 (2.1%) |
| 40 to 44 Minutes | 5,222 (2.9%) | 4,749 (2.7%) |
| 45 to 59 Minutes | 11,537 (6.4%) | 11,138 (6.2%) |
| 60 to 89 Minutes | 9,306 (5.1%) | 5,739 (3.2%) |
| 90 or more Minutes | 4,731 (2.6%) | 2,873 (1.6%) |
Time of Departure to Work by Sex in Area Code 504
The most frequent times of departure to work in Area Code 504 are 7:00 AM to 7:29 AM (23,577, 13.0%) for males and 7:00 AM to 7:29 AM (27,854, 15.6%) for females.
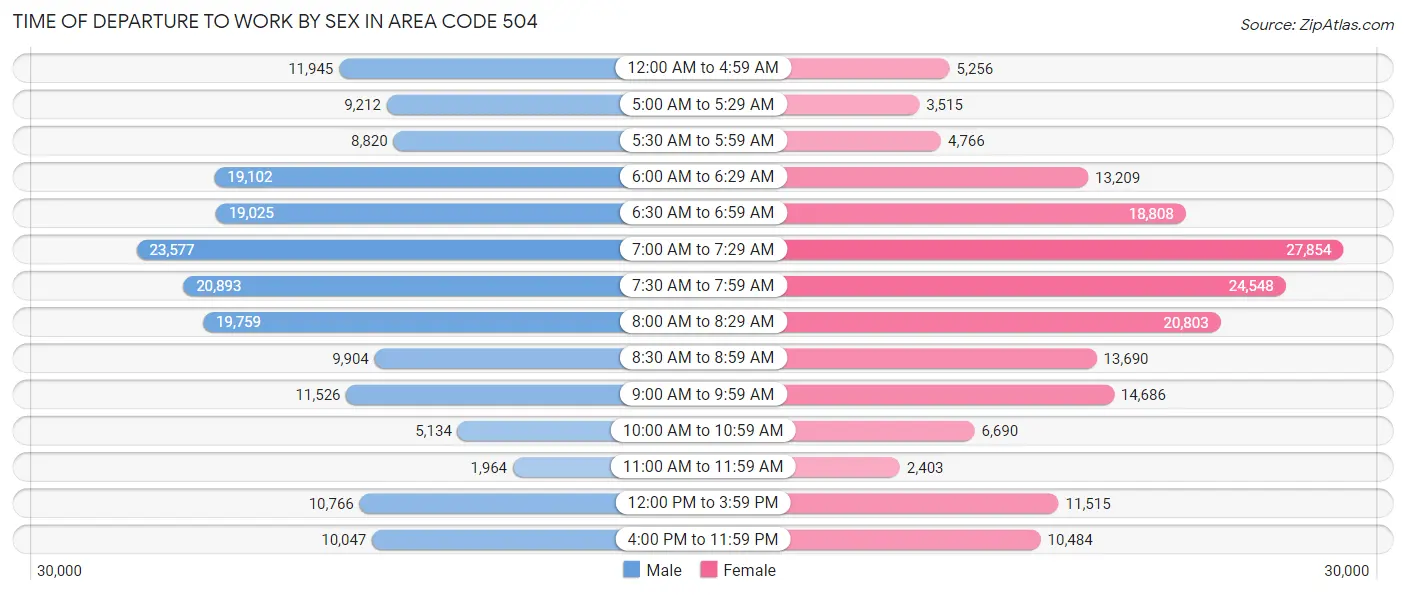
| Time of Departure | Male | Female |
| 12:00 AM to 4:59 AM | 11,945 (6.6%) | 5,256 (2.9%) |
| 5:00 AM to 5:29 AM | 9,212 (5.1%) | 3,515 (2.0%) |
| 5:30 AM to 5:59 AM | 8,820 (4.9%) | 4,766 (2.7%) |
| 6:00 AM to 6:29 AM | 19,102 (10.5%) | 13,209 (7.4%) |
| 6:30 AM to 6:59 AM | 19,025 (10.5%) | 18,808 (10.5%) |
| 7:00 AM to 7:29 AM | 23,577 (13.0%) | 27,854 (15.6%) |
| 7:30 AM to 7:59 AM | 20,893 (11.5%) | 24,548 (13.8%) |
| 8:00 AM to 8:29 AM | 19,759 (10.9%) | 20,803 (11.7%) |
| 8:30 AM to 8:59 AM | 9,904 (5.4%) | 13,690 (7.7%) |
| 9:00 AM to 9:59 AM | 11,526 (6.3%) | 14,686 (8.2%) |
| 10:00 AM to 10:59 AM | 5,134 (2.8%) | 6,690 (3.7%) |
| 11:00 AM to 11:59 AM | 1,964 (1.1%) | 2,403 (1.3%) |
| 12:00 PM to 3:59 PM | 10,766 (5.9%) | 11,515 (6.5%) |
| 4:00 PM to 11:59 PM | 10,047 (5.5%) | 10,484 (5.9%) |
| Total | 181,674 (100.0%) | 178,227 (100.0%) |
Housing Occupancy in Area Code 504
Occupancy by Ownership in Area Code 504
Of the total 346,811 dwellings in Area Code 504, owner-occupied units account for 198,621 (57.3%), while renter-occupied units make up 148,190 (42.7%).
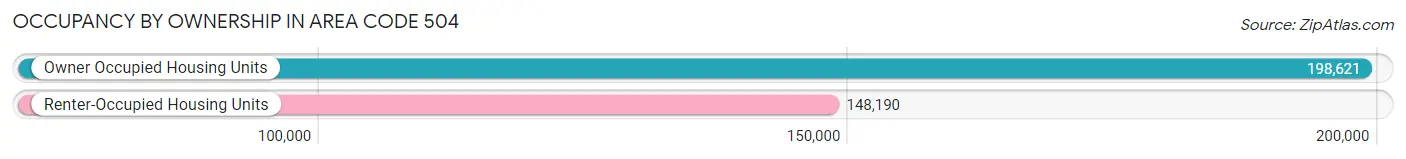
| Occupancy | # Housing Units | % Housing Units |
| Owner Occupied Housing Units | 198,621 | 57.3% |
| Renter-Occupied Housing Units | 148,190 | 42.7% |
| Total Occupied Housing Units | 346,811 | 100.0% |
Occupancy by Household Size in Area Code 504
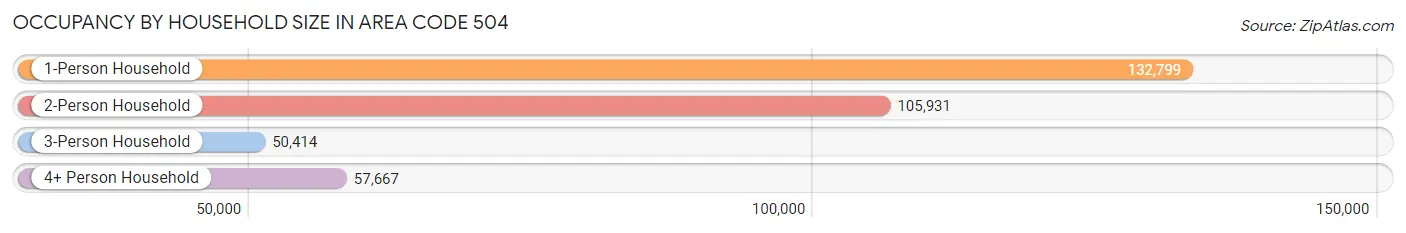
| Household Size | # Housing Units | % Housing Units |
| 1-Person Household | 132,799 | 38.3% |
| 2-Person Household | 105,931 | 30.5% |
| 3-Person Household | 50,414 | 14.5% |
| 4+ Person Household | 57,667 | 16.6% |
| Total Housing Units | 346,811 | 100.0% |
Occupancy by Ownership by Household Size in Area Code 504
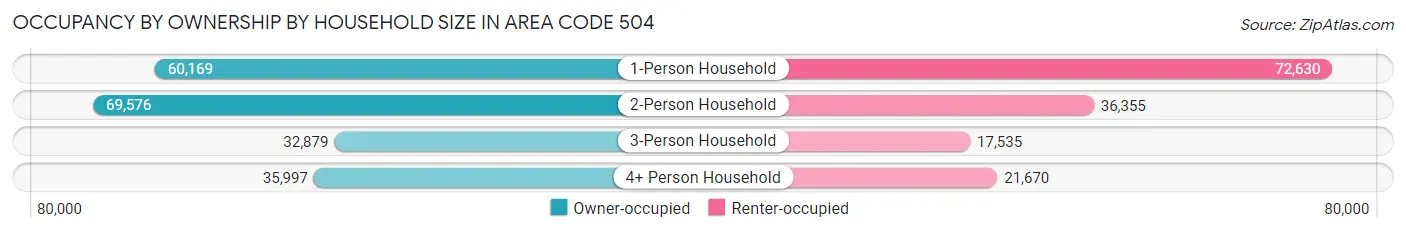
| Household Size | Owner-occupied | Renter-occupied |
| 1-Person Household | 60,169 (45.3%) | 72,630 (54.7%) |
| 2-Person Household | 69,576 (65.7%) | 36,355 (34.3%) |
| 3-Person Household | 32,879 (65.2%) | 17,535 (34.8%) |
| 4+ Person Household | 35,997 (62.4%) | 21,670 (37.6%) |
| Total Housing Units | 198,621 (57.3%) | 148,190 (42.7%) |
Occupancy by Educational Attainment in Area Code 504
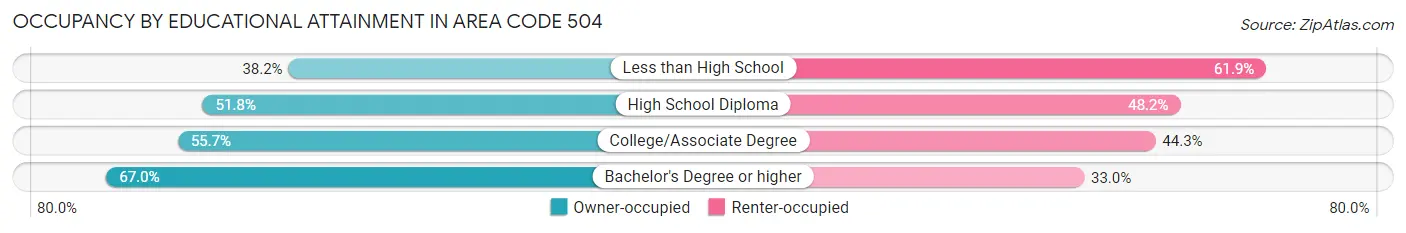
| Household Size | Owner-occupied | Renter-occupied |
| Less than High School | 13,461 (38.2%) | 21,825 (61.9%) |
| High School Diploma | 40,584 (51.8%) | 37,802 (48.2%) |
| College/Associate Degree | 57,572 (55.7%) | 45,768 (44.3%) |
| Bachelor's Degree or higher | 87,004 (67.0%) | 42,795 (33.0%) |
Occupancy by Age of Householder in Area Code 504
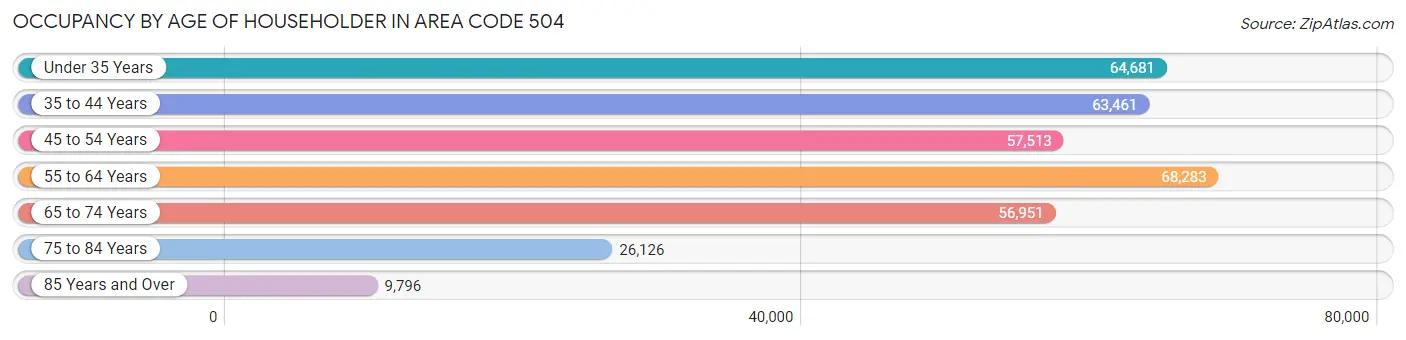
| Age Bracket | # Households | % Households |
| Under 35 Years | 64,681 | 18.6% |
| 35 to 44 Years | 63,461 | 18.3% |
| 45 to 54 Years | 57,513 | 16.6% |
| 55 to 64 Years | 68,283 | 19.7% |
| 65 to 74 Years | 56,951 | 16.4% |
| 75 to 84 Years | 26,126 | 7.5% |
| 85 Years and Over | 9,796 | 2.8% |
| Total | 346,811 | 100.0% |
Housing Finances in Area Code 504
Median Income by Occupancy in Area Code 504
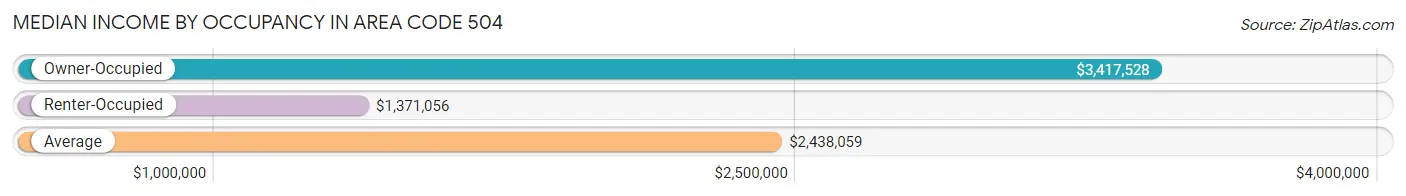
| Occupancy Type | # Households | Median Income |
| Owner-Occupied | 198,621 (57.3%) | $3,417,528 |
| Renter-Occupied | 148,190 (42.7%) | $1,371,056 |
| Average | 346,811 (100.0%) | $2,438,059 |
Occupancy by Householder Income Bracket in Area Code 504
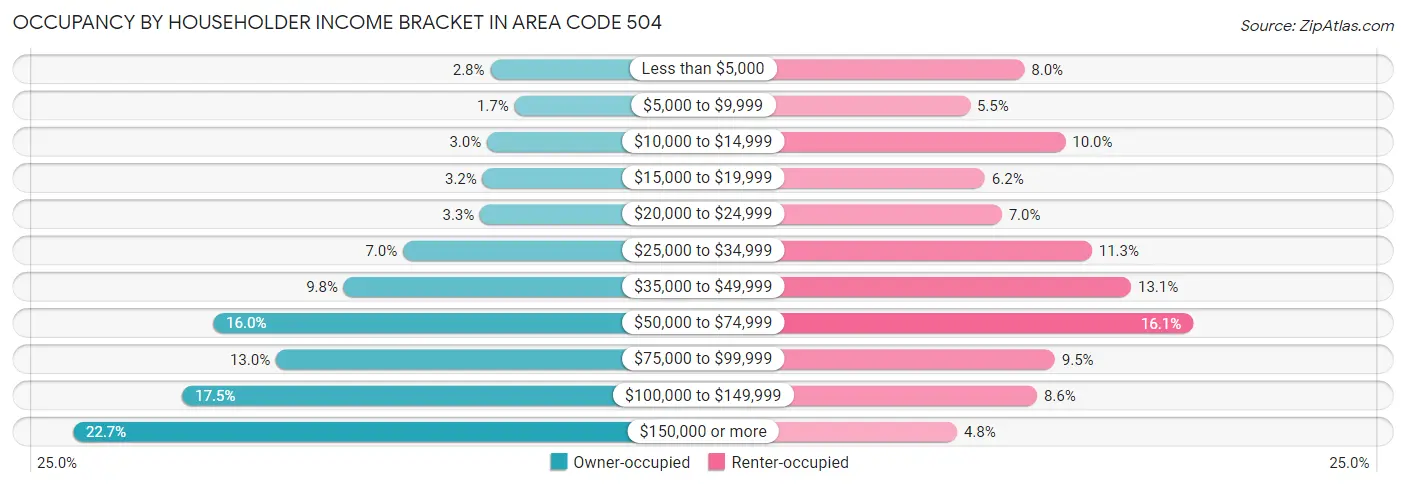
| Income Bracket | Owner-occupied | Renter-occupied |
| Less than $5,000 | 5,597 (2.8%) | 11,916 (8.0%) |
| $5,000 to $9,999 | 3,323 (1.7%) | 8,072 (5.4%) |
| $10,000 to $14,999 | 5,918 (3.0%) | 14,806 (10.0%) |
| $15,000 to $19,999 | 6,339 (3.2%) | 9,135 (6.2%) |
| $20,000 to $24,999 | 6,575 (3.3%) | 10,317 (7.0%) |
| $25,000 to $34,999 | 13,873 (7.0%) | 16,664 (11.3%) |
| $35,000 to $49,999 | 19,455 (9.8%) | 19,441 (13.1%) |
| $50,000 to $74,999 | 31,812 (16.0%) | 23,811 (16.1%) |
| $75,000 to $99,999 | 25,889 (13.0%) | 14,070 (9.5%) |
| $100,000 to $149,999 | 34,760 (17.5%) | 12,797 (8.6%) |
| $150,000 or more | 45,080 (22.7%) | 7,161 (4.8%) |
| Total | 198,621 (100.0%) | 148,190 (100.0%) |
Monthly Housing Cost Tiers in Area Code 504
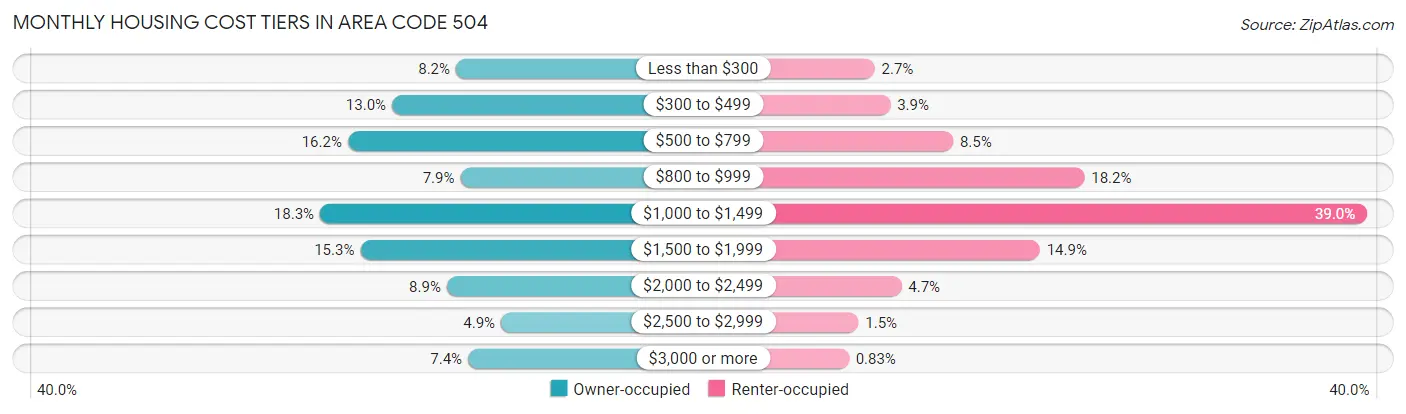
| Monthly Cost | Owner-occupied | Renter-occupied |
| Less than $300 | 16,357 (8.2%) | 4,055 (2.7%) |
| $300 to $499 | 25,721 (13.0%) | 5,765 (3.9%) |
| $500 to $799 | 32,174 (16.2%) | 12,605 (8.5%) |
| $800 to $999 | 15,712 (7.9%) | 26,939 (18.2%) |
| $1,000 to $1,499 | 36,239 (18.2%) | 57,810 (39.0%) |
| $1,500 to $1,999 | 30,351 (15.3%) | 22,080 (14.9%) |
| $2,000 to $2,499 | 17,701 (8.9%) | 6,985 (4.7%) |
| $2,500 to $2,999 | 9,772 (4.9%) | 2,282 (1.5%) |
| $3,000 or more | 14,594 (7.3%) | 1,228 (0.8%) |
| Total | 198,621 (100.0%) | 148,190 (100.0%) |
Physical Housing Characteristics in Area Code 504
Housing Structures in Area Code 504
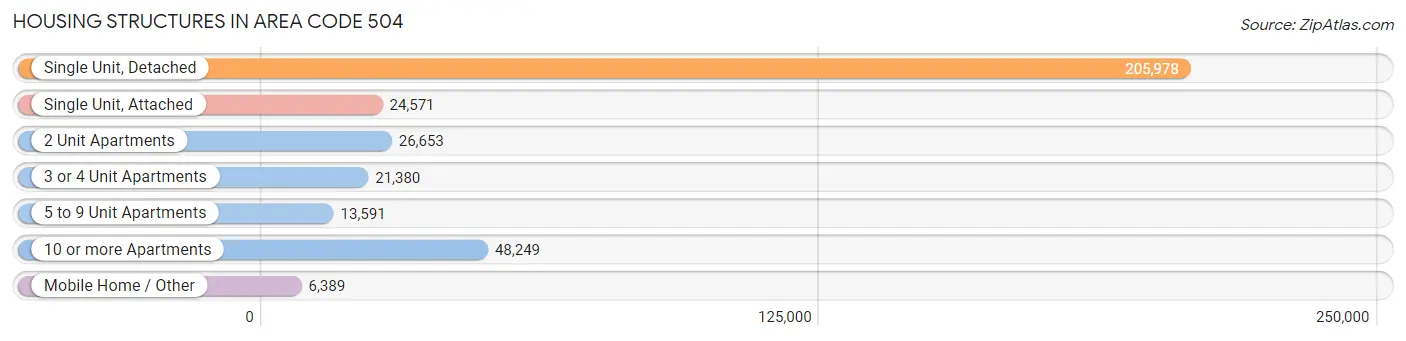
| Structure Type | # Housing Units | % Housing Units |
| Single Unit, Detached | 205,978 | 59.4% |
| Single Unit, Attached | 24,571 | 7.1% |
| 2 Unit Apartments | 26,653 | 7.7% |
| 3 or 4 Unit Apartments | 21,380 | 6.2% |
| 5 to 9 Unit Apartments | 13,591 | 3.9% |
| 10 or more Apartments | 48,249 | 13.9% |
| Mobile Home / Other | 6,389 | 1.8% |
| Total | 346,811 | 100.0% |
Housing Structures by Occupancy in Area Code 504
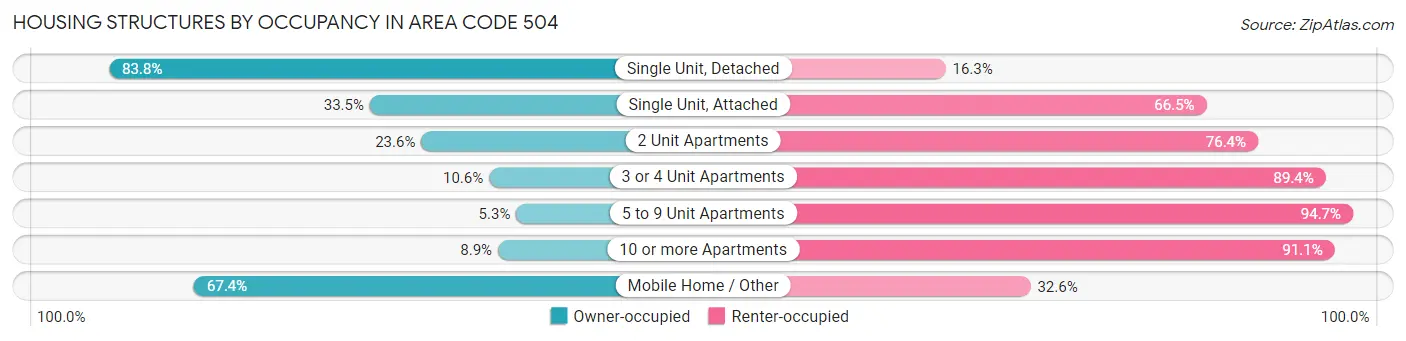
| Structure Type | Owner-occupied | Renter-occupied |
| Single Unit, Detached | 172,515 (83.8%) | 33,463 (16.3%) |
| Single Unit, Attached | 8,241 (33.5%) | 16,330 (66.5%) |
| 2 Unit Apartments | 6,298 (23.6%) | 20,355 (76.4%) |
| 3 or 4 Unit Apartments | 2,261 (10.6%) | 19,119 (89.4%) |
| 5 to 9 Unit Apartments | 726 (5.3%) | 12,865 (94.7%) |
| 10 or more Apartments | 4,274 (8.9%) | 43,975 (91.1%) |
| Mobile Home / Other | 4,306 (67.4%) | 2,083 (32.6%) |
| Total | 198,621 (57.3%) | 148,190 (42.7%) |
Housing Structures by Number of Rooms in Area Code 504
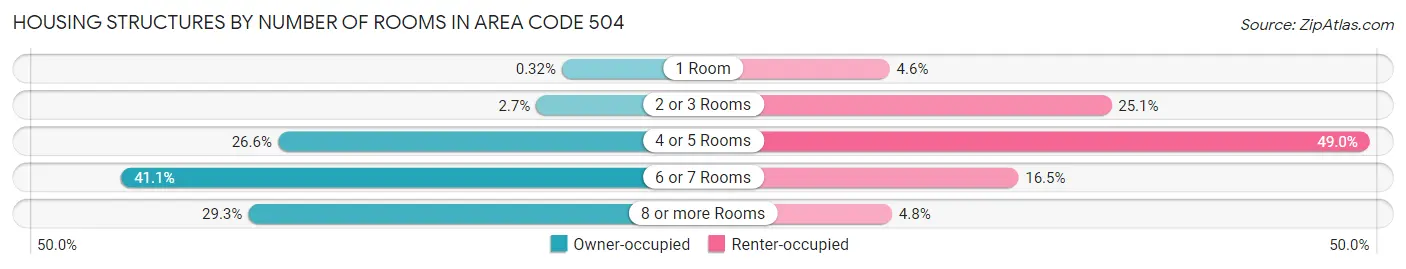
| Number of Rooms | Owner-occupied | Renter-occupied |
| 1 Room | 636 (0.3%) | 6,819 (4.6%) |
| 2 or 3 Rooms | 5,368 (2.7%) | 37,198 (25.1%) |
| 4 or 5 Rooms | 52,804 (26.6%) | 72,596 (49.0%) |
| 6 or 7 Rooms | 81,548 (41.1%) | 24,444 (16.5%) |
| 8 or more Rooms | 58,265 (29.3%) | 7,133 (4.8%) |
| Total | 198,621 (100.0%) | 148,190 (100.0%) |
Housing Structure by Heating Type in Area Code 504
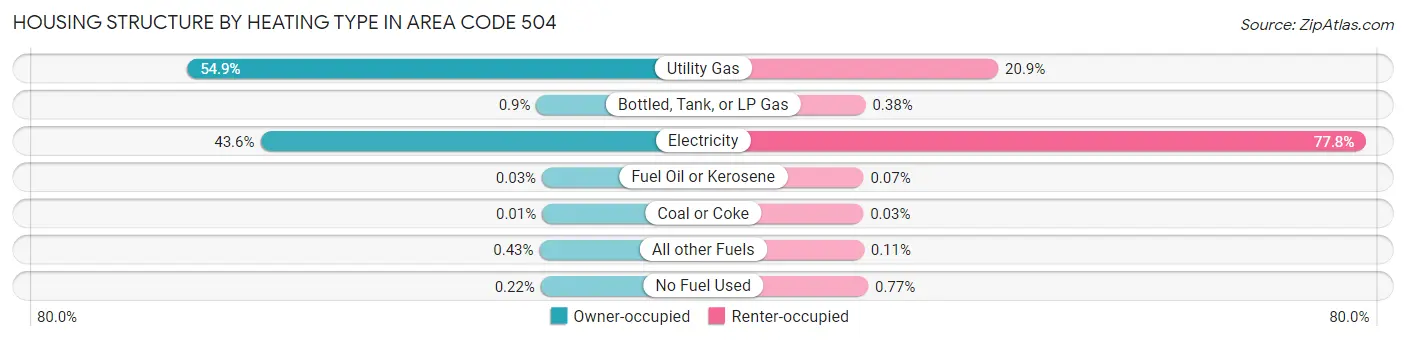
| Heating Type | Owner-occupied | Renter-occupied |
| Utility Gas | 108,965 (54.9%) | 30,948 (20.9%) |
| Bottled, Tank, or LP Gas | 1,779 (0.9%) | 558 (0.4%) |
| Electricity | 86,514 (43.6%) | 115,235 (77.8%) |
| Fuel Oil or Kerosene | 52 (0.0%) | 109 (0.1%) |
| Coal or Coke | 21 (0.0%) | 39 (0.0%) |
| All other Fuels | 845 (0.4%) | 156 (0.1%) |
| No Fuel Used | 445 (0.2%) | 1,145 (0.8%) |
| Total | 198,621 (100.0%) | 148,190 (100.0%) |
Household Vehicle Usage in Area Code 504
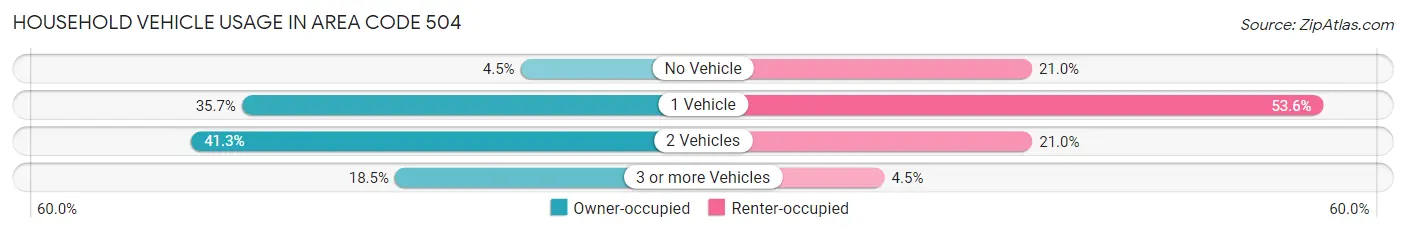
| Vehicles per Household | Owner-occupied | Renter-occupied |
| No Vehicle | 8,864 (4.5%) | 31,046 (20.9%) |
| 1 Vehicle | 70,862 (35.7%) | 79,436 (53.6%) |
| 2 Vehicles | 82,091 (41.3%) | 31,107 (21.0%) |
| 3 or more Vehicles | 36,804 (18.5%) | 6,601 (4.4%) |
| Total | 198,621 (100.0%) | 148,190 (100.0%) |
Real Estate & Mortgages in Area Code 504
Real Estate and Mortgage Overview in Area Code 504
| Characteristic | Without Mortgage | With Mortgage |
| Housing Units | 90,086 | 108,535 |
| Median Property Value | $10,233,200 | $11,428,300 |
| Median Household Income | $2,556,920 | $30,351 |
| Monthly Housing Costs | $23,108 | $14,073 |
| Real Estate Taxes | $59,635 | $5,852 |
Property Value by Mortgage Status in Area Code 504
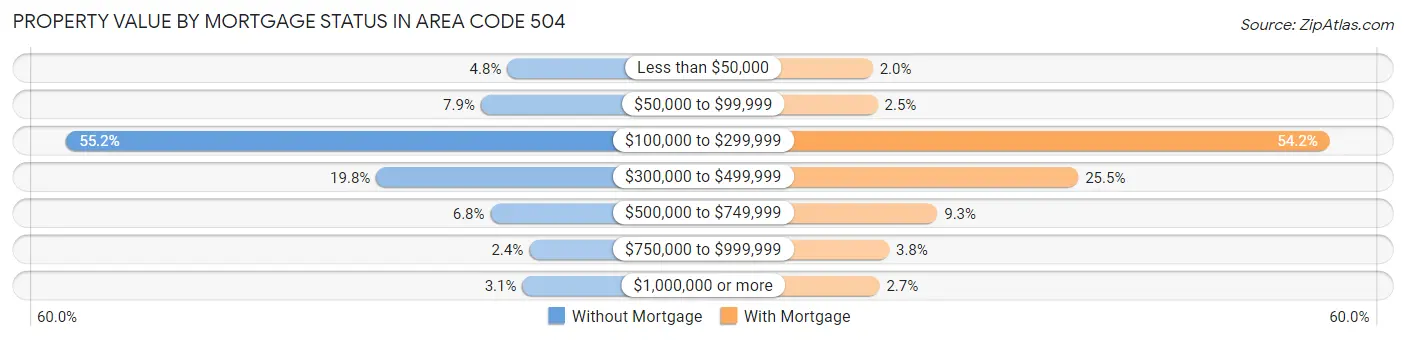
| Property Value | Without Mortgage | With Mortgage |
| Less than $50,000 | 4,360 (4.8%) | 2,123 (2.0%) |
| $50,000 to $99,999 | 7,094 (7.9%) | 2,730 (2.5%) |
| $100,000 to $299,999 | 49,754 (55.2%) | 58,800 (54.2%) |
| $300,000 to $499,999 | 17,852 (19.8%) | 27,625 (25.5%) |
| $500,000 to $749,999 | 6,099 (6.8%) | 10,137 (9.3%) |
| $750,000 to $999,999 | 2,116 (2.4%) | 4,154 (3.8%) |
| $1,000,000 or more | 2,811 (3.1%) | 2,966 (2.7%) |
| Total | 90,086 (100.0%) | 108,535 (100.0%) |
Household Income by Mortgage Status in Area Code 504
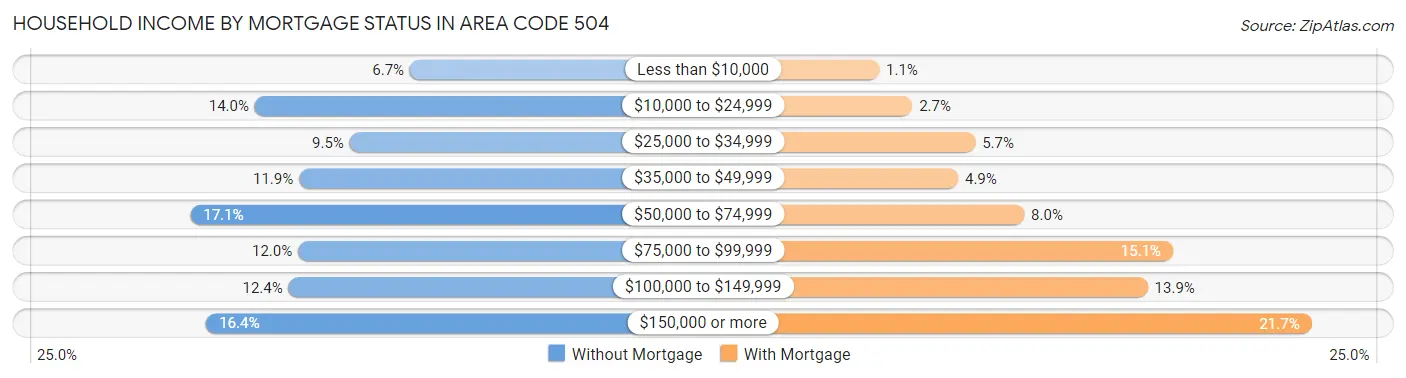
| Household Income | Without Mortgage | With Mortgage |
| Less than $10,000 | 5,988 (6.7%) | 1,220 (1.1%) |
| $10,000 to $24,999 | 12,645 (14.0%) | 2,932 (2.7%) |
| $25,000 to $34,999 | 8,579 (9.5%) | 6,187 (5.7%) |
| $35,000 to $49,999 | 10,745 (11.9%) | 5,294 (4.9%) |
| $50,000 to $74,999 | 15,411 (17.1%) | 8,710 (8.0%) |
| $75,000 to $99,999 | 10,793 (12.0%) | 16,401 (15.1%) |
| $100,000 to $149,999 | 11,196 (12.4%) | 15,096 (13.9%) |
| $150,000 or more | 14,729 (16.4%) | 23,564 (21.7%) |
| Total | 90,086 (100.0%) | 108,535 (100.0%) |
Property Value to Household Income Ratio in Area Code 504
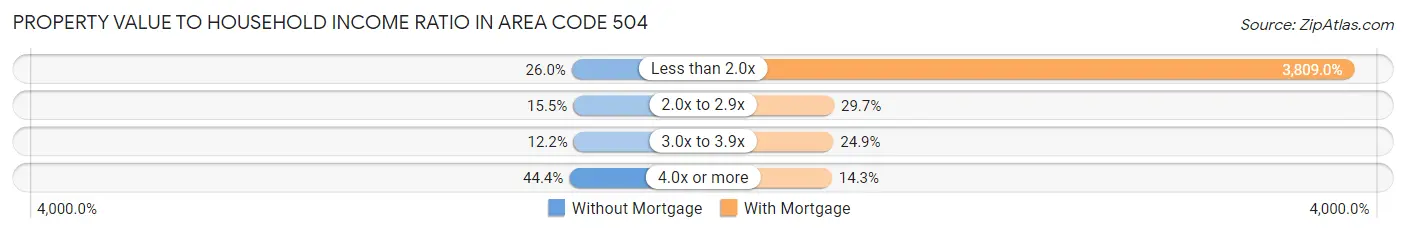
| Value-to-Income Ratio | Without Mortgage | With Mortgage |
| Less than 2.0x | 23,375 (26.0%) | 4,134,064 (3,809.0%) |
| 2.0x to 2.9x | 13,990 (15.5%) | 32,215 (29.7%) |
| 3.0x to 3.9x | 10,974 (12.2%) | 27,034 (24.9%) |
| 4.0x or more | 39,969 (44.4%) | 15,513 (14.3%) |
| Total | 90,086 (100.0%) | 108,535 (100.0%) |
Real Estate Taxes by Mortgage Status in Area Code 504
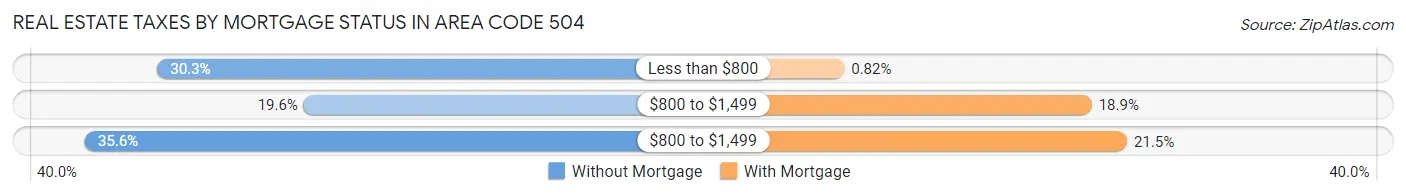
| Property Taxes | Without Mortgage | With Mortgage |
| Less than $800 | 27,300 (30.3%) | 894 (0.8%) |
| $800 to $1,499 | 17,663 (19.6%) | 20,515 (18.9%) |
| $800 to $1,499 | 32,064 (35.6%) | 23,310 (21.5%) |
| Total | 90,086 (100.0%) | 108,535 (100.0%) |
Health & Disability in Area Code 504
Health Insurance Coverage by Age in Area Code 504
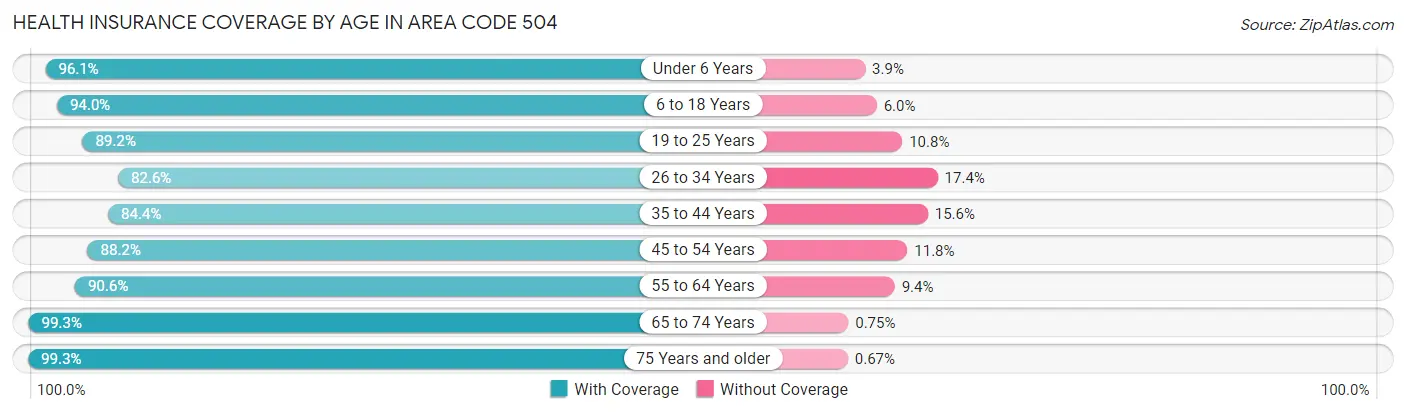
| Age Bracket | With Coverage | Without Coverage |
| Under 6 Years | 57,616 (96.1%) | 2,335 (3.9%) |
| 6 to 18 Years | 124,669 (94.0%) | 8,007 (6.0%) |
| 19 to 25 Years | 62,790 (89.2%) | 7,602 (10.8%) |
| 26 to 34 Years | 94,945 (82.6%) | 20,015 (17.4%) |
| 35 to 44 Years | 98,317 (84.4%) | 18,127 (15.6%) |
| 45 to 54 Years | 87,367 (88.2%) | 11,639 (11.8%) |
| 55 to 64 Years | 102,227 (90.6%) | 10,611 (9.4%) |
| 65 to 74 Years | 86,264 (99.3%) | 649 (0.7%) |
| 75 Years and older | 53,891 (99.3%) | 364 (0.7%) |
| Total | 768,086 (90.6%) | 79,349 (9.4%) |
Health Insurance Coverage by Citizenship Status in Area Code 504
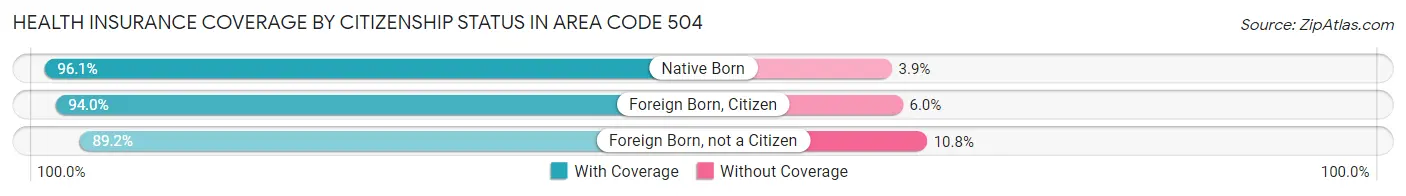
| Citizenship Status | With Coverage | Without Coverage |
| Native Born | 57,616 (96.1%) | 2,335 (3.9%) |
| Foreign Born, Citizen | 124,669 (94.0%) | 8,007 (6.0%) |
| Foreign Born, not a Citizen | 62,790 (89.2%) | 7,602 (10.8%) |
Health Insurance Coverage by Household Income in Area Code 504
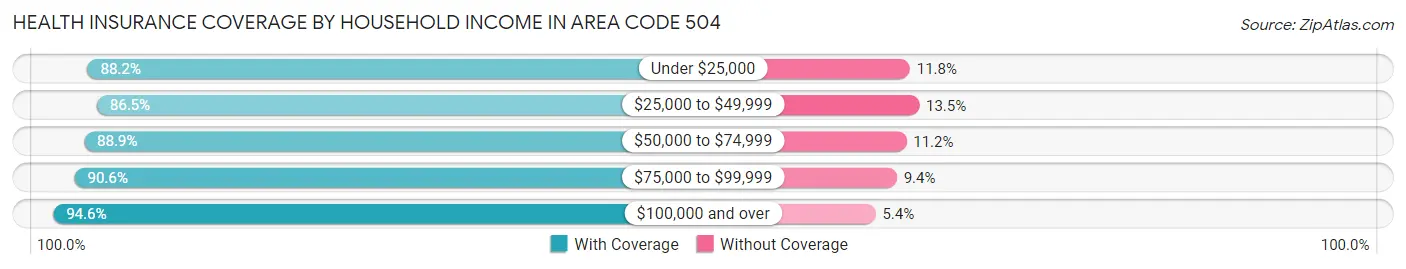
| Household Income | With Coverage | Without Coverage |
| Under $25,000 | 130,279 (88.2%) | 17,437 (11.8%) |
| $25,000 to $49,999 | 131,714 (86.5%) | 20,632 (13.5%) |
| $50,000 to $74,999 | 118,759 (88.8%) | 14,906 (11.2%) |
| $75,000 to $99,999 | 93,382 (90.6%) | 9,642 (9.4%) |
| $100,000 and over | 283,691 (94.6%) | 16,094 (5.4%) |
Public vs Private Health Insurance Coverage by Age in Area Code 504
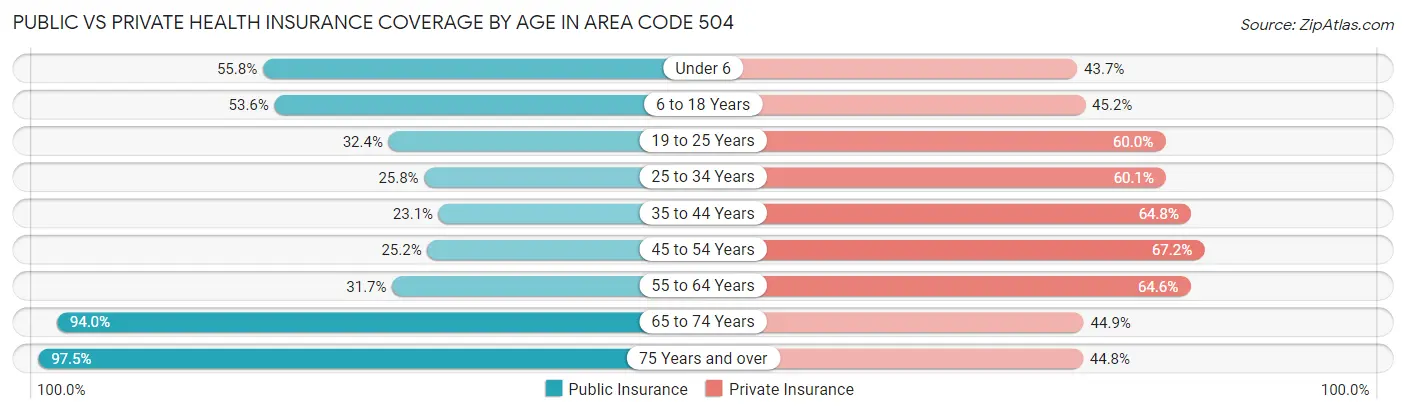
| Age Bracket | Public Insurance | Private Insurance |
| Under 6 | 33,421 (55.7%) | 26,190 (43.7%) |
| 6 to 18 Years | 71,097 (53.6%) | 59,930 (45.2%) |
| 19 to 25 Years | 22,812 (32.4%) | 42,237 (60.0%) |
| 25 to 34 Years | 29,639 (25.8%) | 69,116 (60.1%) |
| 35 to 44 Years | 26,902 (23.1%) | 75,407 (64.8%) |
| 45 to 54 Years | 24,971 (25.2%) | 66,556 (67.2%) |
| 55 to 64 Years | 35,810 (31.7%) | 72,925 (64.6%) |
| 65 to 74 Years | 81,706 (94.0%) | 39,017 (44.9%) |
| 75 Years and over | 52,880 (97.5%) | 24,281 (44.8%) |
| Total | 379,238 (44.8%) | 475,659 (56.1%) |
Disability Status by Sex by Age in Area Code 504
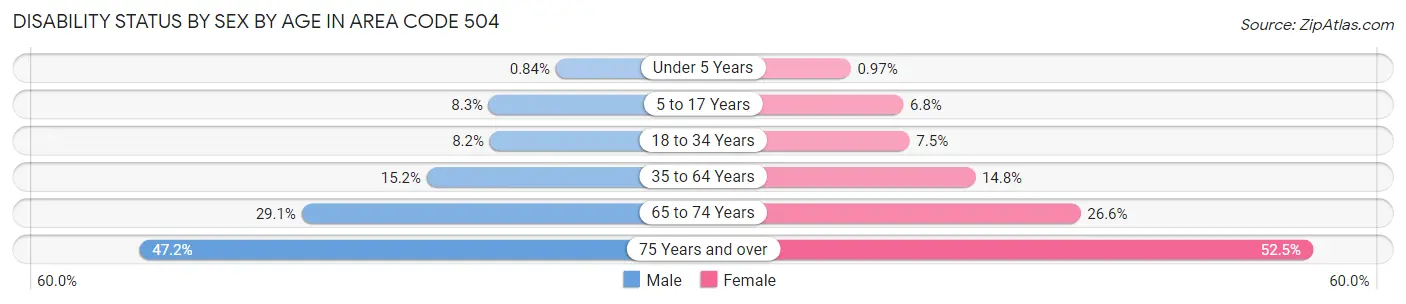
| Age Bracket | Male | Female |
| Under 5 Years | 220 (0.8%) | 240 (1.0%) |
| 5 to 17 Years | 5,548 (8.3%) | 4,454 (6.8%) |
| 18 to 34 Years | 7,499 (8.2%) | 7,793 (7.5%) |
| 35 to 64 Years | 24,033 (15.2%) | 25,238 (14.8%) |
| 65 to 74 Years | 11,736 (29.1%) | 12,391 (26.6%) |
| 75 Years and over | 10,319 (47.2%) | 16,999 (52.5%) |
Disability Class by Sex by Age in Area Code 504
Disability Class: Hearing Difficulty
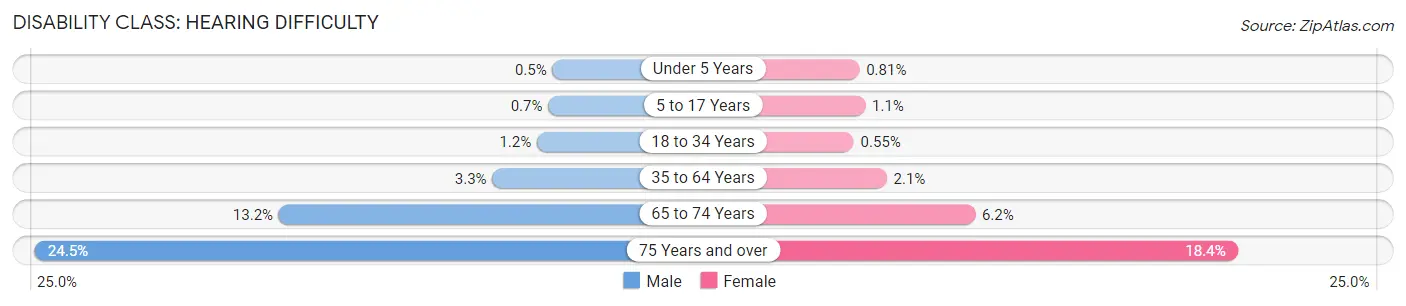
| Age Bracket | Male | Female |
| Under 5 Years | 131 (0.5%) | 201 (0.8%) |
| 5 to 17 Years | 467 (0.7%) | 706 (1.1%) |
| 18 to 34 Years | 1,114 (1.2%) | 567 (0.5%) |
| 35 to 64 Years | 5,205 (3.3%) | 3,537 (2.1%) |
| 65 to 74 Years | 5,316 (13.2%) | 2,883 (6.2%) |
| 75 Years and over | 5,359 (24.5%) | 5,950 (18.4%) |
Disability Class: Vision Difficulty
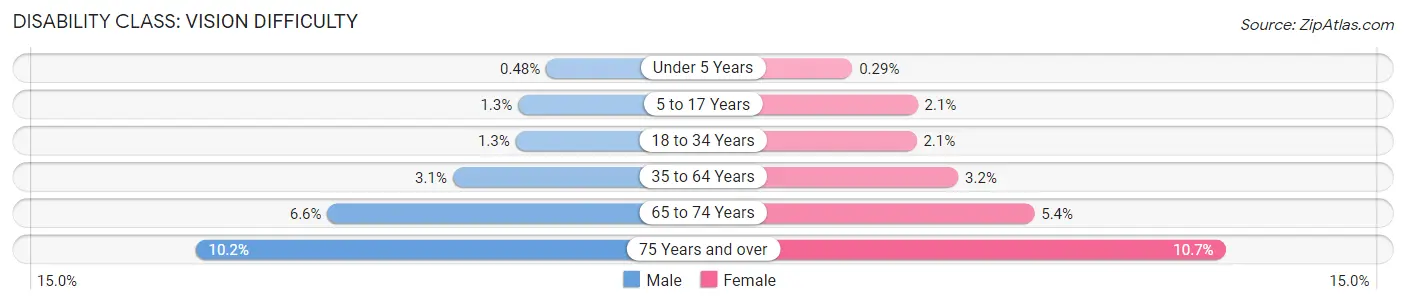
| Age Bracket | Male | Female |
| Under 5 Years | 124 (0.5%) | 71 (0.3%) |
| 5 to 17 Years | 842 (1.3%) | 1,380 (2.1%) |
| 18 to 34 Years | 1,217 (1.3%) | 2,155 (2.1%) |
| 35 to 64 Years | 4,864 (3.1%) | 5,516 (3.2%) |
| 65 to 74 Years | 2,645 (6.6%) | 2,501 (5.4%) |
| 75 Years and over | 2,238 (10.2%) | 3,459 (10.7%) |
Disability Class: Cognitive Difficulty
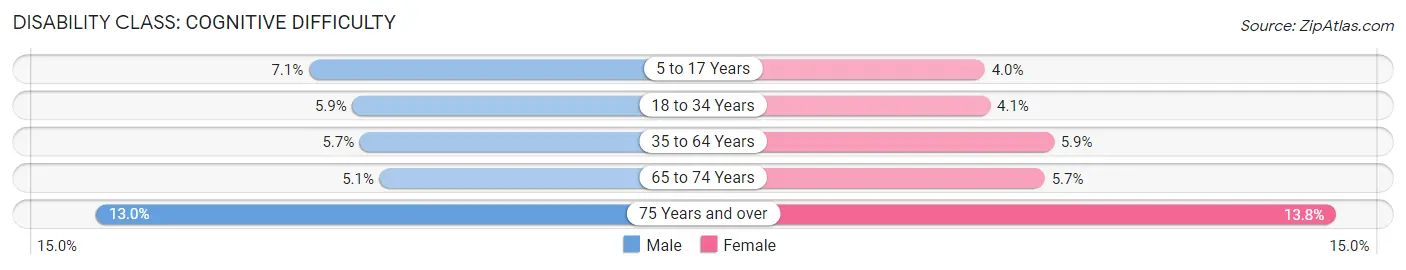
| Age Bracket | Male | Female |
| 5 to 17 Years | 4,735 (7.1%) | 2,594 (4.0%) |
| 18 to 34 Years | 5,375 (5.9%) | 4,272 (4.1%) |
| 35 to 64 Years | 8,946 (5.7%) | 10,042 (5.9%) |
| 65 to 74 Years | 2,060 (5.1%) | 2,633 (5.7%) |
| 75 Years and over | 2,844 (13.0%) | 4,459 (13.8%) |
Disability Class: Ambulatory Difficulty
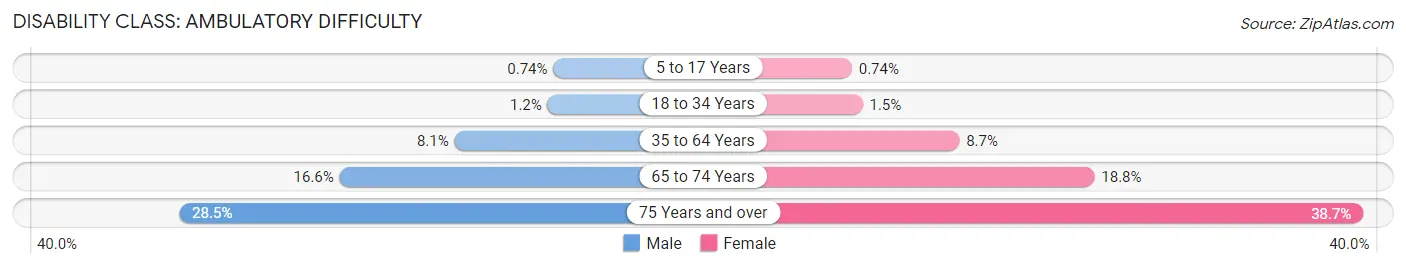
| Age Bracket | Male | Female |
| 5 to 17 Years | 494 (0.7%) | 481 (0.7%) |
| 18 to 34 Years | 1,067 (1.2%) | 1,589 (1.5%) |
| 35 to 64 Years | 12,784 (8.1%) | 14,829 (8.7%) |
| 65 to 74 Years | 6,690 (16.6%) | 8,743 (18.8%) |
| 75 Years and over | 6,234 (28.5%) | 12,544 (38.7%) |
Disability Class: Self-Care Difficulty
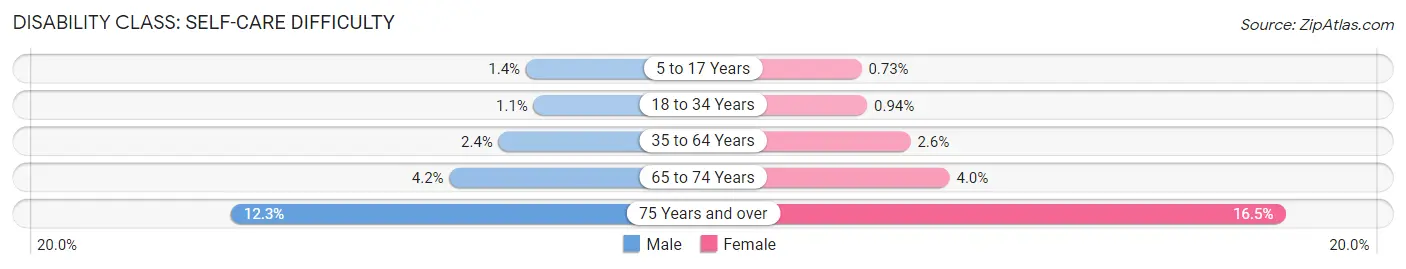
| Age Bracket | Male | Female |
| 5 to 17 Years | 930 (1.4%) | 477 (0.7%) |
| 18 to 34 Years | 1,011 (1.1%) | 975 (0.9%) |
| 35 to 64 Years | 3,794 (2.4%) | 4,345 (2.5%) |
| 65 to 74 Years | 1,703 (4.2%) | 1,867 (4.0%) |
| 75 Years and over | 2,697 (12.3%) | 5,334 (16.5%) |
Technology Access in Area Code 504
Computing Device Access in Area Code 504
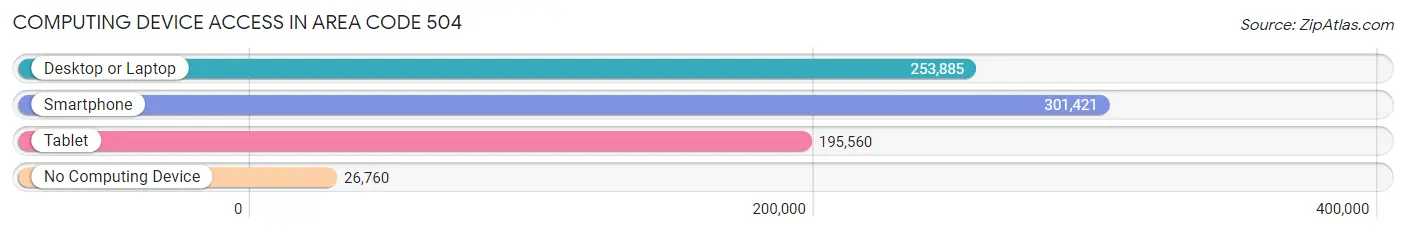
| Device Type | # Households | % Households |
| Desktop or Laptop | 253,885 | 73.2% |
| Smartphone | 301,421 | 86.9% |
| Tablet | 195,560 | 56.4% |
| No Computing Device | 26,760 | 7.7% |
| Total | 346,811 | 100.0% |
Internet Access in Area Code 504
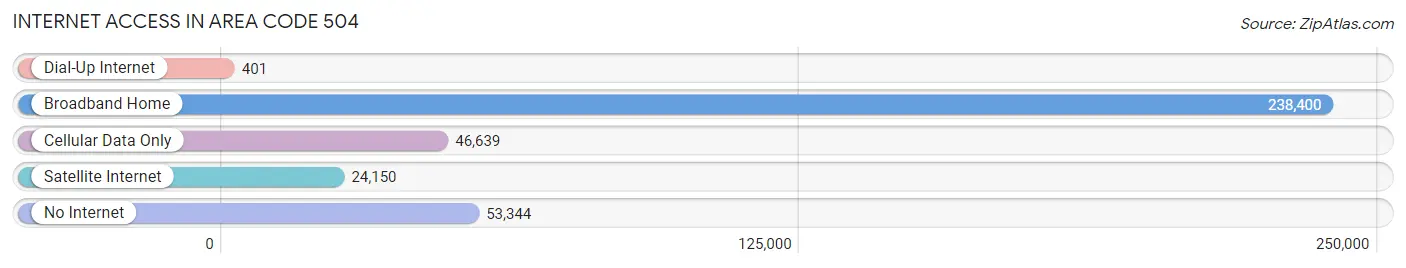
| Internet Type | # Households | % Households |
| Dial-Up Internet | 401 | 0.1% |
| Broadband Home | 238,400 | 68.7% |
| Cellular Data Only | 46,639 | 13.5% |
| Satellite Internet | 24,150 | 7.0% |
| No Internet | 53,344 | 15.4% |
| Total | 346,811 | 100.0% |
Area Code 504 Summary
Geography
Area code 504 is a telephone area code in the North American Numbering Plan (NANP) for the city of New Orleans, Louisiana. It covers the entire city and its surrounding suburbs, including Metairie, Kenner, and Slidell.
Social
Area code 504 is a vibrant area with a rich culture and history. It is home to many of the city's most iconic landmarks, such as the French Quarter, Bourbon Street, and the Mississippi River. It is also home to a diverse population, with a mix of African-American, Creole, and Cajun cultures.
Economics
Area code 504 is an important economic hub for the state of Louisiana. It is home to many of the city's major industries, such as tourism, oil and gas, and shipping. It is also home to several major universities, including Tulane University and the University of New Orleans.
Demographics
Area code 504 is home to a population of over 1.2 million people. The majority of the population is African-American, followed by White, Hispanic, and Asian. The median household income is $37,000, and the median age is 34.
Common Questions
What is Per Capita Income in Area Code 504?
Per Capita income in Area Code 504 is $34,661.
What is the Median Family Income in Area Code 504?
Median Family Income in Area Code 504 is $75,753.
What is the Median Household income in Area Code 504?
Median Household Income in Area Code 504 is $56,699.
What is Income or Wage Gap in Area Code 504?
Income or Wage Gap in Area Code 504 is 25.9%.
Women in Area Code 504 earn 74.1 cents for every dollar earned by a man.
What is Family Income Deficit in Area Code 504?
Family Income Deficit in Area Code 504 is $10,811.
Families that are below poverty line in Area Code 504 earn $10,811 less on average than the poverty threshold level.
What is Inequality or Gini Index in Area Code 504?
Inequality or Gini Index in Area Code 504 is 21.51.
What is the Total Population of Area Code 504?
Total Population of Area Code 504 is 858,154.
What is the Total Male Population of Area Code 504?
Total Male Population of Area Code 504 is 412,367.
What is the Total Female Population of Area Code 504?
Total Female Population of Area Code 504 is 445,787.
What is the Ratio of Males per 100 Females in Area Code 504?
There are 92.50 Males per 100 Females in Area Code 504.
What is the Ratio of Females per 100 Males in Area Code 504?
There are 108.10 Females per 100 Males in Area Code 504.
What is the Median Population Age in Area Code 504?
Median Population Age in Area Code 504 is 38.7 Years.
What is the Average Family Size in Area Code 504
Average Family Size in Area Code 504 is 3.4 People.
What is the Average Household Size in Area Code 504
Average Household Size in Area Code 504 is 2.5 People.
How Large is the Labor Force in Area Code 504?
There are 421,816 People in the Labor Forcein in Area Code 504.
What is the Percentage of People in the Labor Force in Area Code 504?
60.7% of People are in the Labor Force in Area Code 504.
What is the Unemployment Rate in Area Code 504?
Unemployment Rate in Area Code 504 is 7.6%.