Area Code 252 Map & Demographics
Area Code 252 Map
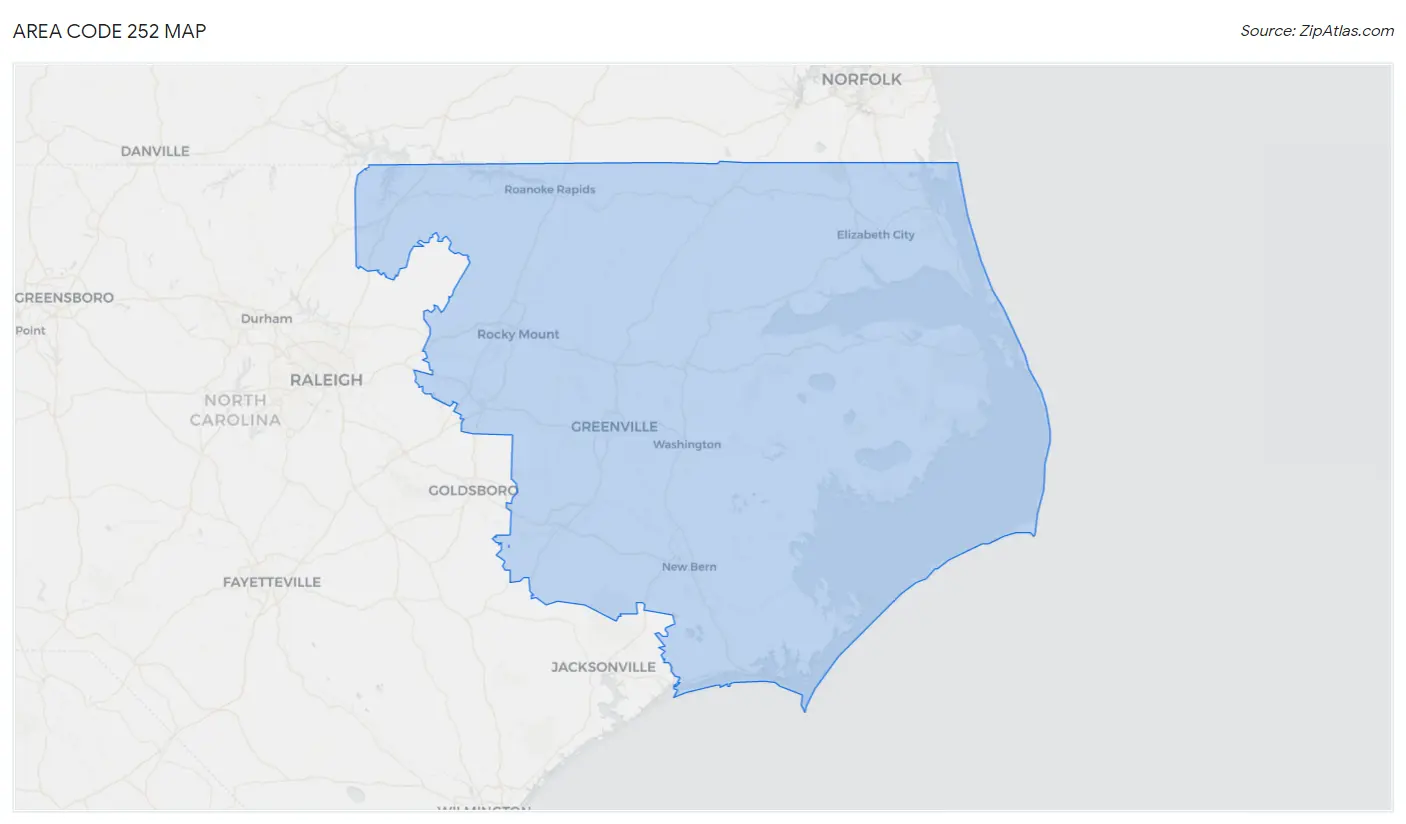
Area Code 252 Overview
$31,098
PER CAPITA INCOME
$70,855
AVG FAMILY INCOME
$55,349
AVG HOUSEHOLD INCOME
26.4%
WAGE / INCOME GAP [ % ]
73.6¢/ $1
WAGE / INCOME GAP [ $ ]
$10,270
FAMILY INCOME DEFICIT
75.19
INEQUALITY / GINI INDEX
1,062,465
TOTAL POPULATION
517,863
MALE POPULATION
544,602
FEMALE POPULATION
95.09
MALES / 100 FEMALES
105.16
FEMALES / 100 MALES
46.0
MEDIAN AGE
2.9
AVG FAMILY SIZE
2.3
AVG HOUSEHOLD SIZE
489,949
LABOR FORCE [ PEOPLE ]
56.5%
PERCENT IN LABOR FORCE
7.6%
UNEMPLOYMENT RATE
Income in Area Code 252
Income Overview in Area Code 252
Per Capita Income in Area Code 252 is $31,098, while median incomes of families and households are $70,855 and $55,349 respectively.
| Characteristic | Number | Measure |
| Per Capita Income | 1,062,465 | $31,098 |
| Median Family Income | 275,473 | $70,855 |
| Mean Family Income | 275,473 | $14,441,081 |
| Median Household Income | 434,972 | $55,349 |
| Mean Household Income | 434,972 | $12,752,997 |
| Income Deficit | 275,473 | $10,270 |
| Wage / Income Gap (%) | 1,062,465 | 26.40% |
| Wage / Income Gap ($) | 1,062,465 | 73.61¢ per $1 |
| Gini / Inequality Index | 1,062,465 | 75.19 |
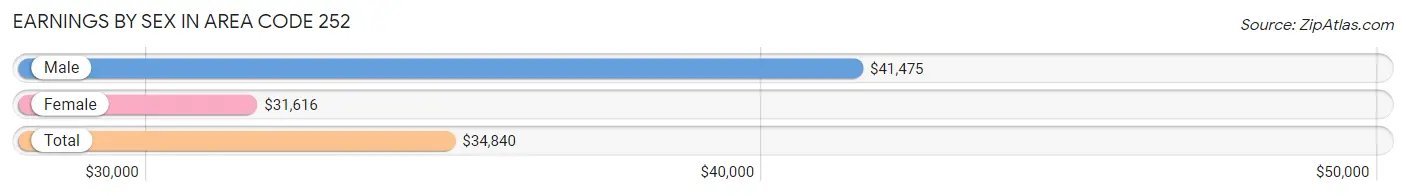
Earnings by Sex in Area Code 252
Average Earnings in Area Code 252 are $34,840, $41,475 for men and $31,616 for women, a difference of 23.8%.
| Sex | Number | Average Earnings |
| Male | 263,990 (51.1%) | $41,475 |
| Female | 253,053 (48.9%) | $31,616 |
| Total | 517,043 (100.0%) | $34,840 |
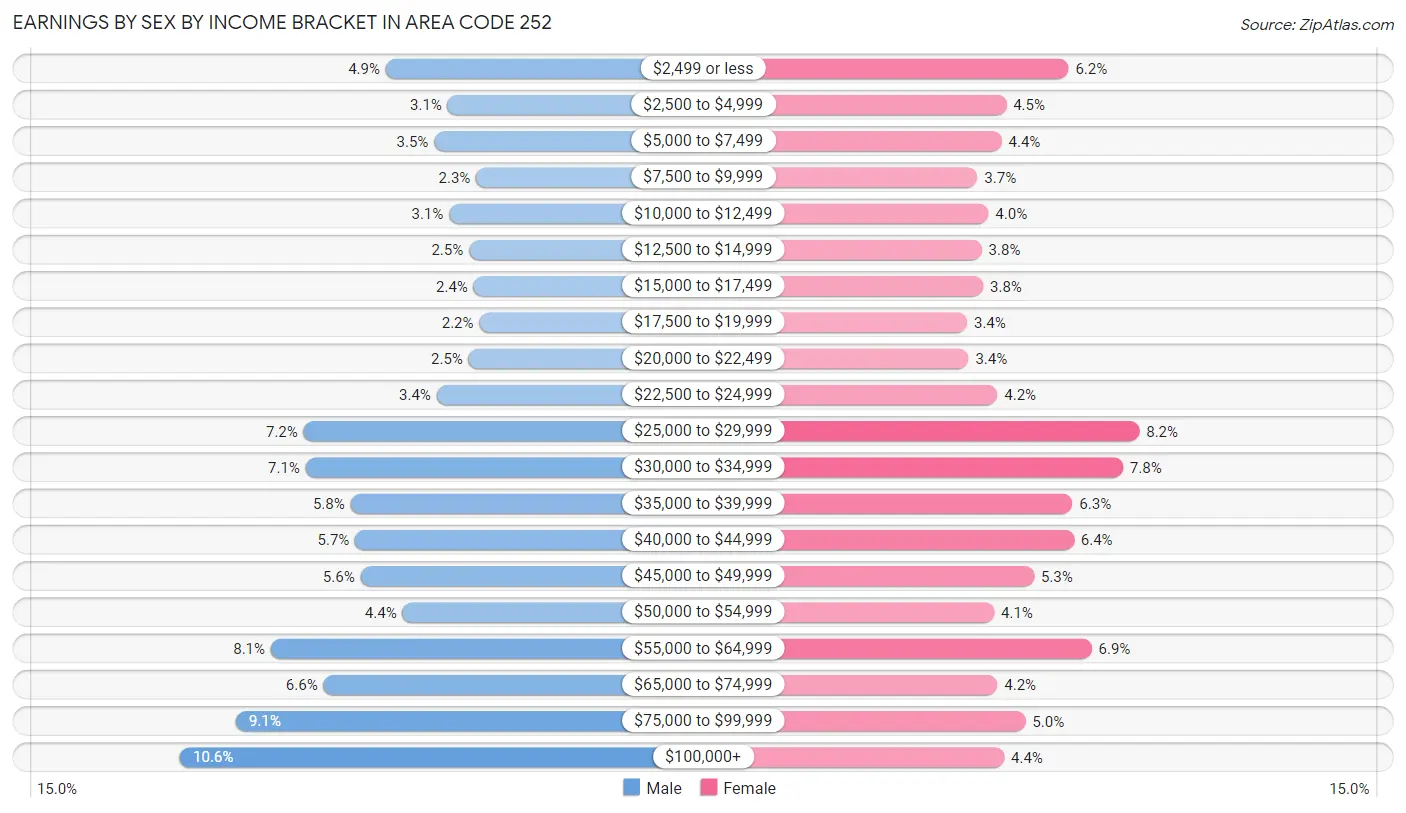
Earnings by Sex by Income Bracket in Area Code 252
The most common earnings brackets in Area Code 252 are $100,000+ for men (28,072 | 10.6%) and $25,000 to $29,999 for women (20,803 | 8.2%).
| Income | Male | Female |
| $2,499 or less | 12,806 (4.9%) | 15,770 (6.2%) |
| $2,500 to $4,999 | 8,204 (3.1%) | 11,326 (4.5%) |
| $5,000 to $7,499 | 9,226 (3.5%) | 10,996 (4.3%) |
| $7,500 to $9,999 | 6,085 (2.3%) | 9,293 (3.7%) |
| $10,000 to $12,499 | 8,104 (3.1%) | 10,060 (4.0%) |
| $12,500 to $14,999 | 6,616 (2.5%) | 9,588 (3.8%) |
| $15,000 to $17,499 | 6,270 (2.4%) | 9,699 (3.8%) |
| $17,500 to $19,999 | 5,864 (2.2%) | 8,564 (3.4%) |
| $20,000 to $22,499 | 6,640 (2.5%) | 8,661 (3.4%) |
| $22,500 to $24,999 | 9,033 (3.4%) | 10,699 (4.2%) |
| $25,000 to $29,999 | 18,899 (7.2%) | 20,803 (8.2%) |
| $30,000 to $34,999 | 18,753 (7.1%) | 19,627 (7.8%) |
| $35,000 to $39,999 | 15,429 (5.8%) | 16,036 (6.3%) |
| $40,000 to $44,999 | 15,080 (5.7%) | 16,137 (6.4%) |
| $45,000 to $49,999 | 14,665 (5.6%) | 13,311 (5.3%) |
| $50,000 to $54,999 | 11,568 (4.4%) | 10,469 (4.1%) |
| $55,000 to $64,999 | 21,321 (8.1%) | 17,405 (6.9%) |
| $65,000 to $74,999 | 17,429 (6.6%) | 10,709 (4.2%) |
| $75,000 to $99,999 | 23,926 (9.1%) | 12,712 (5.0%) |
| $100,000+ | 28,072 (10.6%) | 11,188 (4.4%) |
| Total | 263,990 (100.0%) | 253,053 (100.0%) |
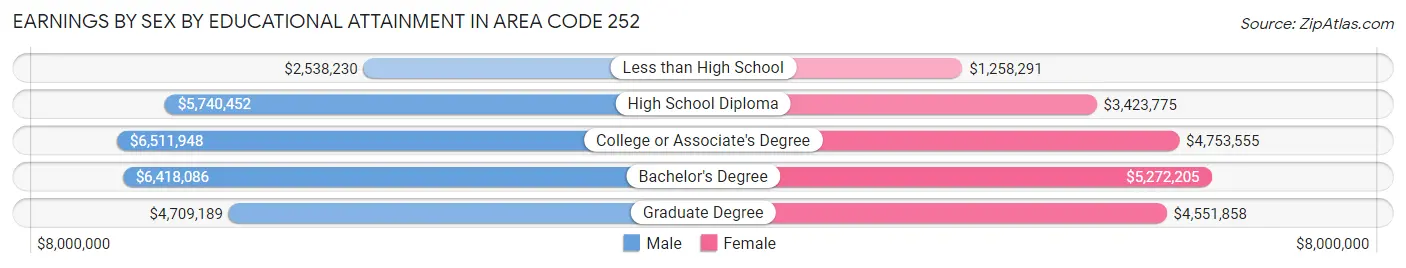
Earnings by Sex by Educational Attainment in Area Code 252
Average earnings in Area Code 252 are $7,378,289 for men and $5,506,397 for women, a difference of 25.4%. Men with an educational attainment of college or associate's degree enjoy the highest average annual earnings of $6,511,948, while those with less than high school education earn the least with $2,538,230. Women with an educational attainment of bachelor's degree earn the most with the average annual earnings of $5,272,205, while those with less than high school education have the smallest earnings of $1,258,291.
| Educational Attainment | Male Income | Female Income |
| Less than High School | $2,538,230 | $1,258,291 |
| High School Diploma | $5,740,452 | $3,423,775 |
| College or Associate's Degree | $6,511,948 | $4,753,555 |
| Bachelor's Degree | $6,418,086 | $5,272,205 |
| Graduate Degree | $4,709,189 | $4,551,858 |
| Total | $7,378,289 | $5,506,397 |
Family Income in Area Code 252
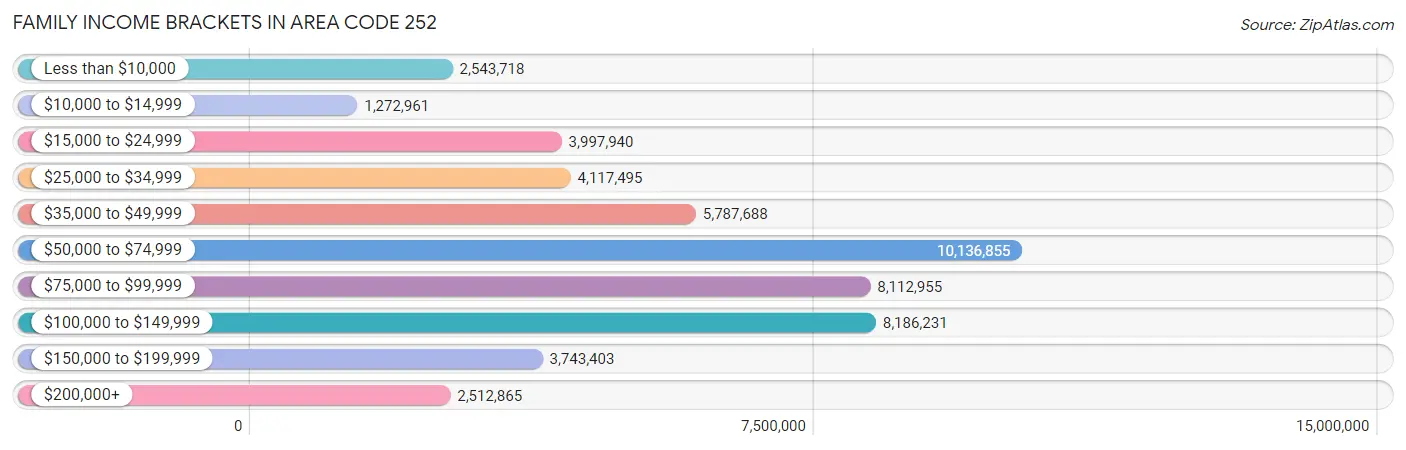
Family Income Brackets in Area Code 252
According to the Area Code 252 family income data, there are 10,136,855 families falling into the $50,000 to $74,999 income range, which is the most common income bracket and makes up 3,679.8% of all families. Conversely, the $10,000 to $14,999 income bracket is the least frequent group with only 1,272,961 families (462.1%) belonging to this category.
| Income Bracket | # Families | % Families |
| Less than $10,000 | 2,543,718 | 923.4% |
| $10,000 to $14,999 | 1,272,961 | 462.1% |
| $15,000 to $24,999 | 3,997,940 | 1,451.3% |
| $25,000 to $34,999 | 4,117,495 | 1,494.7% |
| $35,000 to $49,999 | 5,787,688 | 2,101.0% |
| $50,000 to $74,999 | 10,136,855 | 3,679.8% |
| $75,000 to $99,999 | 8,112,955 | 2,945.1% |
| $100,000 to $149,999 | 8,186,231 | 2,971.7% |
| $150,000 to $199,999 | 3,743,403 | 1,358.9% |
| $200,000+ | 2,512,865 | 912.2% |
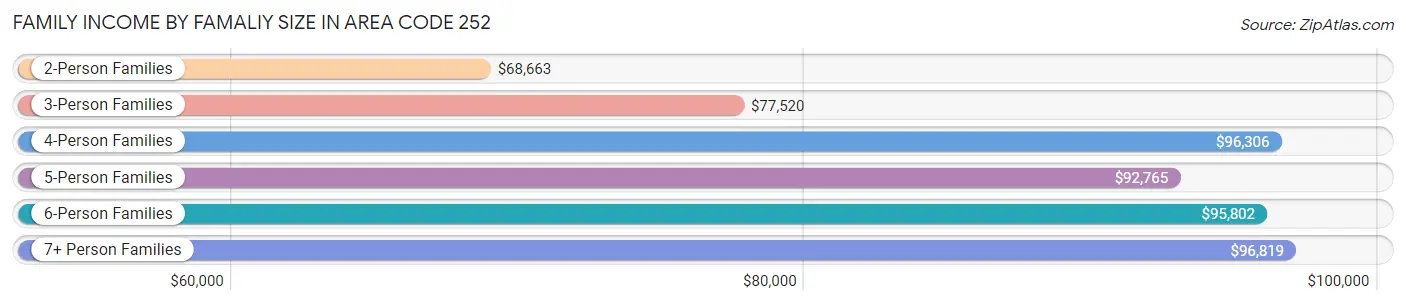
Family Income by Famaliy Size in Area Code 252
7+ person families (2,900 | 1.1%) account for the highest median family income in Area Code 252 with $96,819 per family, while 2-person families (145,797 | 52.9%) have the highest median income of $34,331 per family member.
| Income Bracket | # Families | Median Income |
| 2-Person Families | 145,797 (52.9%) | $68,663 |
| 3-Person Families | 62,165 (22.6%) | $77,520 |
| 4-Person Families | 41,067 (14.9%) | $96,306 |
| 5-Person Families | 17,779 (6.5%) | $92,765 |
| 6-Person Families | 5,765 (2.1%) | $95,802 |
| 7+ Person Families | 2,900 (1.1%) | $96,819 |
| Total | 275,473 (100.0%) | $70,855 |
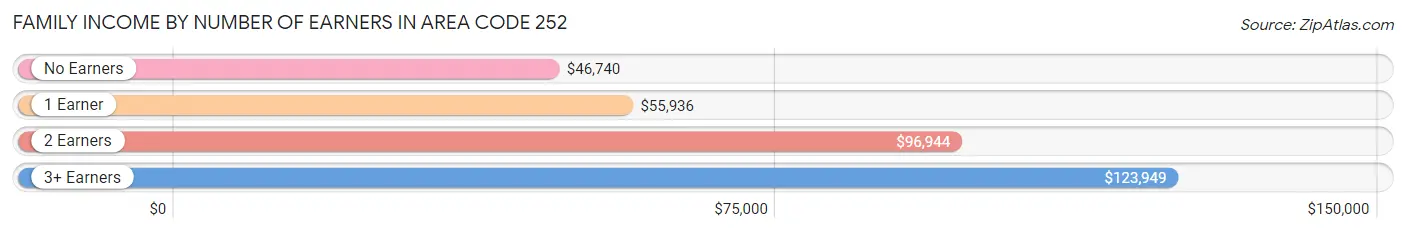
Family Income by Number of Earners in Area Code 252
The median family income in Area Code 252 is $70,855, with families comprising 3+ earners (22,694) having the highest median family income of $123,949, while families with no earners (54,894) have the lowest median family income of $46,740, accounting for 8.2% and 19.9% of families, respectively.
| Number of Earners | # Families | Median Income |
| No Earners | 54,894 (19.9%) | $46,740 |
| 1 Earner | 95,179 (34.5%) | $55,936 |
| 2 Earners | 102,706 (37.3%) | $96,944 |
| 3+ Earners | 22,694 (8.2%) | $123,949 |
| Total | 275,473 (100.0%) | $70,855 |
Household Income in Area Code 252
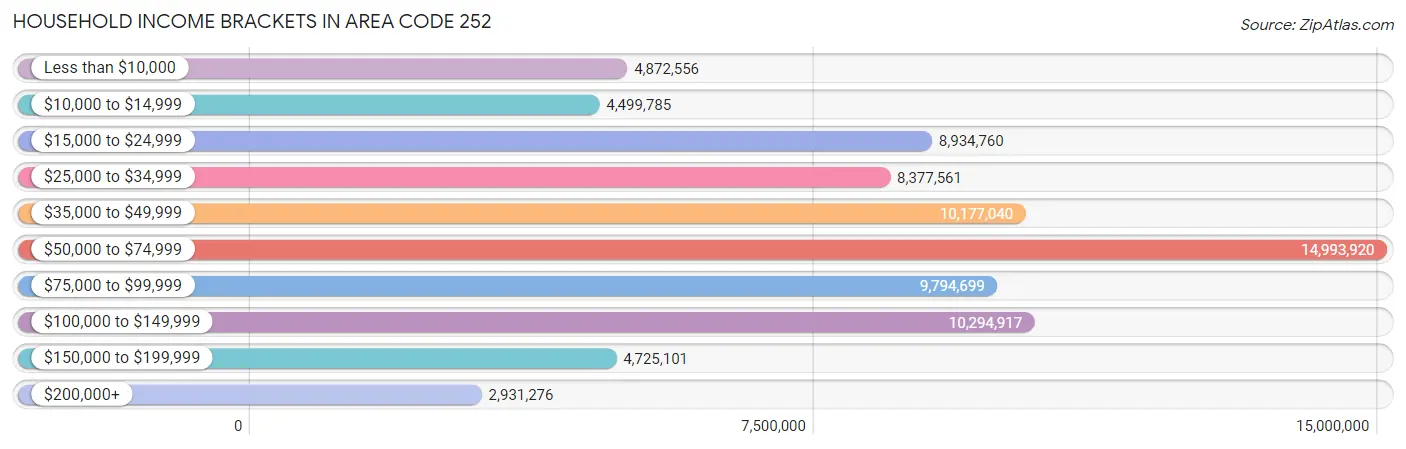
Household Income Brackets in Area Code 252
With 14,993,920 households falling in the category, the $50,000 to $74,999 income range is the most frequent in Area Code 252, accounting for 3,447.1% of all households. In contrast, only 2,931,276 households (673.9%) fall into the $200,000+ income bracket, making it the least populous group.
| Income Bracket | # Households | % Households |
| Less than $10,000 | 4,872,556 | 1,120.2% |
| $10,000 to $14,999 | 4,499,785 | 1,034.5% |
| $15,000 to $24,999 | 8,934,760 | 2,054.1% |
| $25,000 to $34,999 | 8,377,561 | 1,926.0% |
| $35,000 to $49,999 | 10,177,040 | 2,339.7% |
| $50,000 to $74,999 | 14,993,920 | 3,447.1% |
| $75,000 to $99,999 | 9,794,699 | 2,251.8% |
| $100,000 to $149,999 | 10,294,917 | 2,366.8% |
| $150,000 to $199,999 | 4,725,101 | 1,086.3% |
| $200,000+ | 2,931,276 | 673.9% |
Household Income by Householder Age in Area Code 252
The median household income in Area Code 252 is $55,349, with the highest median household income of $69,636 found in the 45 to 64 years age bracket for the primary householder. A total of 158,941 households (36.5%) fall into this category. Meanwhile, the 65+ years age bracket for the primary householder has the lowest median household income of $46,667, with 138,310 households (31.8%) in this group.
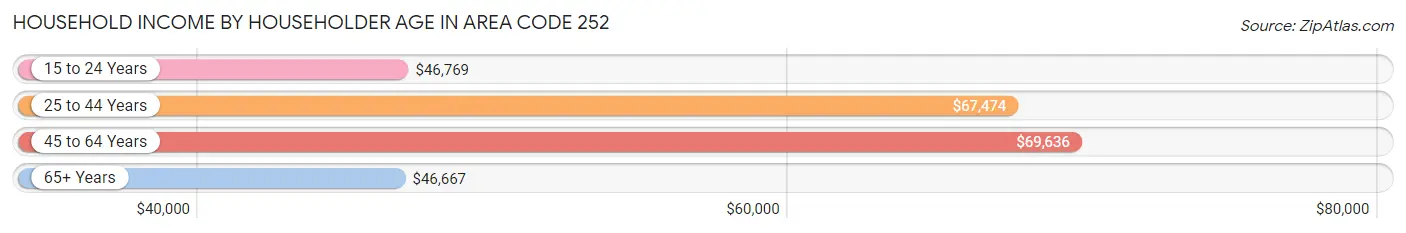
| Income Bracket | # Households | Median Income |
| 15 to 24 Years | 19,779 (4.5%) | $46,769 |
| 25 to 44 Years | 117,942 (27.1%) | $67,474 |
| 45 to 64 Years | 158,941 (36.5%) | $69,636 |
| 65+ Years | 138,310 (31.8%) | $46,667 |
| Total | 434,972 (100.0%) | $55,349 |
Poverty in Area Code 252
Income Below Poverty by Sex and Age in Area Code 252
With 15.6% poverty level for males and 18.8% for females among the residents of Area Code 252, under 5 year old males and 18 to 24 year old females are the most vulnerable to poverty, with 8,151 males (28.5%) and 12,954 females (28.9%) in their respective age groups living below the poverty level.
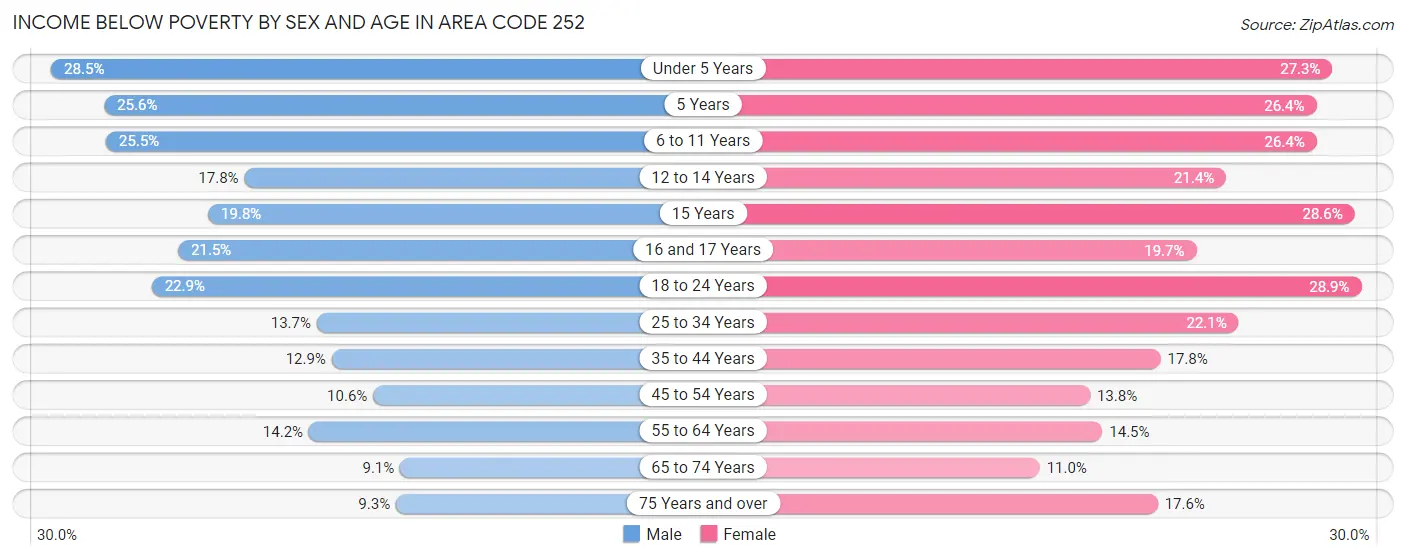
| Age Bracket | Male | Female |
| Under 5 Years | 8,151 (28.5%) | 7,232 (27.3%) |
| 5 Years | 1,495 (25.6%) | 1,394 (26.4%) |
| 6 to 11 Years | 9,193 (25.5%) | 9,709 (26.4%) |
| 12 to 14 Years | 3,807 (17.8%) | 3,815 (21.4%) |
| 15 Years | 1,291 (19.8%) | 1,921 (28.5%) |
| 16 and 17 Years | 2,880 (21.5%) | 2,508 (19.7%) |
| 18 to 24 Years | 10,356 (22.9%) | 12,954 (28.9%) |
| 25 to 34 Years | 8,292 (13.7%) | 13,930 (22.1%) |
| 35 to 44 Years | 7,222 (12.9%) | 10,775 (17.7%) |
| 45 to 54 Years | 6,396 (10.6%) | 8,971 (13.8%) |
| 55 to 64 Years | 9,920 (14.2%) | 11,422 (14.5%) |
| 65 to 74 Years | 5,328 (9.1%) | 7,487 (11.0%) |
| 75 Years and over | 3,054 (9.3%) | 8,372 (17.6%) |
| Total | 77,385 (15.6%) | 100,490 (18.8%) |
Income Above Poverty by Sex and Age in Area Code 252
According to the poverty statistics in Area Code 252, males aged 65 to 74 years and females aged 65 to 74 years are the age groups that are most secure financially, with 90.9% of males and 89.0% of females in these age groups living above the poverty line.
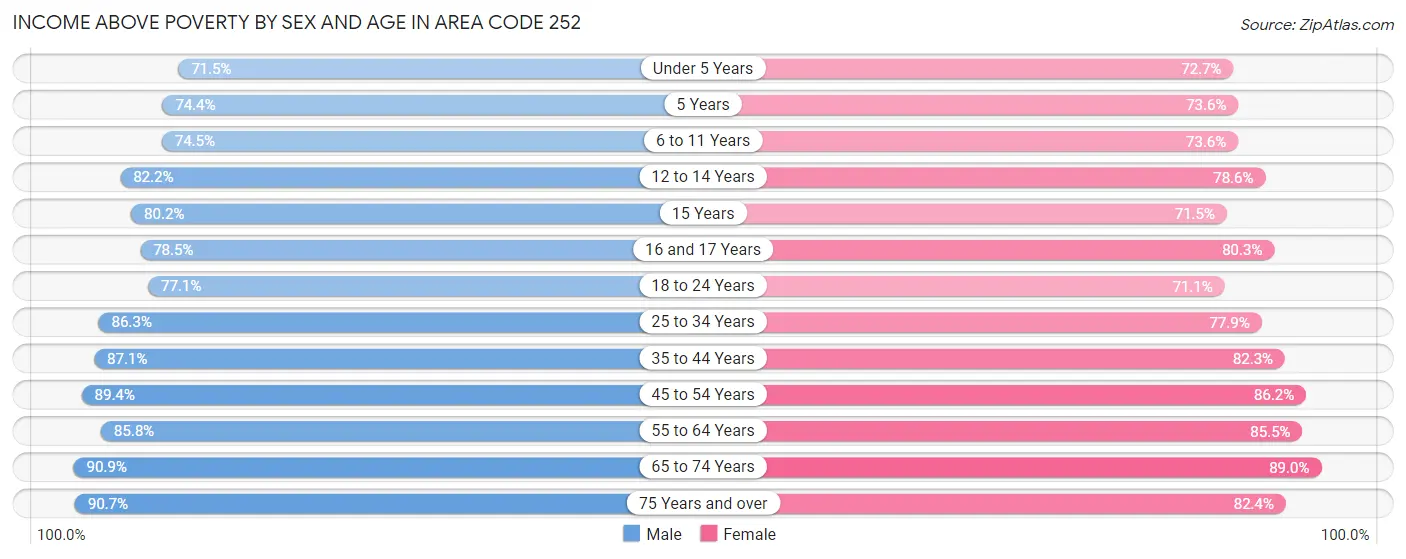
| Age Bracket | Male | Female |
| Under 5 Years | 20,429 (71.5%) | 19,247 (72.7%) |
| 5 Years | 4,351 (74.4%) | 3,882 (73.6%) |
| 6 to 11 Years | 26,900 (74.5%) | 27,006 (73.6%) |
| 12 to 14 Years | 17,625 (82.2%) | 14,010 (78.6%) |
| 15 Years | 5,232 (80.2%) | 4,807 (71.5%) |
| 16 and 17 Years | 10,539 (78.5%) | 10,198 (80.3%) |
| 18 to 24 Years | 34,829 (77.1%) | 31,818 (71.1%) |
| 25 to 34 Years | 52,097 (86.3%) | 49,126 (77.9%) |
| 35 to 44 Years | 48,783 (87.1%) | 49,932 (82.3%) |
| 45 to 54 Years | 54,012 (89.4%) | 55,921 (86.2%) |
| 55 to 64 Years | 60,072 (85.8%) | 67,285 (85.5%) |
| 65 to 74 Years | 53,316 (90.9%) | 60,433 (89.0%) |
| 75 Years and over | 29,705 (90.7%) | 39,219 (82.4%) |
| Total | 417,890 (84.4%) | 432,884 (81.2%) |
Income Below Poverty Among Married-Couple Families in Area Code 252
The poverty statistics for married-couple families in Area Code 252 show that 5.4% or 10,210 of the total 188,499 families live below the poverty line. Families with 5 or more children have the highest poverty rate of 25.9%, comprising of 244 families. On the other hand, families with no children have the lowest poverty rate of 4.3%, which includes 5,354 families.
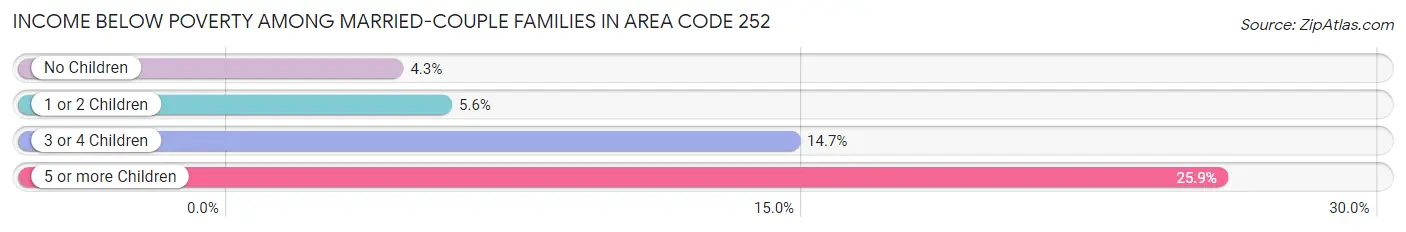
| Children | Above Poverty | Below Poverty |
| No Children | 118,718 (95.7%) | 5,354 (4.3%) |
| 1 or 2 Children | 48,906 (94.4%) | 2,897 (5.6%) |
| 3 or 4 Children | 9,966 (85.3%) | 1,715 (14.7%) |
| 5 or more Children | 699 (74.1%) | 244 (25.9%) |
| Total | 178,289 (94.6%) | 10,210 (5.4%) |
Income Below Poverty Among Single-Parent Households in Area Code 252
According to the poverty data in Area Code 252, 19.2% or 3,993 single-father households and 30.8% or 20,373 single-mother households are living below the poverty line. Among single-father households, those with 3 or 4 children have the highest poverty rate, with 508 households (38.4%) experiencing poverty. Likewise, among single-mother households, those with 5 or more children have the highest poverty rate, with 465 households (86.1%) falling below the poverty line.
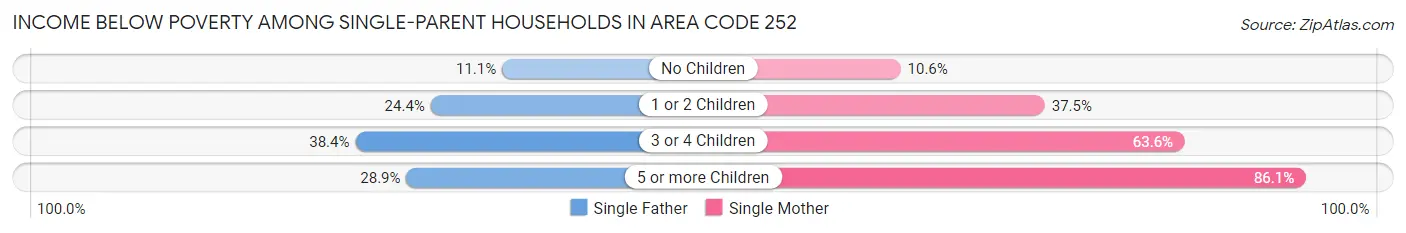
| Children | Single Father | Single Mother |
| No Children | 1,058 (11.1%) | 2,560 (10.6%) |
| 1 or 2 Children | 2,401 (24.4%) | 12,943 (37.5%) |
| 3 or 4 Children | 508 (38.4%) | 4,405 (63.5%) |
| 5 or more Children | 26 (28.9%) | 465 (86.1%) |
| Total | 3,993 (19.2%) | 20,373 (30.8%) |
Income Below Poverty Among Married-Couple vs Single-Parent Households in Area Code 252
The poverty data for Area Code 252 shows that 10,210 of the married-couple family households (5.4%) and 24,366 of the single-parent households (28.0%) are living below the poverty level. Within the married-couple family households, those with 5 or more children have the highest poverty rate, with 244 households (25.9%) falling below the poverty line. Among the single-parent households, those with 5 or more children have the highest poverty rate, with 491 household (77.9%) living below poverty.
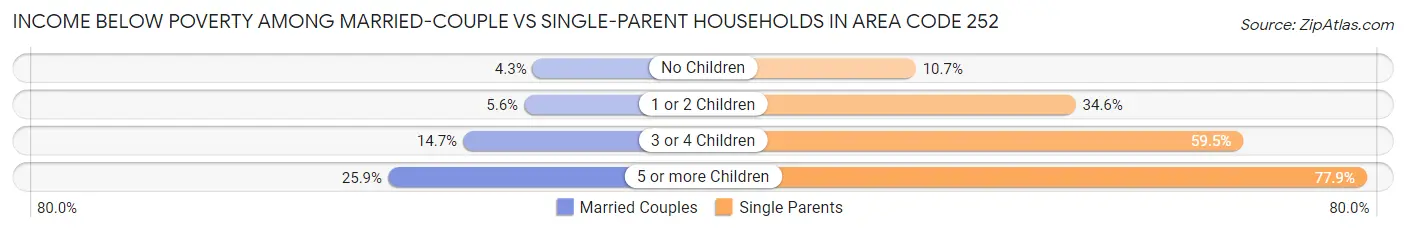
| Children | Married-Couple Families | Single-Parent Households |
| No Children | 5,354 (4.3%) | 3,618 (10.7%) |
| 1 or 2 Children | 2,897 (5.6%) | 15,344 (34.6%) |
| 3 or 4 Children | 1,715 (14.7%) | 4,913 (59.5%) |
| 5 or more Children | 244 (25.9%) | 491 (77.9%) |
| Total | 10,210 (5.4%) | 24,366 (28.0%) |
Race in Area Code 252
The most populous races in Area Code 252 are White / Caucasian (607,732 | 57.2%), Black / African American (353,570 | 33.3%), and Hispanic or Latino (76,615 | 7.2%).
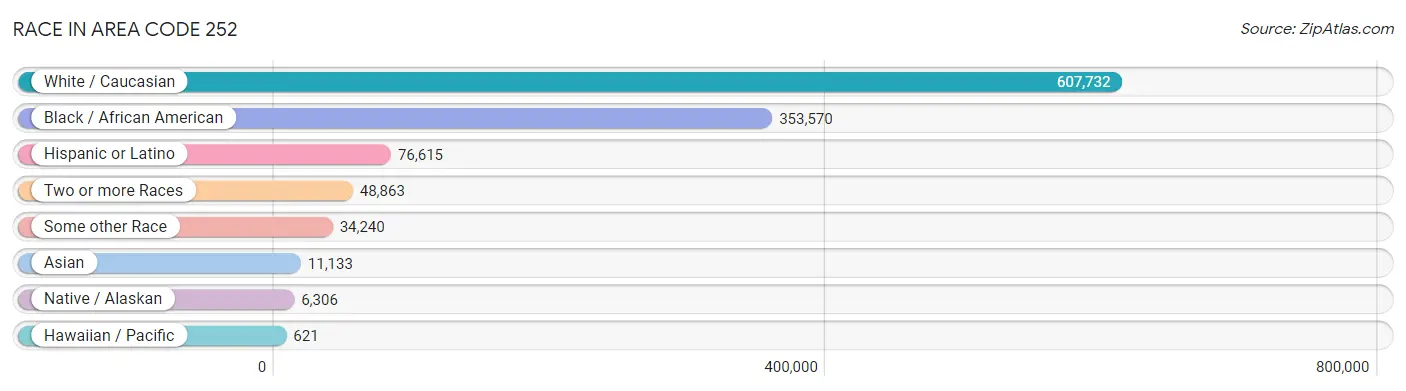
| Race | # Population | % Population |
| Asian | 11,133 | 1.1% |
| Black / African American | 353,570 | 33.3% |
| Hawaiian / Pacific | 621 | 0.1% |
| Hispanic or Latino | 76,615 | 7.2% |
| Native / Alaskan | 6,306 | 0.6% |
| White / Caucasian | 607,732 | 57.2% |
| Two or more Races | 48,863 | 4.6% |
| Some other Race | 34,240 | 3.2% |
| Total | 1,062,465 | 100.0% |
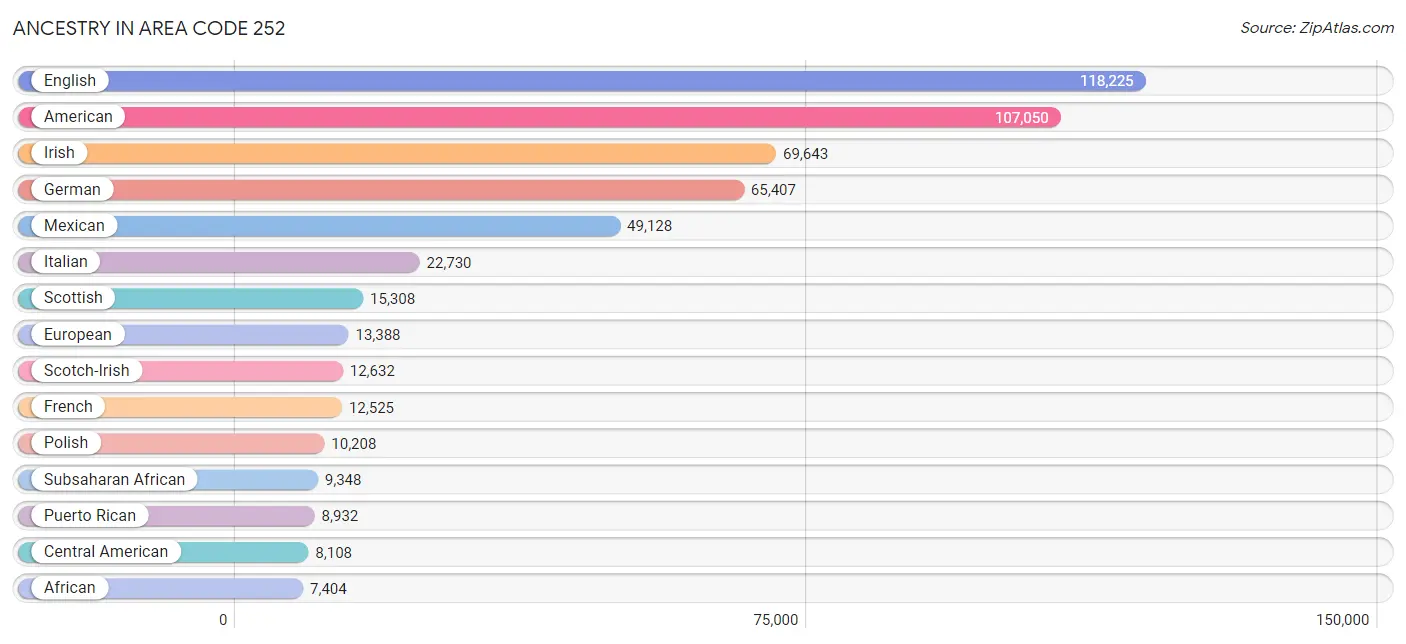
Ancestry in Area Code 252
The most populous ancestries reported in Area Code 252 are English (118,225 | 11.1%), American (107,050 | 10.1%), Irish (69,643 | 6.6%), German (65,407 | 6.2%), and Mexican (49,128 | 4.6%), together accounting for 38.5% of all Area Code 252 residents.
| Ancestry | # Population | % Population |
| African | 7,404 | 0.7% |
| Alaska Native | 4 | 0.0% |
| Alaskan Athabascan | 14 | 0.0% |
| Albanian | 78 | 0.0% |
| Aleut | 6 | 0.0% |
| American | 107,050 | 10.1% |
| Apache | 151 | 0.0% |
| Arab | 2,964 | 0.3% |
| Argentinean | 285 | 0.0% |
| Armenian | 251 | 0.0% |
| Australian | 151 | 0.0% |
| Austrian | 683 | 0.1% |
| Bahamian | 90 | 0.0% |
| Bangladeshi | 129 | 0.0% |
| Barbadian | 95 | 0.0% |
| Basque | 12 | 0.0% |
| Belgian | 164 | 0.0% |
| Belizean | 17 | 0.0% |
| Bermudan | 16 | 0.0% |
| Bhutanese | 2,246 | 0.2% |
| Blackfeet | 639 | 0.1% |
| Bolivian | 70 | 0.0% |
| Brazilian | 249 | 0.0% |
| British | 4,688 | 0.4% |
| British West Indian | 56 | 0.0% |
| Bulgarian | 64 | 0.0% |
| Burmese | 1,777 | 0.2% |
| Cajun | 22 | 0.0% |
| Cambodian | 32 | 0.0% |
| Canadian | 891 | 0.1% |
| Celtic | 134 | 0.0% |
| Central American | 8,108 | 0.8% |
| Central American Indian | 485 | 0.1% |
| Cherokee | 4,178 | 0.4% |
| Cheyenne | 18 | 0.0% |
| Chickasaw | 32 | 0.0% |
| Chilean | 390 | 0.0% |
| Chinese | 74 | 0.0% |
| Chippewa | 62 | 0.0% |
| Choctaw | 24 | 0.0% |
| Colombian | 1,448 | 0.1% |
| Comanche | 8 | 0.0% |
| Costa Rican | 178 | 0.0% |
| Creek | 101 | 0.0% |
| Croatian | 387 | 0.0% |
| Crow | 2 | 0.0% |
| Cuban | 1,993 | 0.2% |
| Czech | 873 | 0.1% |
| Czechoslovakian | 333 | 0.0% |
| Danish | 1,040 | 0.1% |
| Delaware | 64 | 0.0% |
| Dominican | 991 | 0.1% |
| Dutch | 5,094 | 0.5% |
| Dutch West Indian | 34 | 0.0% |
| Eastern European | 1,652 | 0.2% |
| Ecuadorian | 436 | 0.0% |
| Egyptian | 146 | 0.0% |
| English | 118,225 | 11.1% |
| Estonian | 11 | 0.0% |
| Ethiopian | 46 | 0.0% |
| European | 13,388 | 1.3% |
| Fijian | 110 | 0.0% |
| Filipino | 55 | 0.0% |
| Finnish | 485 | 0.1% |
| French | 12,525 | 1.2% |
| French American Indian | 38 | 0.0% |
| French Canadian | 2,460 | 0.2% |
| German | 65,407 | 6.2% |
| Ghanaian | 96 | 0.0% |
| Greek | 1,446 | 0.1% |
| Guamanian / Chamorro | 370 | 0.0% |
| Guatemalan | 3,347 | 0.3% |
| Guyanese | 75 | 0.0% |
| Haitian | 1,010 | 0.1% |
| Honduran | 1,805 | 0.2% |
| Hungarian | 1,974 | 0.2% |
| Icelander | 26 | 0.0% |
| Indian (Asian) | 2,258 | 0.2% |
| Indonesian | 988 | 0.1% |
| Inupiat | 87 | 0.0% |
| Iranian | 37 | 0.0% |
| Iraqi | 40 | 0.0% |
| Irish | 69,643 | 6.6% |
| Iroquois | 224 | 0.0% |
| Israeli | 43 | 0.0% |
| Italian | 22,730 | 2.1% |
| Jamaican | 2,208 | 0.2% |
| Japanese | 298 | 0.0% |
| Jordanian | 74 | 0.0% |
| Kenyan | 252 | 0.0% |
| Korean | 3,744 | 0.4% |
| Laotian | 129 | 0.0% |
| Latvian | 19 | 0.0% |
| Lebanese | 768 | 0.1% |
| Liberian | 92 | 0.0% |
| Lithuanian | 490 | 0.1% |
| Lumbee | 1,589 | 0.2% |
| Luxembourger | 78 | 0.0% |
| Macedonian | 7 | 0.0% |
| Malaysian | 59 | 0.0% |
| Maltese | 21 | 0.0% |
| Mexican | 49,128 | 4.6% |
| Mexican American Indian | 297 | 0.0% |
| Mongolian | 54 | 0.0% |
| Moroccan | 109 | 0.0% |
| Native Hawaiian | 967 | 0.1% |
| Navajo | 205 | 0.0% |
| Nepalese | 23 | 0.0% |
| New Zealander | 24 | 0.0% |
| Nicaraguan | 218 | 0.0% |
| Nigerian | 944 | 0.1% |
| Northern European | 791 | 0.1% |
| Norwegian | 3,119 | 0.3% |
| Osage | 33 | 0.0% |
| Ottawa | 8 | 0.0% |
| Pakistani | 453 | 0.0% |
| Palestinian | 851 | 0.1% |
| Panamanian | 175 | 0.0% |
| Paraguayan | 86 | 0.0% |
| Pennsylvania German | 125 | 0.0% |
| Peruvian | 1,201 | 0.1% |
| Polish | 10,208 | 1.0% |
| Portuguese | 1,322 | 0.1% |
| Potawatomi | 92 | 0.0% |
| Pueblo | 2 | 0.0% |
| Puerto Rican | 8,932 | 0.8% |
| Romanian | 370 | 0.0% |
| Russian | 1,822 | 0.2% |
| Salvadoran | 2,244 | 0.2% |
| Samoan | 565 | 0.1% |
| Scandinavian | 1,356 | 0.1% |
| Scotch-Irish | 12,632 | 1.2% |
| Scottish | 15,308 | 1.4% |
| Seminole | 4 | 0.0% |
| Serbian | 147 | 0.0% |
| Sioux | 167 | 0.0% |
| Slavic | 292 | 0.0% |
| Slovak | 884 | 0.1% |
| Slovene | 137 | 0.0% |
| Somali | 11 | 0.0% |
| South African | 59 | 0.0% |
| South American | 4,629 | 0.4% |
| South American Indian | 83 | 0.0% |
| Spaniard | 458 | 0.0% |
| Spanish | 291 | 0.0% |
| Spanish American | 32 | 0.0% |
| Spanish American Indian | 19 | 0.0% |
| Sri Lankan | 1,990 | 0.2% |
| Subsaharan African | 9,348 | 0.9% |
| Sudanese | 29 | 0.0% |
| Swedish | 3,322 | 0.3% |
| Swiss | 830 | 0.1% |
| Syrian | 97 | 0.0% |
| Thai | 2,193 | 0.2% |
| Tlingit-Haida | 170 | 0.0% |
| Trinidadian and Tobagonian | 235 | 0.0% |
| Tsimshian | 22 | 0.0% |
| Turkish | 299 | 0.0% |
| U.S. Virgin Islander | 69 | 0.0% |
| Ugandan | 95 | 0.0% |
| Ukrainian | 1,269 | 0.1% |
| Uruguayan | 5 | 0.0% |
| Ute | 10 | 0.0% |
| Venezuelan | 663 | 0.1% |
| Welsh | 3,391 | 0.3% |
| West Indian | 773 | 0.1% |
| Yugoslavian | 115 | 0.0% |
| Yuman | 4 | 0.0% |
| Yup'ik | 3 | 0.0% | View All 169 Rows |
Immigrants in Area Code 252
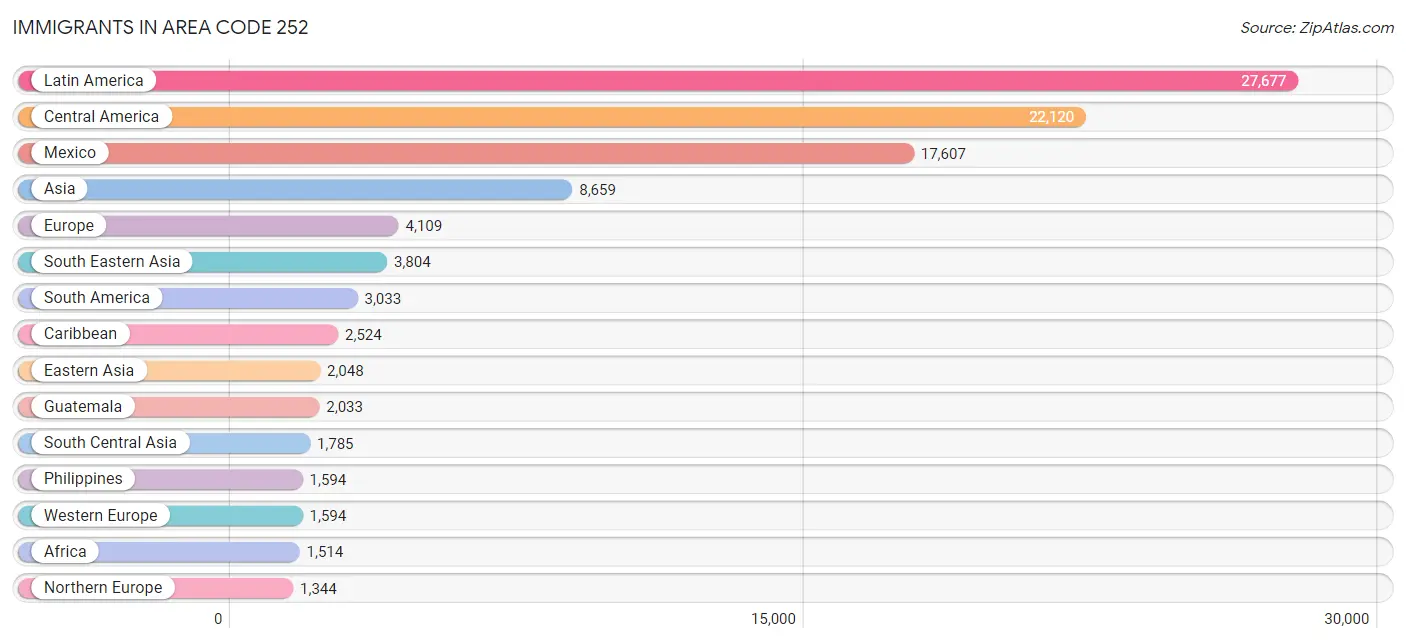
The most numerous immigrant groups reported in Area Code 252 came from Latin America (27,677 | 2.6%), Central America (22,120 | 2.1%), Mexico (17,607 | 1.7%), Asia (8,659 | 0.8%), and Europe (4,109 | 0.4%), together accounting for 7.5% of all Area Code 252 residents.
| Immigration Origin | # Population | % Population |
| Afghanistan | 42 | 0.0% |
| Africa | 1,514 | 0.1% |
| Albania | 18 | 0.0% |
| Argentina | 271 | 0.0% |
| Asia | 8,659 | 0.8% |
| Australia | 113 | 0.0% |
| Austria | 4 | 0.0% |
| Azores | 20 | 0.0% |
| Bahamas | 85 | 0.0% |
| Bangladesh | 12 | 0.0% |
| Barbados | 17 | 0.0% |
| Belgium | 27 | 0.0% |
| Belize | 16 | 0.0% |
| Bolivia | 39 | 0.0% |
| Bosnia and Herzegovina | 46 | 0.0% |
| Brazil | 174 | 0.0% |
| Bulgaria | 39 | 0.0% |
| Cambodia | 103 | 0.0% |
| Cameroon | 9 | 0.0% |
| Canada | 1,133 | 0.1% |
| Caribbean | 2,524 | 0.2% |
| Central America | 22,120 | 2.1% |
| Chile | 350 | 0.0% |
| China | 827 | 0.1% |
| Colombia | 905 | 0.1% |
| Costa Rica | 93 | 0.0% |
| Croatia | 36 | 0.0% |
| Cuba | 614 | 0.1% |
| Czechoslovakia | 45 | 0.0% |
| Denmark | 32 | 0.0% |
| Dominican Republic | 444 | 0.0% |
| Eastern Africa | 332 | 0.0% |
| Eastern Asia | 2,048 | 0.2% |
| Eastern Europe | 1,001 | 0.1% |
| Ecuador | 108 | 0.0% |
| Egypt | 121 | 0.0% |
| El Salvador | 1,116 | 0.1% |
| England | 542 | 0.1% |
| Ethiopia | 40 | 0.0% |
| Europe | 4,109 | 0.4% |
| France | 181 | 0.0% |
| Germany | 1,250 | 0.1% |
| Ghana | 144 | 0.0% |
| Greece | 32 | 0.0% |
| Guatemala | 2,033 | 0.2% |
| Guyana | 15 | 0.0% |
| Haiti | 137 | 0.0% |
| Honduras | 1,006 | 0.1% |
| Hong Kong | 52 | 0.0% |
| Hungary | 87 | 0.0% |
| India | 1,281 | 0.1% |
| Indonesia | 2 | 0.0% |
| Iran | 27 | 0.0% |
| Iraq | 87 | 0.0% |
| Ireland | 29 | 0.0% |
| Israel | 57 | 0.0% |
| Italy | 71 | 0.0% |
| Jamaica | 957 | 0.1% |
| Japan | 707 | 0.1% |
| Jordan | 97 | 0.0% |
| Kazakhstan | 8 | 0.0% |
| Kenya | 206 | 0.0% |
| Korea | 514 | 0.1% |
| Laos | 111 | 0.0% |
| Latin America | 27,677 | 2.6% |
| Latvia | 17 | 0.0% |
| Lebanon | 36 | 0.0% |
| Liberia | 95 | 0.0% |
| Malaysia | 105 | 0.0% |
| Mexico | 17,607 | 1.7% |
| Middle Africa | 85 | 0.0% |
| Nepal | 12 | 0.0% |
| Netherlands | 83 | 0.0% |
| Nicaragua | 134 | 0.0% |
| Nigeria | 350 | 0.0% |
| Northern Africa | 159 | 0.0% |
| Northern Europe | 1,344 | 0.1% |
| Norway | 18 | 0.0% |
| Oceania | 243 | 0.0% |
| Pakistan | 355 | 0.0% |
| Panama | 87 | 0.0% |
| Peru | 576 | 0.1% |
| Philippines | 1,594 | 0.2% |
| Poland | 191 | 0.0% |
| Portugal | 31 | 0.0% |
| Romania | 105 | 0.0% |
| Russia | 144 | 0.0% |
| Saudi Arabia | 11 | 0.0% |
| Scotland | 100 | 0.0% |
| Sierra Leone | 9 | 0.0% |
| South Africa | 96 | 0.0% |
| South America | 3,033 | 0.3% |
| South Central Asia | 1,785 | 0.2% |
| South Eastern Asia | 3,804 | 0.4% |
| Southern Europe | 170 | 0.0% |
| Spain | 16 | 0.0% |
| Sri Lanka | 48 | 0.0% |
| Sudan | 37 | 0.0% |
| Sweden | 11 | 0.0% |
| Switzerland | 19 | 0.0% |
| Syria | 4 | 0.0% |
| Taiwan | 86 | 0.0% |
| Thailand | 284 | 0.0% |
| Trinidad and Tobago | 221 | 0.0% |
| Turkey | 222 | 0.0% |
| Uganda | 37 | 0.0% |
| Ukraine | 220 | 0.0% |
| Uruguay | 26 | 0.0% |
| Venezuela | 447 | 0.0% |
| Vietnam | 1,020 | 0.1% |
| West Indies | 15 | 0.0% |
| Western Africa | 620 | 0.1% |
| Western Asia | 967 | 0.1% |
| Western Europe | 1,594 | 0.2% |
| Yemen | 417 | 0.0% |
| Zaire | 76 | 0.0% |
| Zimbabwe | 41 | 0.0% | View All 117 Rows |
Sex and Age in Area Code 252
Sex and Age in Area Code 252
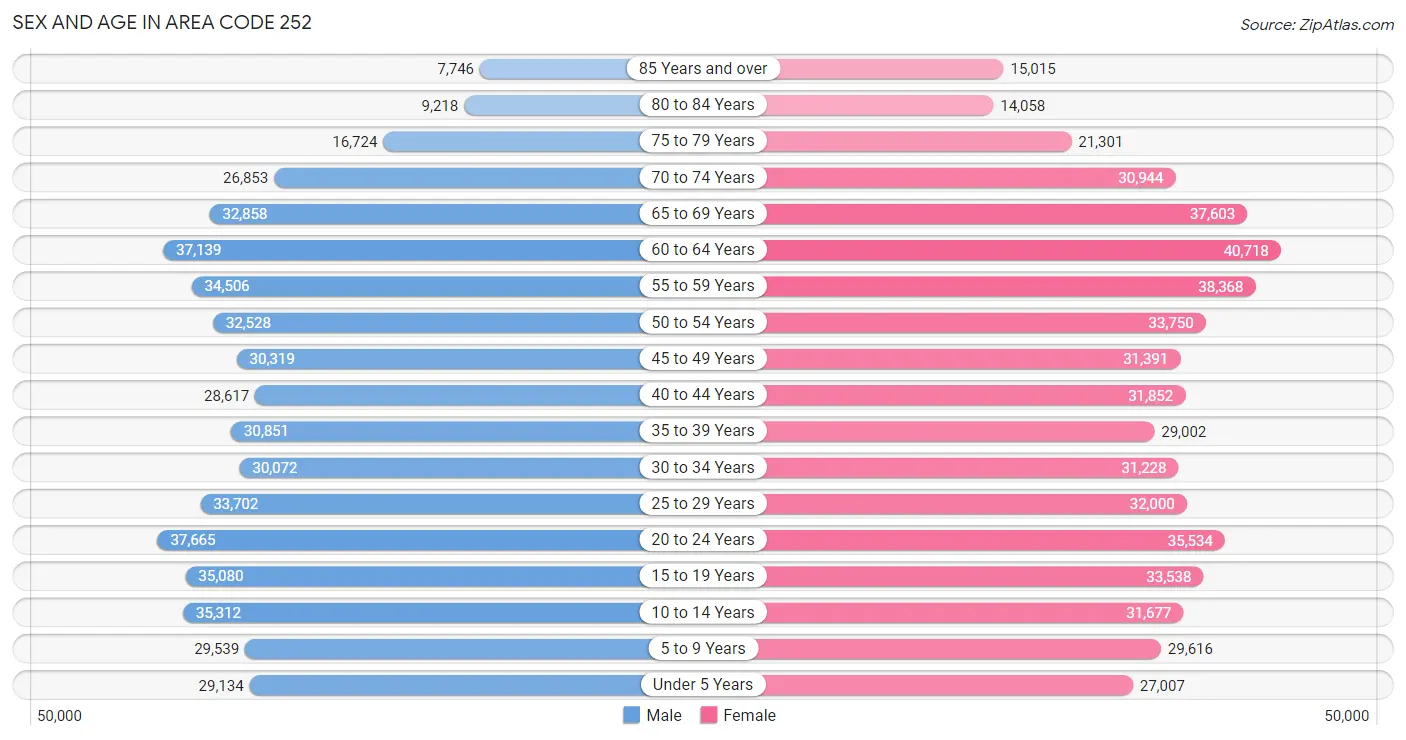
The most populous age groups in Area Code 252 are 20 to 24 Years (37,665 | 7.3%) for men and 60 to 64 Years (40,718 | 7.5%) for women.
| Age Bracket | Male | Female |
| Under 5 Years | 29,134 (5.6%) | 27,007 (5.0%) |
| 5 to 9 Years | 29,539 (5.7%) | 29,616 (5.4%) |
| 10 to 14 Years | 35,312 (6.8%) | 31,677 (5.8%) |
| 15 to 19 Years | 35,080 (6.8%) | 33,538 (6.2%) |
| 20 to 24 Years | 37,665 (7.3%) | 35,534 (6.5%) |
| 25 to 29 Years | 33,702 (6.5%) | 32,000 (5.9%) |
| 30 to 34 Years | 30,072 (5.8%) | 31,228 (5.7%) |
| 35 to 39 Years | 30,851 (6.0%) | 29,002 (5.3%) |
| 40 to 44 Years | 28,617 (5.5%) | 31,852 (5.9%) |
| 45 to 49 Years | 30,319 (5.9%) | 31,391 (5.8%) |
| 50 to 54 Years | 32,528 (6.3%) | 33,750 (6.2%) |
| 55 to 59 Years | 34,506 (6.7%) | 38,368 (7.0%) |
| 60 to 64 Years | 37,139 (7.2%) | 40,718 (7.5%) |
| 65 to 69 Years | 32,858 (6.3%) | 37,603 (6.9%) |
| 70 to 74 Years | 26,853 (5.2%) | 30,944 (5.7%) |
| 75 to 79 Years | 16,724 (3.2%) | 21,301 (3.9%) |
| 80 to 84 Years | 9,218 (1.8%) | 14,058 (2.6%) |
| 85 Years and over | 7,746 (1.5%) | 15,015 (2.8%) |
| Total | 517,863 (100.0%) | 544,602 (100.0%) |
Families and Households in Area Code 252
Median Family Size in Area Code 252
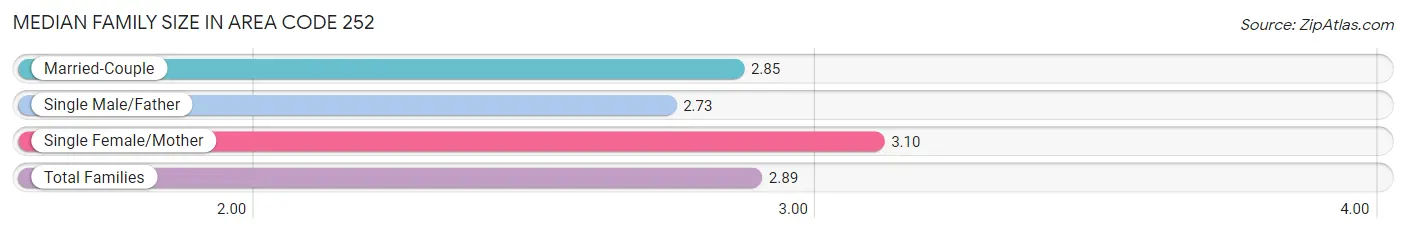
The median family size in Area Code 252 is 2.89 persons per family, with single female/mother families (66,150 | 24.0%) accounting for the largest median family size of 3.10353 persons per family. On the other hand, single male/father families (20,824 | 7.6%) represent the smallest median family size with 2.73 persons per family.
| Family Type | # Families | Family Size |
| Married-Couple | 188,499 (68.4%) | 2.85 |
| Single Male/Father | 20,824 (7.6%) | 2.73 |
| Single Female/Mother | 66,150 (24.0%) | 3.10 |
| Total Families | 275,473 (100.0%) | 2.89 |
Median Household Size in Area Code 252
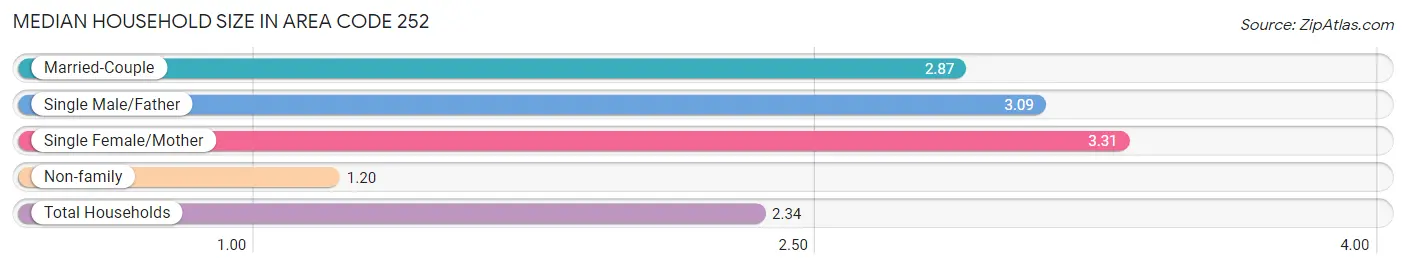
The median household size in Area Code 252 is 2.34 persons per household, with single female/mother households (66,150 | 15.2%) accounting for the largest median household size of 3.31107 persons per household. non-family households (159,499 | 36.7%) represent the smallest median household size with 1.20 persons per household.
| Household Type | # Households | Household Size |
| Married-Couple | 188,499 (43.3%) | 2.87 |
| Single Male/Father | 20,824 (4.8%) | 3.09 |
| Single Female/Mother | 66,150 (15.2%) | 3.31 |
| Non-family | 159,499 (36.7%) | 1.20 |
| Total Households | 434,972 (100.0%) | 2.34 |
Household Size by Marriage Status in Area Code 252
Out of a total of 434,972 households in Area Code 252, 275,473 (63.3%) are family households, while 159,499 (36.7%) are nonfamily households. The most numerous type of family households are 2-person households, comprising 137,679, and the most common type of nonfamily households are 1-person households, comprising 134,193.
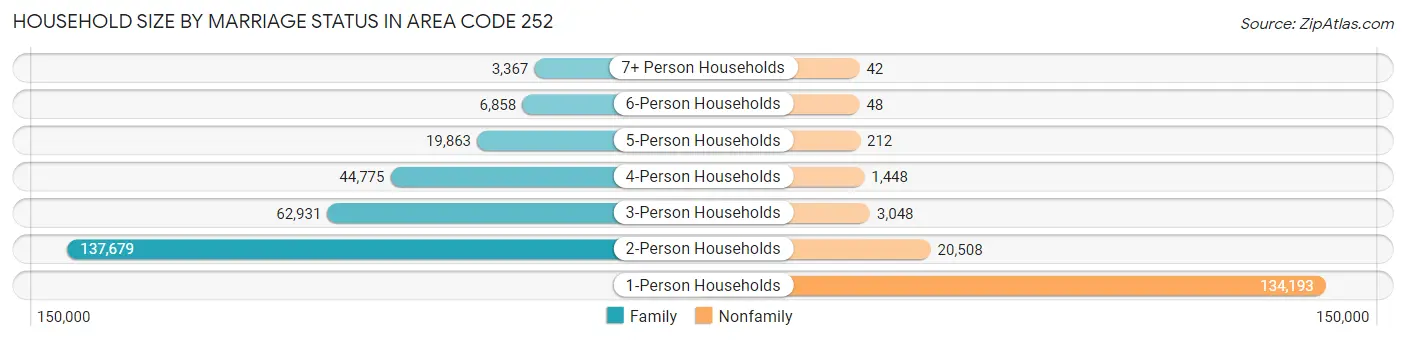
| Household Size | Family Households | Nonfamily Households |
| 1-Person Households | - | 134,193 (30.8%) |
| 2-Person Households | 137,679 (31.7%) | 20,508 (4.7%) |
| 3-Person Households | 62,931 (14.5%) | 3,048 (0.7%) |
| 4-Person Households | 44,775 (10.3%) | 1,448 (0.3%) |
| 5-Person Households | 19,863 (4.6%) | 212 (0.1%) |
| 6-Person Households | 6,858 (1.6%) | 48 (0.0%) |
| 7+ Person Households | 3,367 (0.8%) | 42 (0.0%) |
| Total | 275,473 (63.3%) | 159,499 (36.7%) |
Female Fertility in Area Code 252
Fertility by Age in Area Code 252
Average fertility rate in Area Code 252 is 78.2 births per 1,000 women. Women in the age bracket of 20 to 34 years have the highest fertility rate with 158.6 births per 1,000 women. Women in the age bracket of 20 to 34 years acount for 77.7% of all women with births.
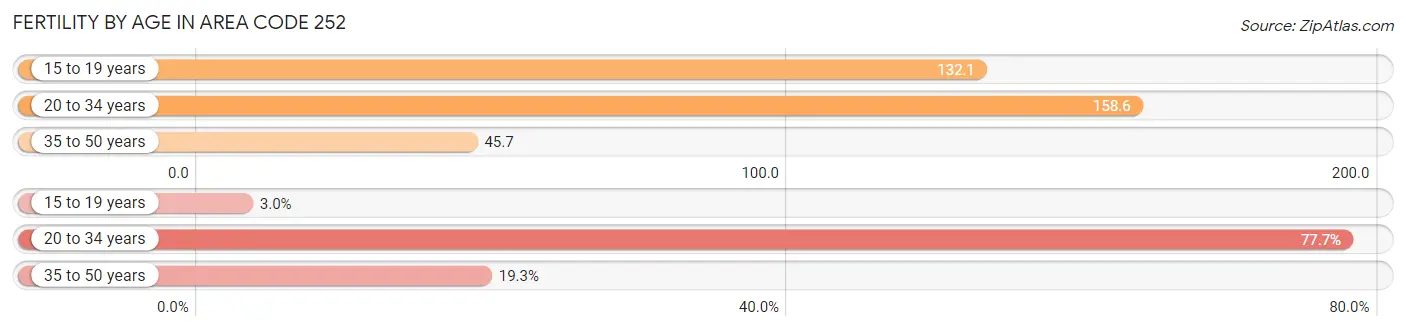
| Age Bracket | Women with Births | Births / 1,000 Women |
| 15 to 19 years | 357 (3.0%) | 132.1 |
| 20 to 34 years | 9,122 (77.7%) | 158.6 |
| 35 to 50 years | 2,261 (19.3%) | 45.7 |
| Total | 11,740 (100.0%) | 78.2 |
Fertility by Age by Marriage Status in Area Code 252
40.7% of women with births (11,740) in Area Code 252 are married. The highest percentage of unmarried women with births falls into 15 to 19 years age bracket with 100.0% of them unmarried at the time of birth, while the lowest percentage of unmarried women with births belong to 20 to 34 years age bracket with 66.1% of them unmarried.
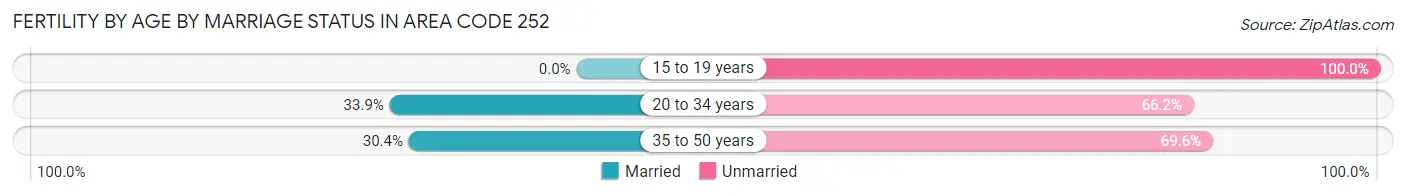
| Age Bracket | Married | Unmarried |
| 15 to 19 years | 0 (0.0%) | 357 (100.0%) |
| 20 to 34 years | 3,088 (33.9%) | 6,034 (66.1%) |
| 35 to 50 years | 687 (30.4%) | 1,574 (69.6%) |
| Total | 4,773 (40.7%) | 6,967 (59.3%) |
Fertility by Education in Area Code 252
Average fertility rate in Area Code 252 is 78.2 births per 1,000 women. Women with the education attainment of graduate degree have the highest fertility rate of 253.6 births per 1,000 women, while women with the education attainment of college or associate's degree have the lowest fertility at 95.6 births per 1,000 women. Women with the education attainment of college or associate's degree represent 39.1% of all women with births.
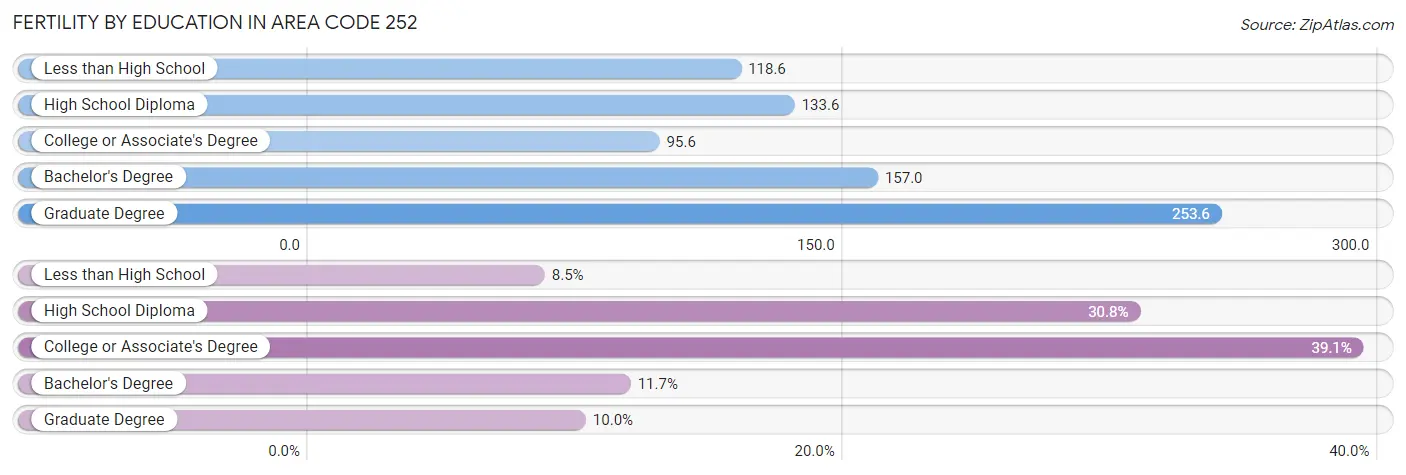
| Educational Attainment | Women with Births | Births / 1,000 Women |
| Less than High School | 992 (8.5%) | 118.6 |
| High School Diploma | 3,611 (30.8%) | 133.6 |
| College or Associate's Degree | 4,594 (39.1%) | 95.6 |
| Bachelor's Degree | 1,370 (11.7%) | 157.0 |
| Graduate Degree | 1,173 (10.0%) | 253.6 |
| Total | 11,740 (100.0%) | 78.2 |
Fertility by Education by Marriage Status in Area Code 252
59.3% of women with births in Area Code 252 are unmarried. Women with the educational attainment of graduate degree are most likely to be married with 34.4% of them married at childbirth, while women with the educational attainment of less than high school are least likely to be married with 90.6% of them unmarried at childbirth.
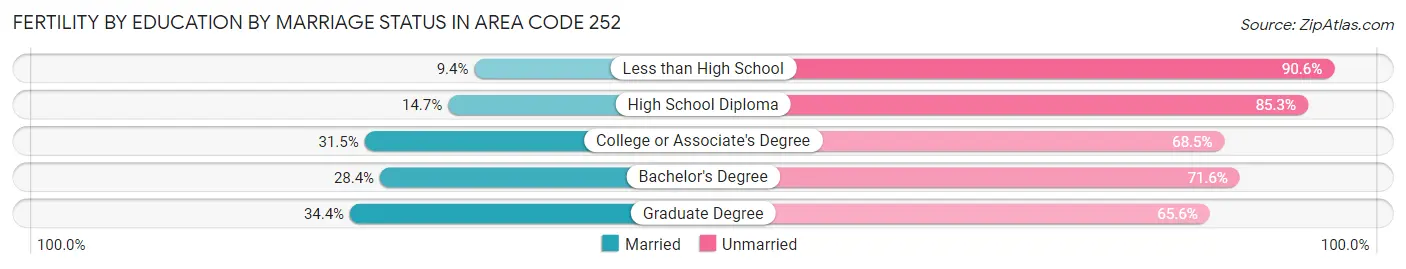
| Educational Attainment | Married | Unmarried |
| Less than High School | 93 (9.4%) | 899 (90.6%) |
| High School Diploma | 530 (14.7%) | 3,081 (85.3%) |
| College or Associate's Degree | 1,447 (31.5%) | 3,147 (68.5%) |
| Bachelor's Degree | 389 (28.4%) | 981 (71.6%) |
| Graduate Degree | 404 (34.4%) | 769 (65.6%) |
| Total | 4,773 (40.7%) | 6,967 (59.3%) |
Employment Characteristics in Area Code 252
Employment by Class of Employer in Area Code 252
Among the 458,859 employed individuals in Area Code 252, private company employees (293,418 | 63.9%), local government employees (35,127 | 7.7%), and state government employees (32,747 | 7.1%) make up the most common classes of employment.
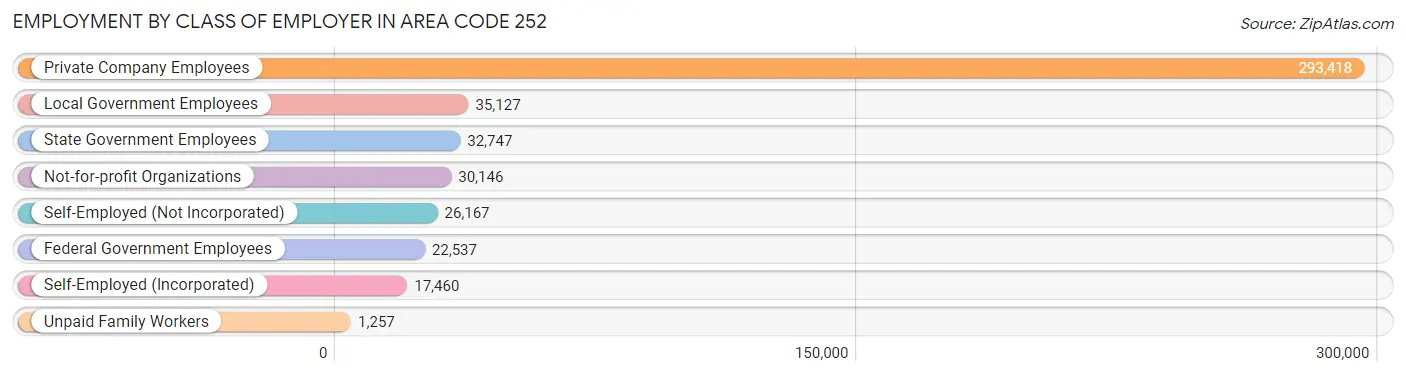
| Employer Class | # Employees | % Employees |
| Private Company Employees | 293,418 | 63.9% |
| Self-Employed (Incorporated) | 17,460 | 3.8% |
| Self-Employed (Not Incorporated) | 26,167 | 5.7% |
| Not-for-profit Organizations | 30,146 | 6.6% |
| Local Government Employees | 35,127 | 7.7% |
| State Government Employees | 32,747 | 7.1% |
| Federal Government Employees | 22,537 | 4.9% |
| Unpaid Family Workers | 1,257 | 0.3% |
| Total | 458,859 | 100.0% |
Employment Status by Age in Area Code 252
According to the labor force statistics for Area Code 252, out of the total population over 16 years of age (866,879), 56.5% or 489,960 individuals are in the labor force, with 7.6% or 37,237 of them unemployed. The age group with the highest labor force participation rate is 25 to 29 years, with 83.3% or 54,703 individuals in the labor force. Within the labor force, the 16 to 19 years age range has the highest percentage of unemployed individuals, with 2,377.3% or 586,504 of them being unemployed.
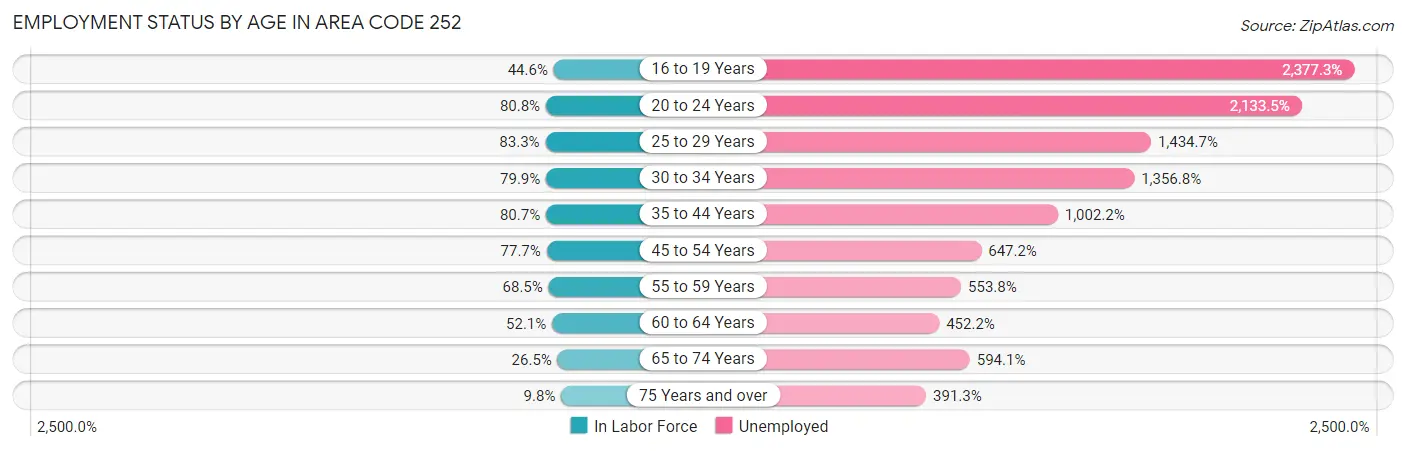
| Age Bracket | In Labor Force | Unemployed |
| 16 to 19 Years | 24,673 (44.6%) | 586,504 (2,377.3%) |
| 20 to 24 Years | 59,153 (80.8%) | 1,262,008 (2,133.5%) |
| 25 to 29 Years | 54,706 (83.3%) | 784,824 (1,434.7%) |
| 30 to 34 Years | 48,987 (79.9%) | 664,628 (1,356.8%) |
| 35 to 44 Years | 97,040 (80.6%) | 972,535 (1,002.2%) |
| 45 to 54 Years | 99,424 (77.7%) | 643,453 (647.2%) |
| 55 to 59 Years | 49,880 (68.4%) | 276,247 (553.8%) |
| 60 to 64 Years | 40,543 (52.1%) | 183,322 (452.2%) |
| 65 to 74 Years | 33,923 (26.5%) | 201,542 (594.1%) |
| 75 Years and over | 8,272 (9.8%) | 32,368 (391.3%) |
| Total | 489,949 (56.5%) | 37,257 (7.6%) |
Employment Status by Educational Attainment in Area Code 252
According to labor force statistics for Area Code 252, 72.3% of individuals (380,487) out of the total population between 25 and 64 years of age (526,043) are in the labor force, with 922.4% or 3,509,612 of them being unemployed. The group with the highest labor force participation rate are those with the educational attainment of bachelor's degree or higher, with 82.1% or 101,977 individuals in the labor force. Within the labor force, individuals with less than high school education have the highest percentage of unemployment, with 1,488.5% or 508,248 of them being unemployed.
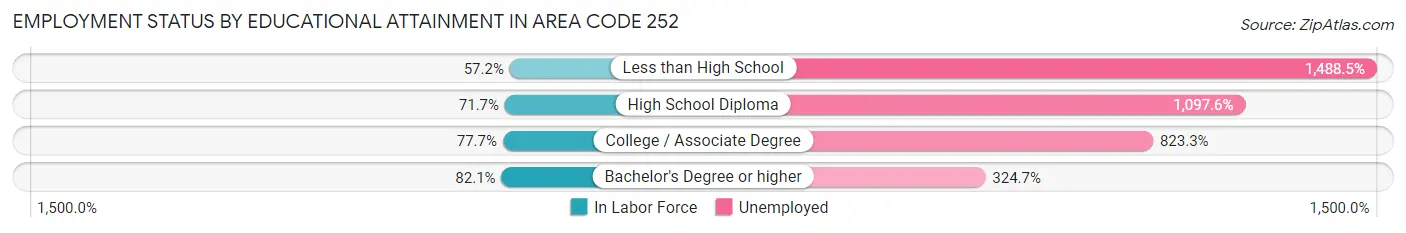
| Educational Attainment | In Labor Force | Unemployed |
| Less than High School | 34,147 (57.2%) | 887,935 (1,488.5%) |
| High School Diploma | 113,924 (71.7%) | 1,744,350 (1,097.6%) |
| College / Associate Degree | 142,430 (77.7%) | 1,508,368 (823.3%) |
| Bachelor's Degree or higher | 101,979 (82.1%) | 403,459 (324.7%) |
| Total | 380,509 (72.3%) | 4,852,221 (922.4%) |
Employment Occupations by Sex in Area Code 252
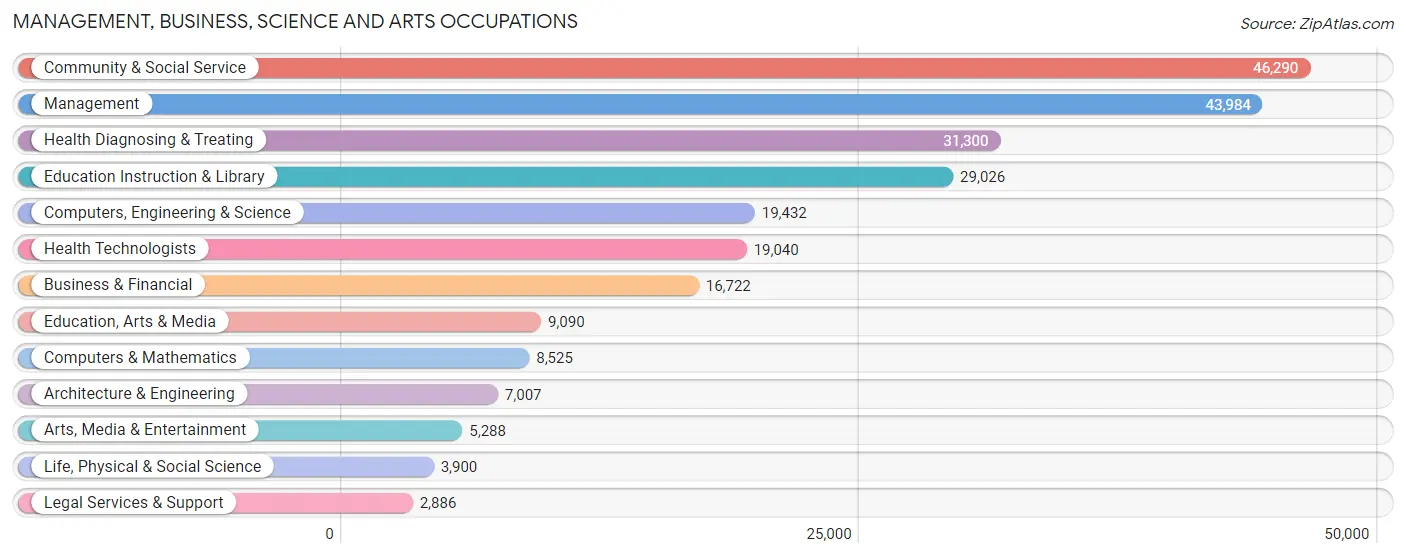
Management, Business, Science and Arts Occupations
The most common Management, Business, Science and Arts occupations in Area Code 252 are Community & Social Service (46,290 | 10.1%), Management (43,984 | 9.6%), Health Diagnosing & Treating (31,300 | 6.8%), Education Instruction & Library (29,026 | 6.3%), and Computers, Engineering & Science (19,432 | 4.2%).
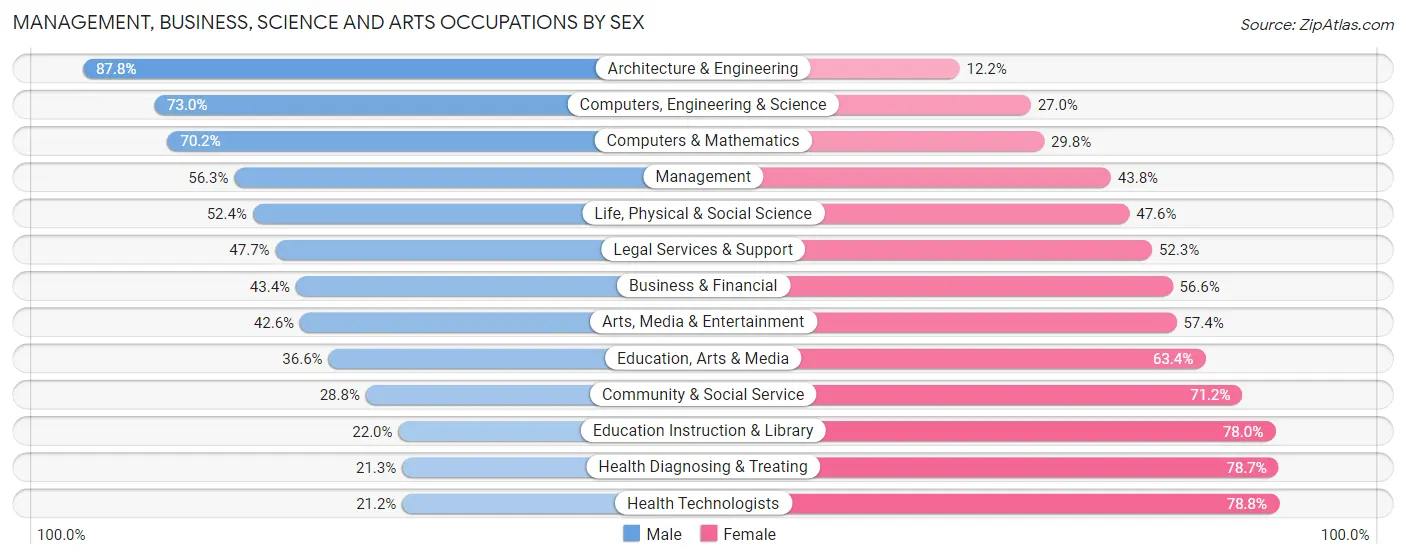
Management, Business, Science and Arts Occupations by Sex
Within the Management, Business, Science and Arts occupations in Area Code 252, the most male-oriented occupations are Architecture & Engineering (87.8%), Computers, Engineering & Science (73.0%), and Computers & Mathematics (70.2%), while the most female-oriented occupations are Health Technologists (78.8%), Health Diagnosing & Treating (78.7%), and Education Instruction & Library (78.0%).
| Occupation | Male | Female |
| Management | 24,739 (56.2%) | 19,245 (43.8%) |
| Business & Financial | 7,257 (43.4%) | 9,465 (56.6%) |
| Computers, Engineering & Science | 14,182 (73.0%) | 5,250 (27.0%) |
| Computers & Mathematics | 5,985 (70.2%) | 2,540 (29.8%) |
| Architecture & Engineering | 6,153 (87.8%) | 854 (12.2%) |
| Life, Physical & Social Science | 2,044 (52.4%) | 1,856 (47.6%) |
| Community & Social Service | 13,349 (28.8%) | 32,941 (71.2%) |
| Education, Arts & Media | 3,329 (36.6%) | 5,761 (63.4%) |
| Legal Services & Support | 1,376 (47.7%) | 1,510 (52.3%) |
| Education Instruction & Library | 6,393 (22.0%) | 22,633 (78.0%) |
| Arts, Media & Entertainment | 2,251 (42.6%) | 3,037 (57.4%) |
| Health Diagnosing & Treating | 6,657 (21.3%) | 24,643 (78.7%) |
| Health Technologists | 4,043 (21.2%) | 14,997 (78.8%) |
| Total (Category) | 66,184 (42.0%) | 91,544 (58.0%) |
| Total (Overall) | 232,681 (50.7%) | 225,926 (49.3%) |
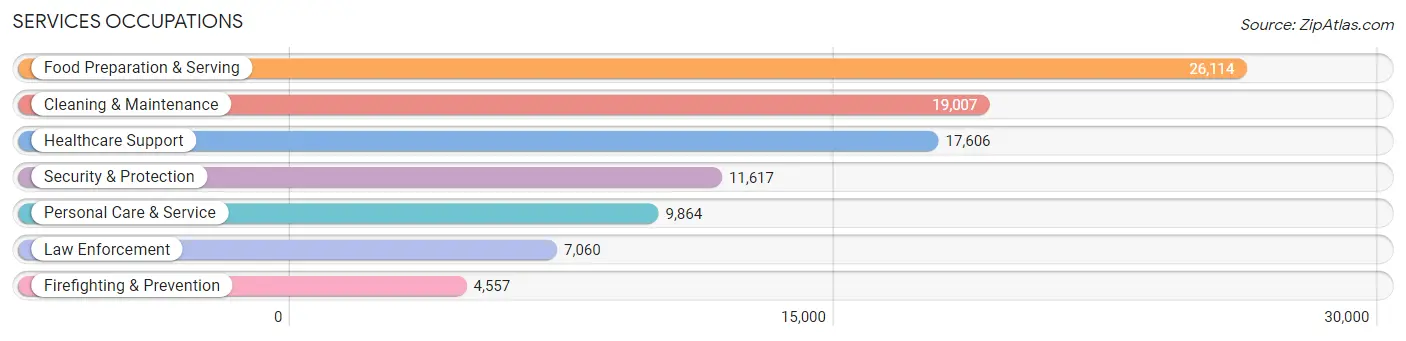
Services Occupations
The most common Services occupations in Area Code 252 are Food Preparation & Serving (26,114 | 5.7%), Cleaning & Maintenance (19,007 | 4.1%), Healthcare Support (17,606 | 3.8%), Security & Protection (11,617 | 2.5%), and Personal Care & Service (9,864 | 2.1%).
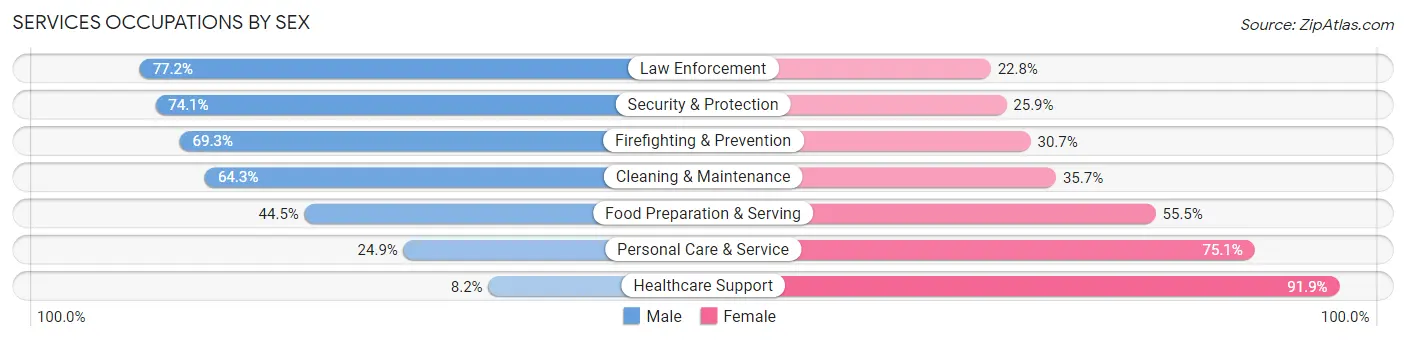
Services Occupations by Sex
Within the Services occupations in Area Code 252, the most male-oriented occupations are Law Enforcement (77.2%), Security & Protection (74.1%), and Firefighting & Prevention (69.3%), while the most female-oriented occupations are Healthcare Support (91.8%), Personal Care & Service (75.1%), and Food Preparation & Serving (55.5%).
| Occupation | Male | Female |
| Healthcare Support | 1,435 (8.2%) | 16,171 (91.8%) |
| Security & Protection | 8,608 (74.1%) | 3,009 (25.9%) |
| Firefighting & Prevention | 3,158 (69.3%) | 1,399 (30.7%) |
| Law Enforcement | 5,450 (77.2%) | 1,610 (22.8%) |
| Food Preparation & Serving | 11,630 (44.5%) | 14,484 (55.5%) |
| Cleaning & Maintenance | 12,215 (64.3%) | 6,792 (35.7%) |
| Personal Care & Service | 2,460 (24.9%) | 7,404 (75.1%) |
| Total (Category) | 36,348 (43.2%) | 47,860 (56.8%) |
| Total (Overall) | 232,681 (50.7%) | 225,926 (49.3%) |
Sales and Office Occupations
The most common Sales and Office occupations in Area Code 252 are Office & Administration (47,679 | 10.4%), and Sales & Related (43,551 | 9.5%).
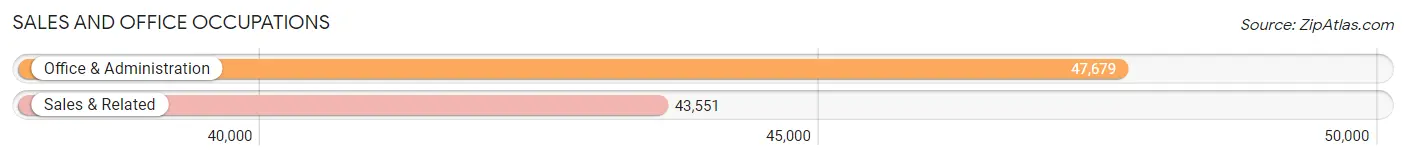
Sales and Office Occupations by Sex
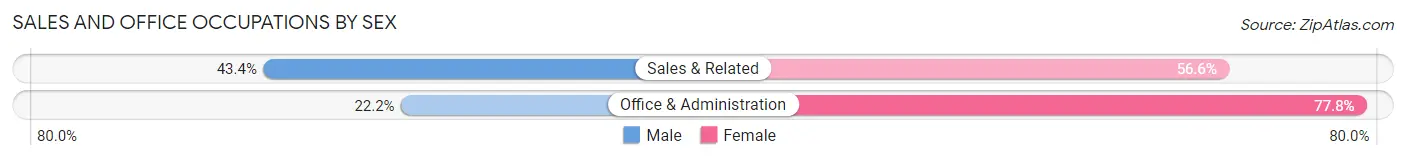
| Occupation | Male | Female |
| Sales & Related | 18,883 (43.4%) | 24,668 (56.6%) |
| Office & Administration | 10,574 (22.2%) | 37,105 (77.8%) |
| Total (Category) | 29,457 (32.3%) | 61,773 (67.7%) |
| Total (Overall) | 232,681 (50.7%) | 225,926 (49.3%) |
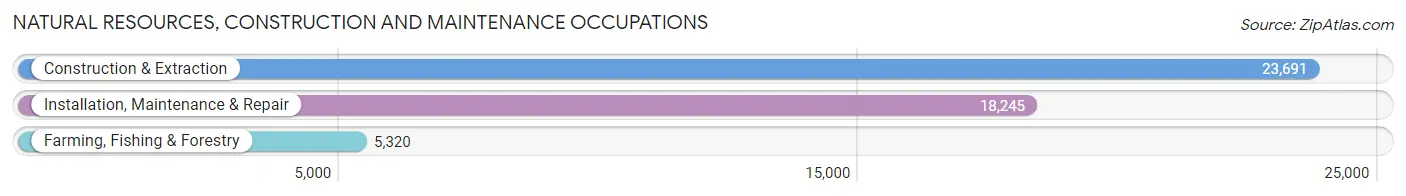
Natural Resources, Construction and Maintenance Occupations
The most common Natural Resources, Construction and Maintenance occupations in Area Code 252 are Construction & Extraction (23,691 | 5.2%), Installation, Maintenance & Repair (18,245 | 4.0%), and Farming, Fishing & Forestry (5,320 | 1.2%).
Natural Resources, Construction and Maintenance Occupations by Sex
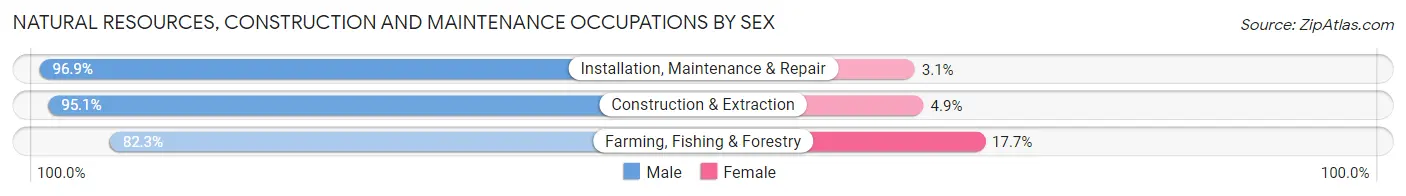
| Occupation | Male | Female |
| Farming, Fishing & Forestry | 4,377 (82.3%) | 943 (17.7%) |
| Construction & Extraction | 22,521 (95.1%) | 1,170 (4.9%) |
| Installation, Maintenance & Repair | 17,677 (96.9%) | 568 (3.1%) |
| Total (Category) | 44,575 (94.3%) | 2,681 (5.7%) |
| Total (Overall) | 232,681 (50.7%) | 225,926 (49.3%) |
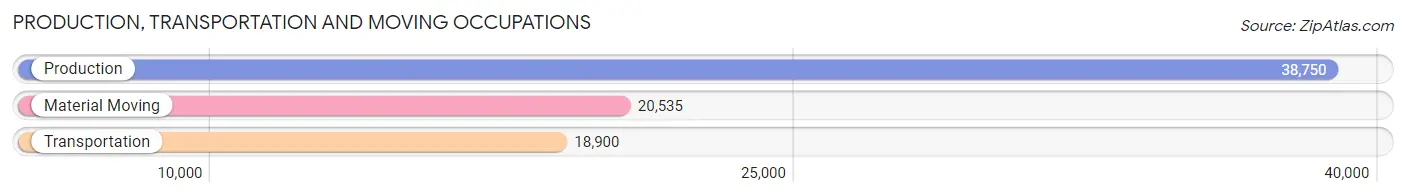
Production, Transportation and Moving Occupations
The most common Production, Transportation and Moving occupations in Area Code 252 are Production (38,750 | 8.5%), Material Moving (20,535 | 4.5%), and Transportation (18,900 | 4.1%).
Production, Transportation and Moving Occupations by Sex
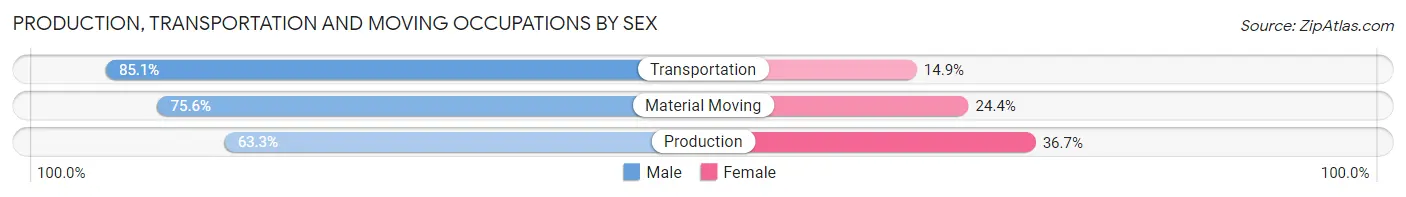
| Occupation | Male | Female |
| Production | 24,518 (63.3%) | 14,232 (36.7%) |
| Transportation | 16,078 (85.1%) | 2,822 (14.9%) |
| Material Moving | 15,521 (75.6%) | 5,014 (24.4%) |
| Total (Category) | 56,117 (71.8%) | 22,068 (28.2%) |
| Total (Overall) | 232,681 (50.7%) | 225,926 (49.3%) |
Employment Industries by Sex in Area Code 252
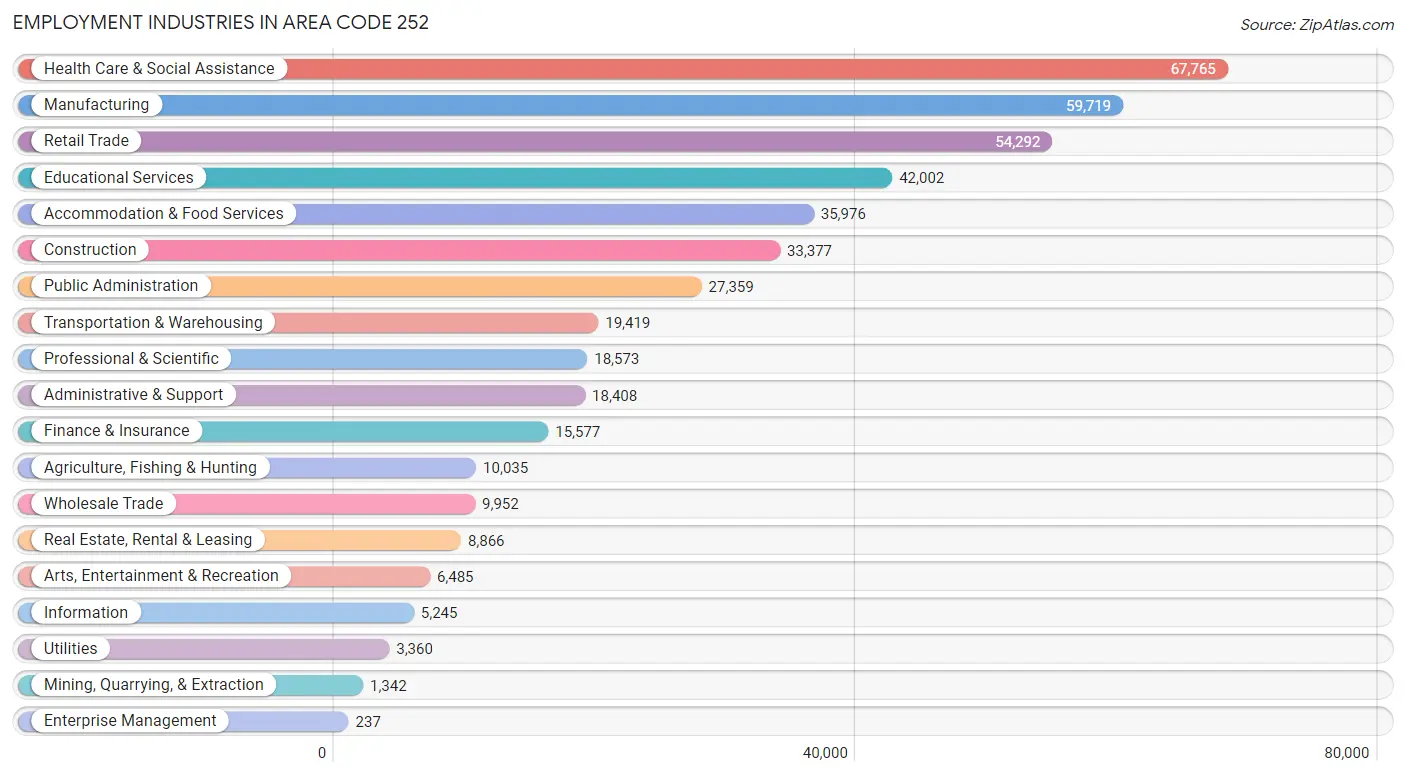
Employment Industries in Area Code 252
The major employment industries in Area Code 252 include Health Care & Social Assistance (67,765 | 14.8%), Manufacturing (59,719 | 13.0%), Retail Trade (54,292 | 11.8%), Educational Services (42,002 | 9.2%), and Accommodation & Food Services (35,976 | 7.8%).
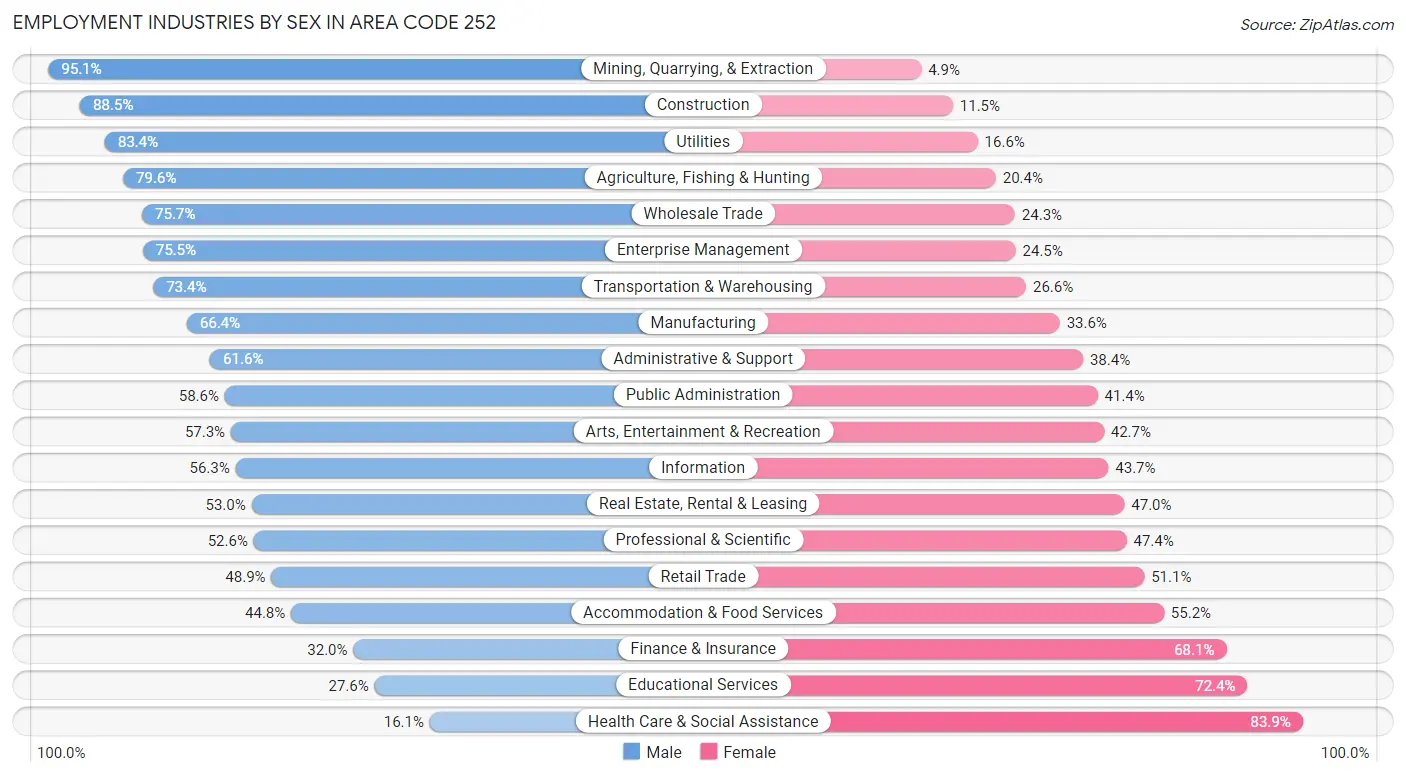
Employment Industries by Sex in Area Code 252
The Area Code 252 industries that see more men than women are Mining, Quarrying, & Extraction (95.1%), Construction (88.5%), and Utilities (83.4%), whereas the industries that tend to have a higher number of women are Health Care & Social Assistance (83.9%), Educational Services (72.4%), and Finance & Insurance (68.0%).
| Industry | Male | Female |
| Agriculture, Fishing & Hunting | 7,991 (79.6%) | 2,044 (20.4%) |
| Mining, Quarrying, & Extraction | 1,276 (95.1%) | 66 (4.9%) |
| Construction | 29,550 (88.5%) | 3,827 (11.5%) |
| Manufacturing | 39,662 (66.4%) | 20,057 (33.6%) |
| Wholesale Trade | 7,532 (75.7%) | 2,420 (24.3%) |
| Retail Trade | 26,555 (48.9%) | 27,737 (51.1%) |
| Transportation & Warehousing | 14,248 (73.4%) | 5,171 (26.6%) |
| Utilities | 2,802 (83.4%) | 558 (16.6%) |
| Information | 2,955 (56.3%) | 2,290 (43.7%) |
| Finance & Insurance | 4,977 (32.0%) | 10,600 (68.0%) |
| Real Estate, Rental & Leasing | 4,702 (53.0%) | 4,164 (47.0%) |
| Professional & Scientific | 9,764 (52.6%) | 8,809 (47.4%) |
| Enterprise Management | 179 (75.5%) | 58 (24.5%) |
| Administrative & Support | 11,338 (61.6%) | 7,070 (38.4%) |
| Educational Services | 11,580 (27.6%) | 30,422 (72.4%) |
| Health Care & Social Assistance | 10,932 (16.1%) | 56,833 (83.9%) |
| Arts, Entertainment & Recreation | 3,715 (57.3%) | 2,770 (42.7%) |
| Accommodation & Food Services | 16,131 (44.8%) | 19,845 (55.2%) |
| Public Administration | 16,021 (58.6%) | 11,338 (41.4%) |
| Total | 232,681 (50.7%) | 225,926 (49.3%) |
Education in Area Code 252
School Enrollment in Area Code 252
The most common levels of schooling among the 243,377 students in Area Code 252 are college / undergraduate (55,932 | 23.0%), high school (52,451 | 21.5%), and middle school (52,107 | 21.4%).
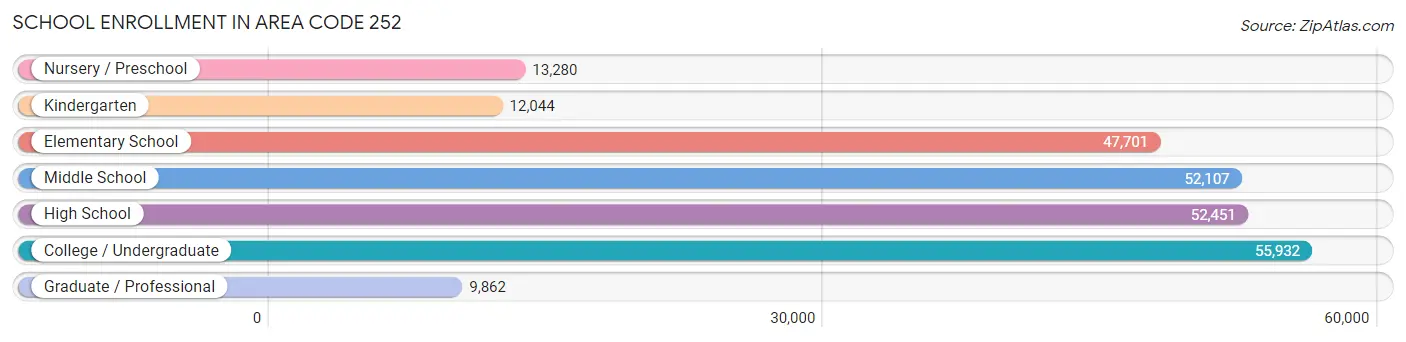
| School Level | # Students | % Students |
| Nursery / Preschool | 13,280 | 5.5% |
| Kindergarten | 12,044 | 5.0% |
| Elementary School | 47,701 | 19.6% |
| Middle School | 52,107 | 21.4% |
| High School | 52,451 | 21.5% |
| College / Undergraduate | 55,932 | 23.0% |
| Graduate / Professional | 9,862 | 4.1% |
| Total | 243,377 | 100.0% |
School Enrollment by Age by Funding Source in Area Code 252
Out of a total of 243,377 students who are enrolled in schools in Area Code 252, 33,649 (13.8%) attend a private institution, while the remaining 209,728 (86.2%) are enrolled in public schools. The age group of 3 to 4 year olds has the highest likelihood of being enrolled in private schools, with 3,253 (31.0% in the age bracket) enrolled. Conversely, the age group of 15 to 17 year olds has the lowest likelihood of being enrolled in a private school, with 33,763 (89.2% in the age bracket) attending a public institution.
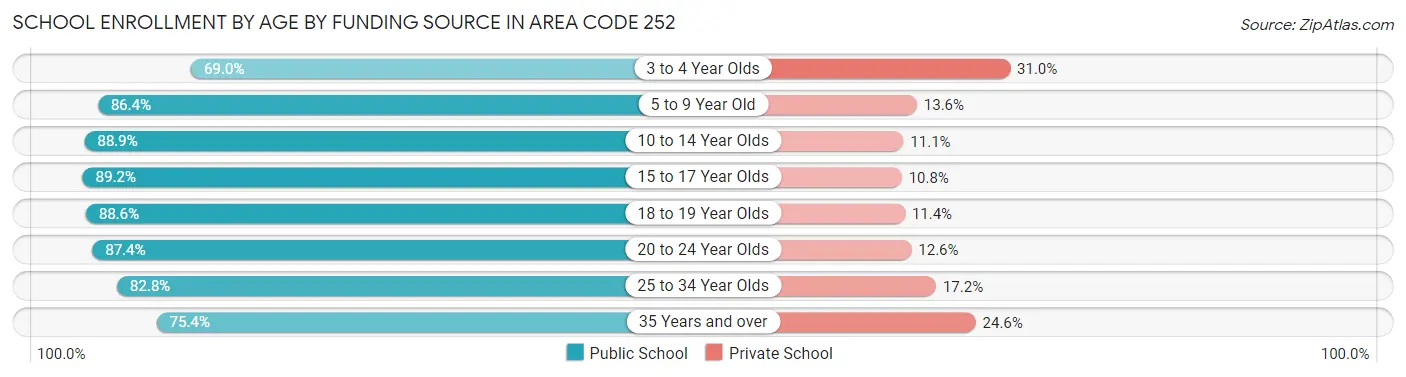
| Age Bracket | Public School | Private School |
| 3 to 4 Year Olds | 7,239 (69.0%) | 3,253 (31.0%) |
| 5 to 9 Year Old | 47,511 (86.4%) | 7,499 (13.6%) |
| 10 to 14 Year Olds | 58,072 (88.9%) | 7,274 (11.1%) |
| 15 to 17 Year Olds | 33,763 (89.2%) | 4,093 (10.8%) |
| 18 to 19 Year Olds | 18,347 (88.6%) | 2,364 (11.4%) |
| 20 to 24 Year Olds | 22,267 (87.4%) | 3,214 (12.6%) |
| 25 to 34 Year Olds | 11,596 (82.8%) | 2,408 (17.2%) |
| 35 Years and over | 10,919 (75.4%) | 3,558 (24.6%) |
| Total | 209,728 (86.2%) | 33,649 (13.8%) |
Educational Attainment by Field of Study in Area Code 252
Business (33,022 | 17.8%), education (32,926 | 17.7%), science & technology (21,286 | 11.5%), arts & humanities (16,328 | 8.8%), and bio, nature & agricultural (12,544 | 6.8%) are the most common fields of study among 185,766 individuals in Area Code 252 who have obtained a bachelor's degree or higher.
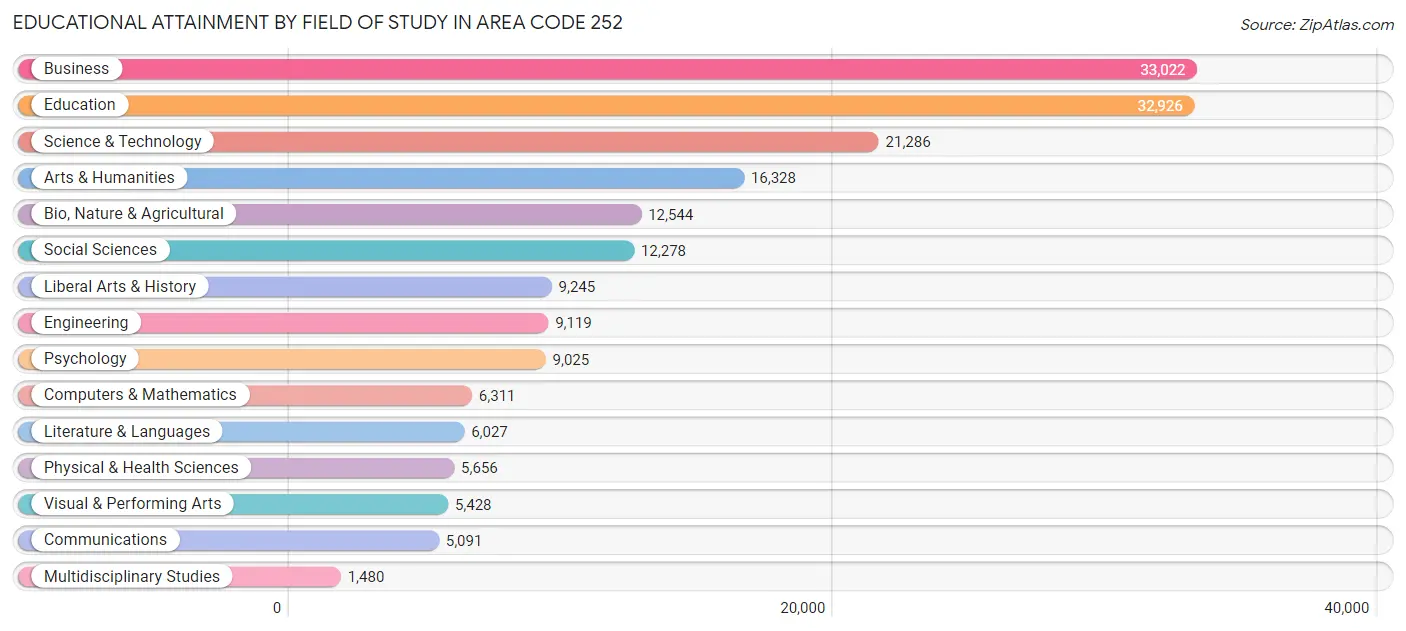
| Field of Study | # Graduates | % Graduates |
| Computers & Mathematics | 6,311 | 3.4% |
| Bio, Nature & Agricultural | 12,544 | 6.8% |
| Physical & Health Sciences | 5,656 | 3.0% |
| Psychology | 9,025 | 4.9% |
| Social Sciences | 12,278 | 6.6% |
| Engineering | 9,119 | 4.9% |
| Multidisciplinary Studies | 1,480 | 0.8% |
| Science & Technology | 21,286 | 11.5% |
| Business | 33,022 | 17.8% |
| Education | 32,926 | 17.7% |
| Literature & Languages | 6,027 | 3.2% |
| Liberal Arts & History | 9,245 | 5.0% |
| Visual & Performing Arts | 5,428 | 2.9% |
| Communications | 5,091 | 2.7% |
| Arts & Humanities | 16,328 | 8.8% |
| Total | 185,766 | 100.0% |
Transportation & Commute in Area Code 252
Vehicle Availability by Sex in Area Code 252
The most prevalent vehicle ownership categories in Area Code 252 are males with 2 vehicles (90,164, accounting for 38.7%) and females with 2 vehicles (81,597, making up 40.7%).
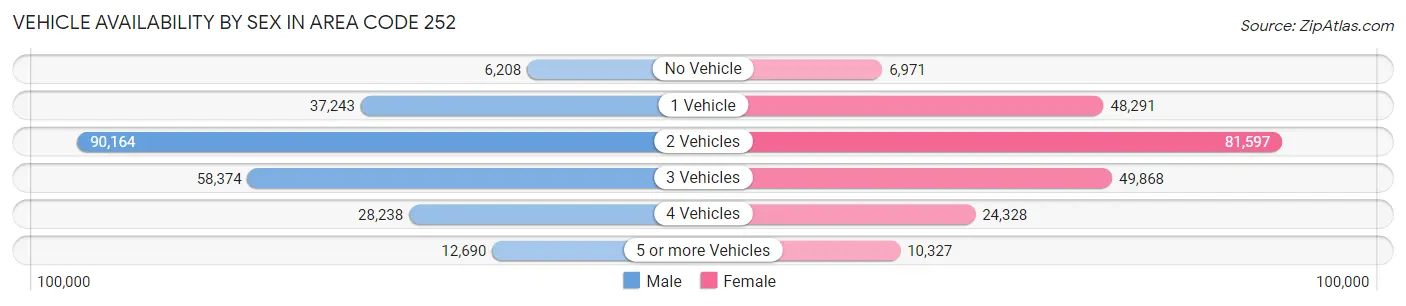
| Vehicles Available | Male | Female |
| No Vehicle | 6,208 (2.7%) | 6,971 (3.2%) |
| 1 Vehicle | 37,243 (16.0%) | 48,291 (21.8%) |
| 2 Vehicles | 90,164 (38.7%) | 81,597 (36.9%) |
| 3 Vehicles | 58,374 (25.1%) | 49,868 (22.5%) |
| 4 Vehicles | 28,238 (12.1%) | 24,328 (11.0%) |
| 5 or more Vehicles | 12,690 (5.4%) | 10,327 (4.7%) |
| Total | 232,917 (100.0%) | 221,382 (100.0%) |
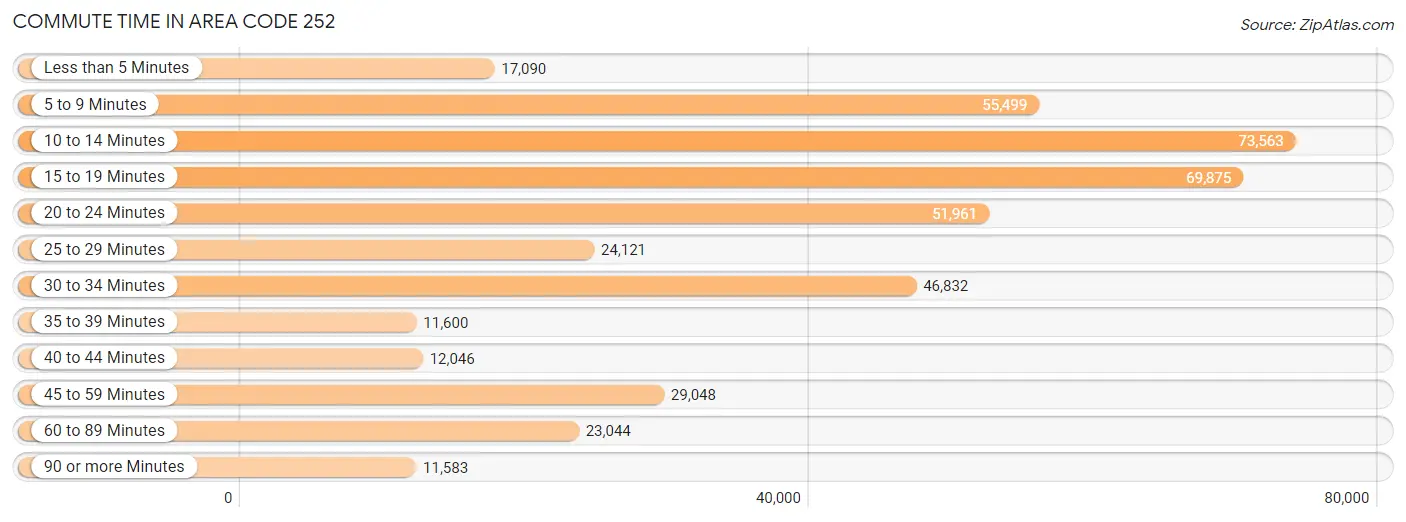
Commute Time in Area Code 252
The most frequently occuring commute durations in Area Code 252 are 10 to 14 minutes (73,563 commuters, 17.3%), 15 to 19 minutes (69,875 commuters, 16.4%), and 5 to 9 minutes (55,499 commuters, 13.0%).
| Commute Time | # Commuters | % Commuters |
| Less than 5 Minutes | 17,090 | 4.0% |
| 5 to 9 Minutes | 55,499 | 13.0% |
| 10 to 14 Minutes | 73,563 | 17.3% |
| 15 to 19 Minutes | 69,875 | 16.4% |
| 20 to 24 Minutes | 51,961 | 12.2% |
| 25 to 29 Minutes | 24,121 | 5.7% |
| 30 to 34 Minutes | 46,832 | 11.0% |
| 35 to 39 Minutes | 11,600 | 2.7% |
| 40 to 44 Minutes | 12,046 | 2.8% |
| 45 to 59 Minutes | 29,048 | 6.8% |
| 60 to 89 Minutes | 23,044 | 5.4% |
| 90 or more Minutes | 11,583 | 2.7% |
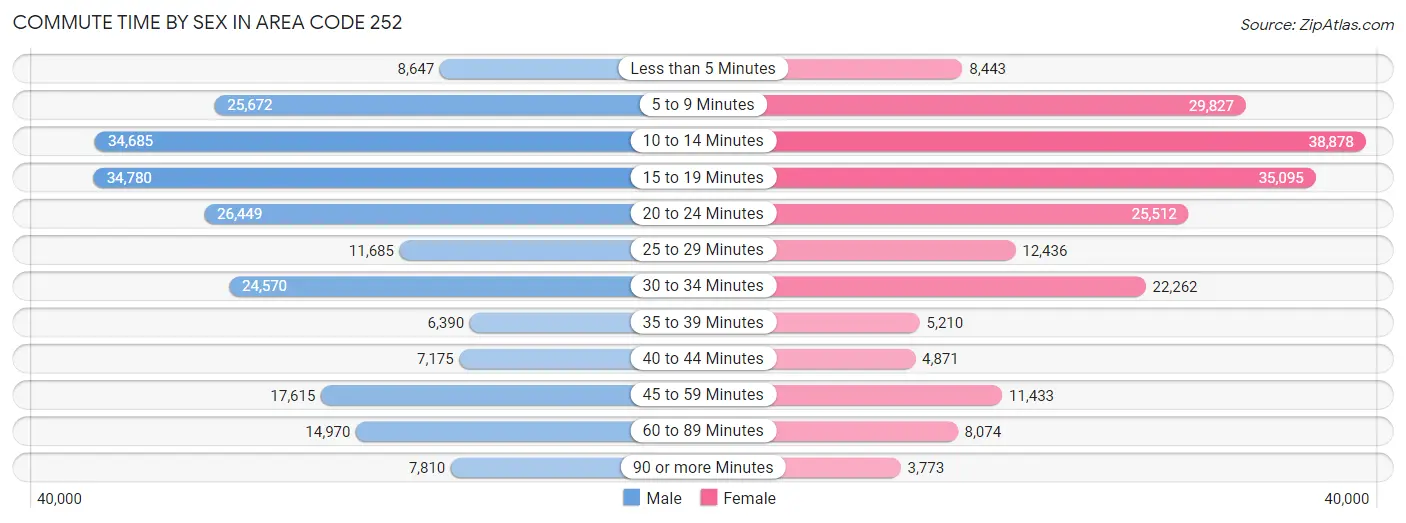
Commute Time by Sex in Area Code 252
The most common commute times in Area Code 252 are 15 to 19 minutes (34,780 commuters, 15.8%) for males and 10 to 14 minutes (38,878 commuters, 18.9%) for females.
| Commute Time | Male | Female |
| Less than 5 Minutes | 8,647 (3.9%) | 8,443 (4.1%) |
| 5 to 9 Minutes | 25,672 (11.7%) | 29,827 (14.5%) |
| 10 to 14 Minutes | 34,685 (15.7%) | 38,878 (18.9%) |
| 15 to 19 Minutes | 34,780 (15.8%) | 35,095 (17.1%) |
| 20 to 24 Minutes | 26,449 (12.0%) | 25,512 (12.4%) |
| 25 to 29 Minutes | 11,685 (5.3%) | 12,436 (6.0%) |
| 30 to 34 Minutes | 24,570 (11.2%) | 22,262 (10.8%) |
| 35 to 39 Minutes | 6,390 (2.9%) | 5,210 (2.5%) |
| 40 to 44 Minutes | 7,175 (3.3%) | 4,871 (2.4%) |
| 45 to 59 Minutes | 17,615 (8.0%) | 11,433 (5.6%) |
| 60 to 89 Minutes | 14,970 (6.8%) | 8,074 (3.9%) |
| 90 or more Minutes | 7,810 (3.5%) | 3,773 (1.8%) |
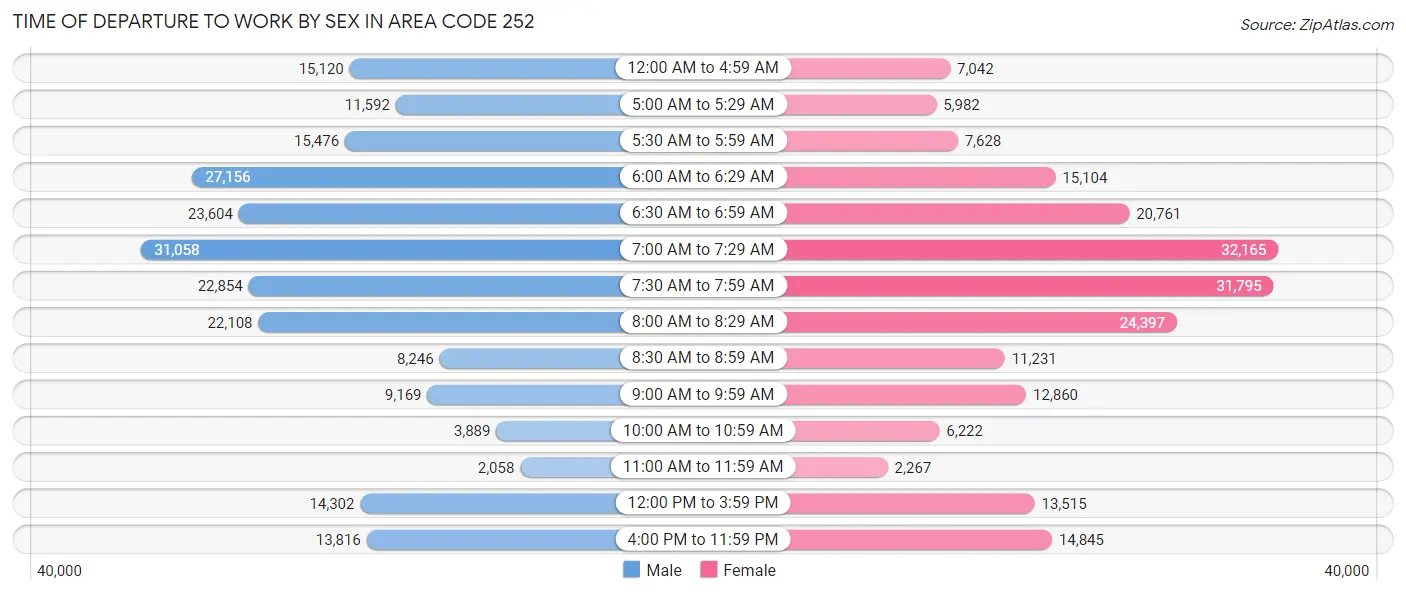
Time of Departure to Work by Sex in Area Code 252
The most frequent times of departure to work in Area Code 252 are 7:00 AM to 7:29 AM (31,058, 14.1%) for males and 7:00 AM to 7:29 AM (32,165, 15.6%) for females.
| Time of Departure | Male | Female |
| 12:00 AM to 4:59 AM | 15,120 (6.9%) | 7,042 (3.4%) |
| 5:00 AM to 5:29 AM | 11,592 (5.3%) | 5,982 (2.9%) |
| 5:30 AM to 5:59 AM | 15,476 (7.0%) | 7,628 (3.7%) |
| 6:00 AM to 6:29 AM | 27,156 (12.3%) | 15,104 (7.3%) |
| 6:30 AM to 6:59 AM | 23,604 (10.7%) | 20,761 (10.1%) |
| 7:00 AM to 7:29 AM | 31,058 (14.1%) | 32,165 (15.6%) |
| 7:30 AM to 7:59 AM | 22,854 (10.4%) | 31,795 (15.4%) |
| 8:00 AM to 8:29 AM | 22,108 (10.0%) | 24,397 (11.8%) |
| 8:30 AM to 8:59 AM | 8,246 (3.7%) | 11,231 (5.5%) |
| 9:00 AM to 9:59 AM | 9,169 (4.2%) | 12,860 (6.2%) |
| 10:00 AM to 10:59 AM | 3,889 (1.8%) | 6,222 (3.0%) |
| 11:00 AM to 11:59 AM | 2,058 (0.9%) | 2,267 (1.1%) |
| 12:00 PM to 3:59 PM | 14,302 (6.5%) | 13,515 (6.6%) |
| 4:00 PM to 11:59 PM | 13,816 (6.3%) | 14,845 (7.2%) |
| Total | 220,448 (100.0%) | 205,814 (100.0%) |
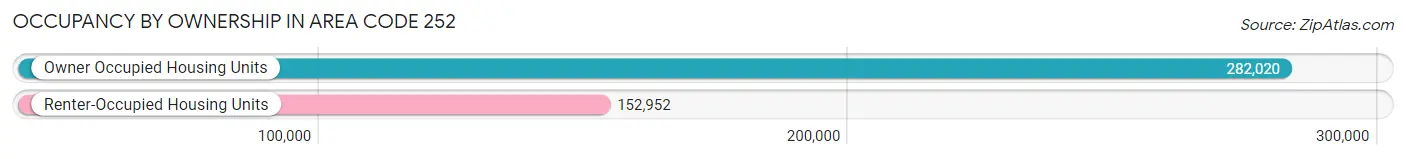
Housing Occupancy in Area Code 252
Occupancy by Ownership in Area Code 252
Of the total 434,972 dwellings in Area Code 252, owner-occupied units account for 282,020 (64.8%), while renter-occupied units make up 152,952 (35.2%).
| Occupancy | # Housing Units | % Housing Units |
| Owner Occupied Housing Units | 282,020 | 64.8% |
| Renter-Occupied Housing Units | 152,952 | 35.2% |
| Total Occupied Housing Units | 434,972 | 100.0% |
Occupancy by Household Size in Area Code 252
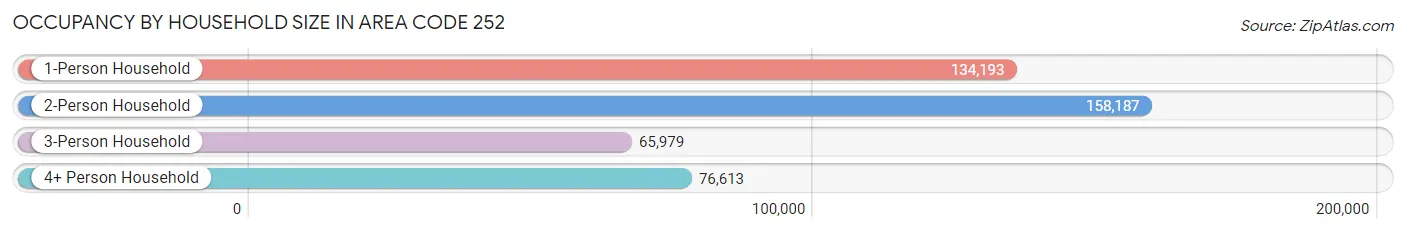
| Household Size | # Housing Units | % Housing Units |
| 1-Person Household | 134,193 | 30.8% |
| 2-Person Household | 158,187 | 36.4% |
| 3-Person Household | 65,979 | 15.2% |
| 4+ Person Household | 76,613 | 17.6% |
| Total Housing Units | 434,972 | 100.0% |
Occupancy by Ownership by Household Size in Area Code 252
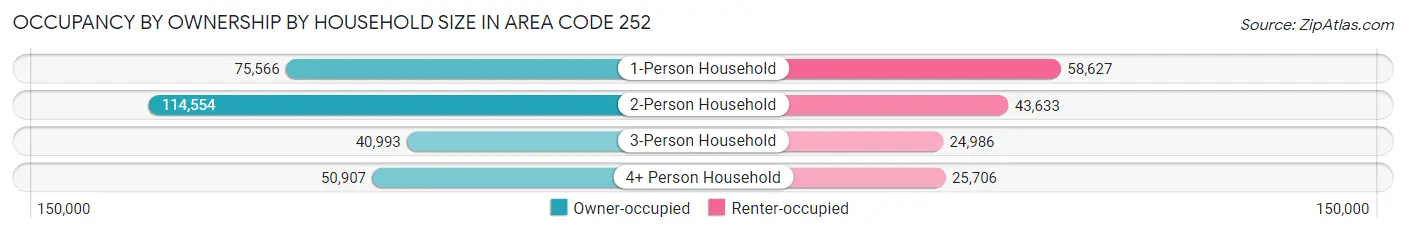
| Household Size | Owner-occupied | Renter-occupied |
| 1-Person Household | 75,566 (56.3%) | 58,627 (43.7%) |
| 2-Person Household | 114,554 (72.4%) | 43,633 (27.6%) |
| 3-Person Household | 40,993 (62.1%) | 24,986 (37.9%) |
| 4+ Person Household | 50,907 (66.4%) | 25,706 (33.6%) |
| Total Housing Units | 282,020 (64.8%) | 152,952 (35.2%) |
Occupancy by Educational Attainment in Area Code 252
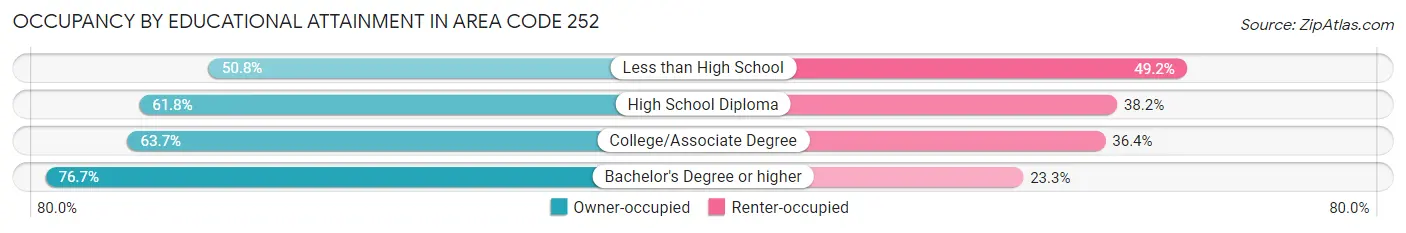
| Household Size | Owner-occupied | Renter-occupied |
| Less than High School | 26,109 (50.8%) | 25,327 (49.2%) |
| High School Diploma | 74,765 (61.8%) | 46,216 (38.2%) |
| College/Associate Degree | 98,525 (63.6%) | 56,275 (36.3%) |
| Bachelor's Degree or higher | 82,621 (76.7%) | 25,134 (23.3%) |
Occupancy by Age of Householder in Area Code 252
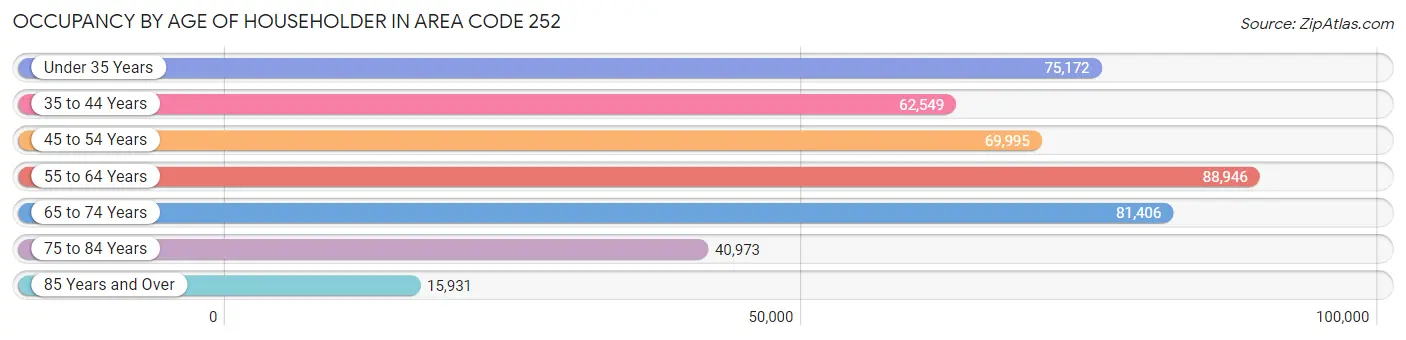
| Age Bracket | # Households | % Households |
| Under 35 Years | 75,172 | 17.3% |
| 35 to 44 Years | 62,549 | 14.4% |
| 45 to 54 Years | 69,995 | 16.1% |
| 55 to 64 Years | 88,946 | 20.4% |
| 65 to 74 Years | 81,406 | 18.7% |
| 75 to 84 Years | 40,973 | 9.4% |
| 85 Years and Over | 15,931 | 3.7% |
| Total | 434,972 | 100.0% |
Housing Finances in Area Code 252
Median Income by Occupancy in Area Code 252
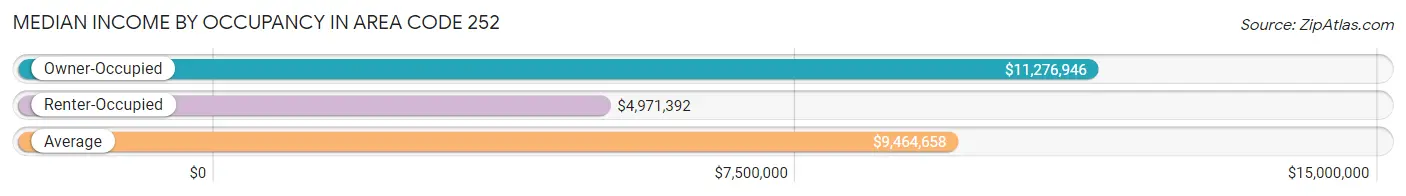
| Occupancy Type | # Households | Median Income |
| Owner-Occupied | 282,020 (64.8%) | $11,276,946 |
| Renter-Occupied | 152,952 (35.2%) | $4,971,392 |
| Average | 434,972 (100.0%) | $9,464,658 |
Occupancy by Householder Income Bracket in Area Code 252
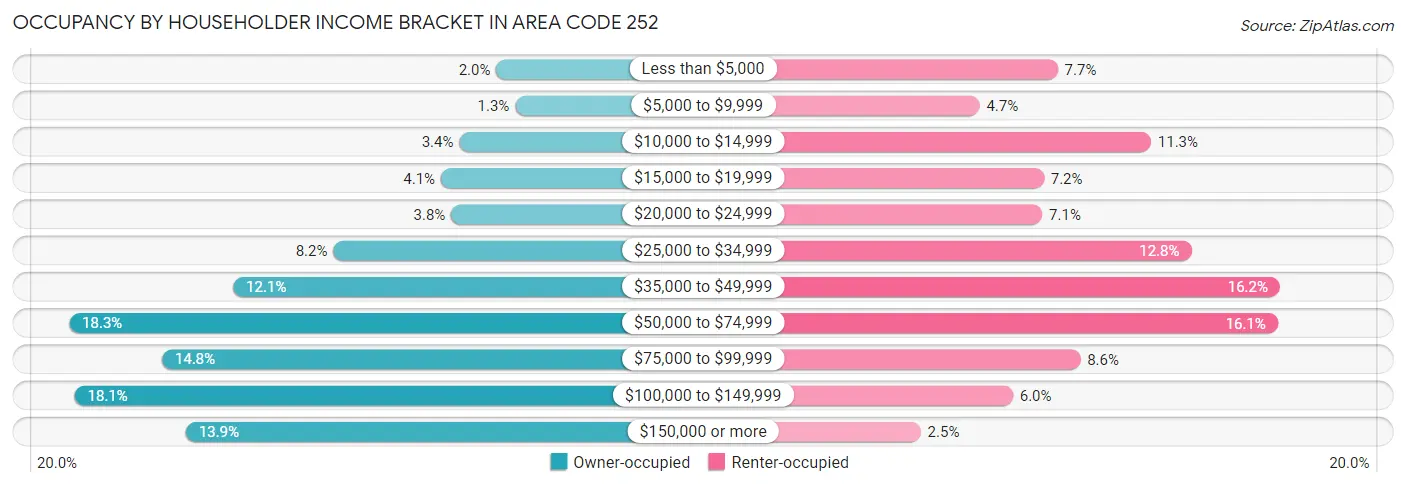
| Income Bracket | Owner-occupied | Renter-occupied |
| Less than $5,000 | 5,715 (2.0%) | 11,770 (7.7%) |
| $5,000 to $9,999 | 3,697 (1.3%) | 7,217 (4.7%) |
| $10,000 to $14,999 | 9,694 (3.4%) | 17,214 (11.3%) |
| $15,000 to $19,999 | 11,682 (4.1%) | 10,973 (7.2%) |
| $20,000 to $24,999 | 10,568 (3.7%) | 10,870 (7.1%) |
| $25,000 to $34,999 | 23,234 (8.2%) | 19,568 (12.8%) |
| $35,000 to $49,999 | 34,005 (12.1%) | 24,716 (16.2%) |
| $50,000 to $74,999 | 51,637 (18.3%) | 24,591 (16.1%) |
| $75,000 to $99,999 | 41,665 (14.8%) | 13,090 (8.6%) |
| $100,000 to $149,999 | 51,034 (18.1%) | 9,156 (6.0%) |
| $150,000 or more | 39,089 (13.9%) | 3,787 (2.5%) |
| Total | 282,020 (100.0%) | 152,952 (100.0%) |
Monthly Housing Cost Tiers in Area Code 252
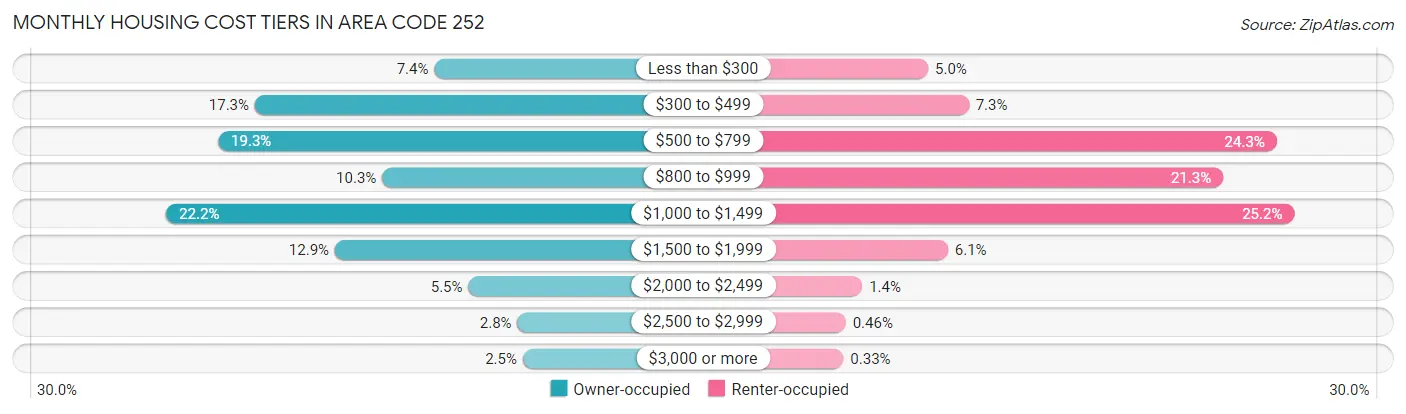
| Monthly Cost | Owner-occupied | Renter-occupied |
| Less than $300 | 20,792 (7.4%) | 7,666 (5.0%) |
| $300 to $499 | 48,728 (17.3%) | 11,092 (7.2%) |
| $500 to $799 | 54,494 (19.3%) | 37,111 (24.3%) |
| $800 to $999 | 28,893 (10.2%) | 32,576 (21.3%) |
| $1,000 to $1,499 | 62,540 (22.2%) | 38,589 (25.2%) |
| $1,500 to $1,999 | 36,265 (12.9%) | 9,326 (6.1%) |
| $2,000 to $2,499 | 15,483 (5.5%) | 2,088 (1.4%) |
| $2,500 to $2,999 | 7,830 (2.8%) | 705 (0.5%) |
| $3,000 or more | 6,995 (2.5%) | 511 (0.3%) |
| Total | 282,020 (100.0%) | 152,952 (100.0%) |
Physical Housing Characteristics in Area Code 252
Housing Structures in Area Code 252
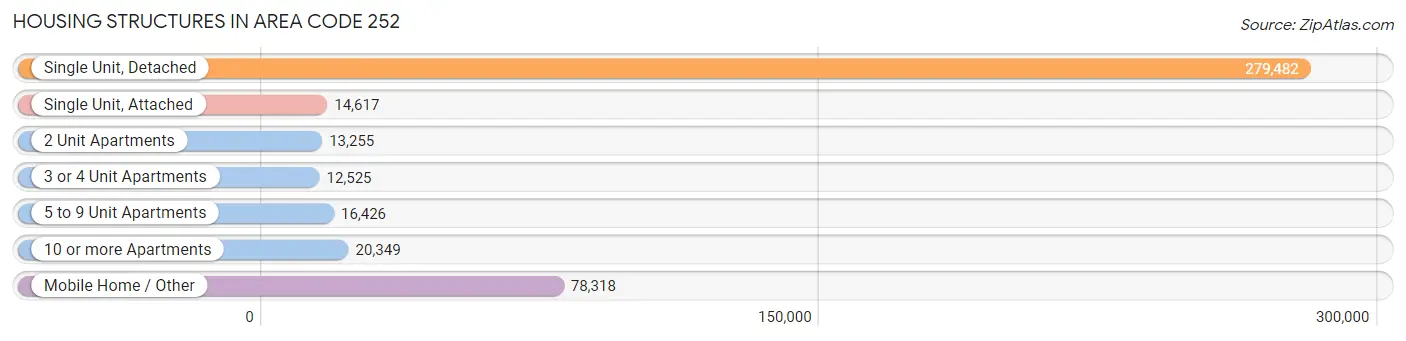
| Structure Type | # Housing Units | % Housing Units |
| Single Unit, Detached | 279,482 | 64.2% |
| Single Unit, Attached | 14,617 | 3.4% |
| 2 Unit Apartments | 13,255 | 3.0% |
| 3 or 4 Unit Apartments | 12,525 | 2.9% |
| 5 to 9 Unit Apartments | 16,426 | 3.8% |
| 10 or more Apartments | 20,349 | 4.7% |
| Mobile Home / Other | 78,318 | 18.0% |
| Total | 434,972 | 100.0% |
Housing Structures by Occupancy in Area Code 252
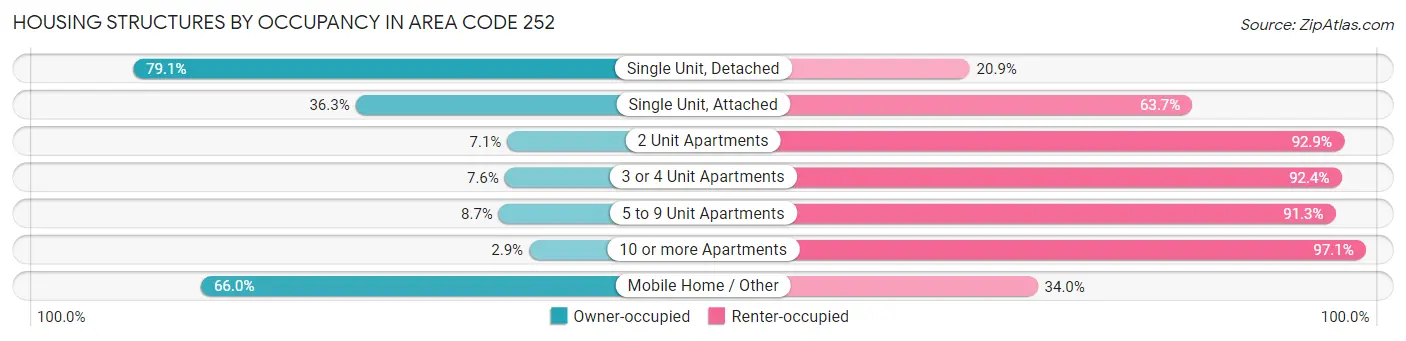
| Structure Type | Owner-occupied | Renter-occupied |
| Single Unit, Detached | 221,089 (79.1%) | 58,393 (20.9%) |
| Single Unit, Attached | 5,305 (36.3%) | 9,312 (63.7%) |
| 2 Unit Apartments | 940 (7.1%) | 12,315 (92.9%) |
| 3 or 4 Unit Apartments | 949 (7.6%) | 11,576 (92.4%) |
| 5 to 9 Unit Apartments | 1,433 (8.7%) | 14,993 (91.3%) |
| 10 or more Apartments | 588 (2.9%) | 19,761 (97.1%) |
| Mobile Home / Other | 51,716 (66.0%) | 26,602 (34.0%) |
| Total | 282,020 (64.8%) | 152,952 (35.2%) |
Housing Structures by Number of Rooms in Area Code 252
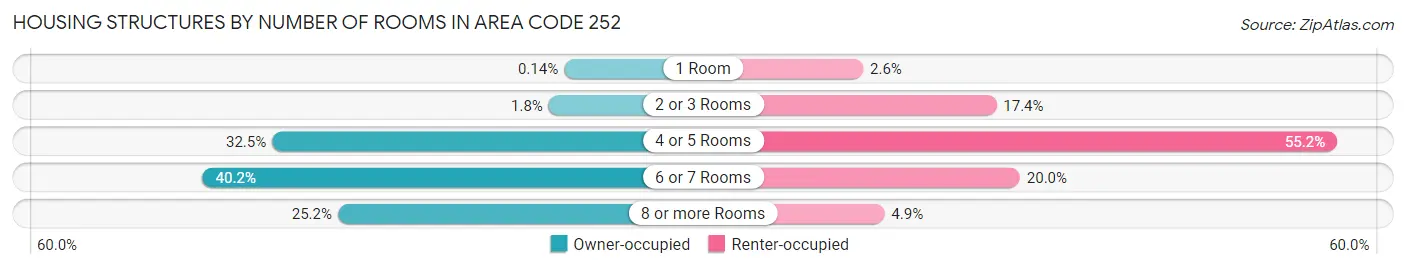
| Number of Rooms | Owner-occupied | Renter-occupied |
| 1 Room | 395 (0.1%) | 3,930 (2.6%) |
| 2 or 3 Rooms | 5,190 (1.8%) | 26,548 (17.4%) |
| 4 or 5 Rooms | 91,770 (32.5%) | 84,375 (55.2%) |
| 6 or 7 Rooms | 113,480 (40.2%) | 30,538 (20.0%) |
| 8 or more Rooms | 71,185 (25.2%) | 7,561 (4.9%) |
| Total | 282,020 (100.0%) | 152,952 (100.0%) |
Housing Structure by Heating Type in Area Code 252
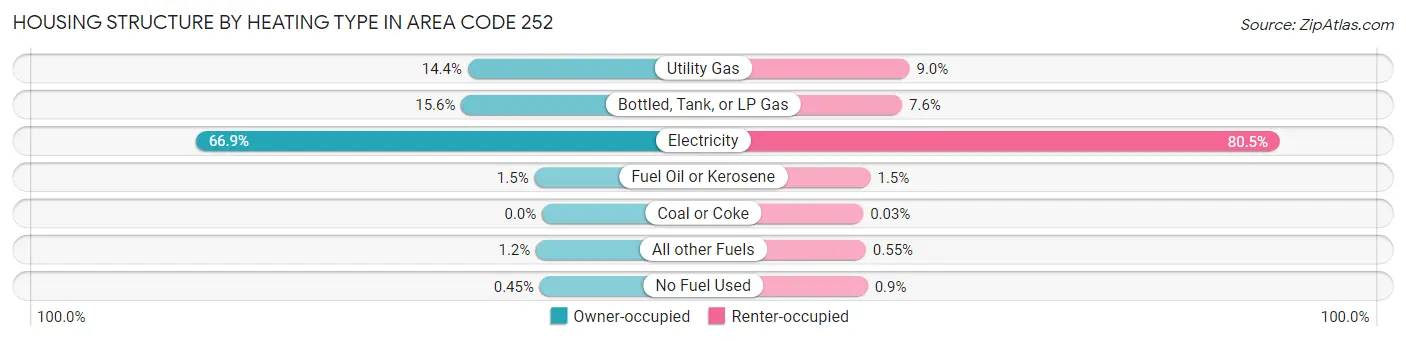
| Heating Type | Owner-occupied | Renter-occupied |
| Utility Gas | 40,498 (14.4%) | 13,740 (9.0%) |
| Bottled, Tank, or LP Gas | 44,038 (15.6%) | 11,550 (7.5%) |
| Electricity | 188,768 (66.9%) | 123,186 (80.5%) |
| Fuel Oil or Kerosene | 4,156 (1.5%) | 2,211 (1.5%) |
| Coal or Coke | 6 (0.0%) | 41 (0.0%) |
| All other Fuels | 3,273 (1.2%) | 841 (0.5%) |
| No Fuel Used | 1,281 (0.4%) | 1,383 (0.9%) |
| Total | 282,020 (100.0%) | 152,952 (100.0%) |
Household Vehicle Usage in Area Code 252
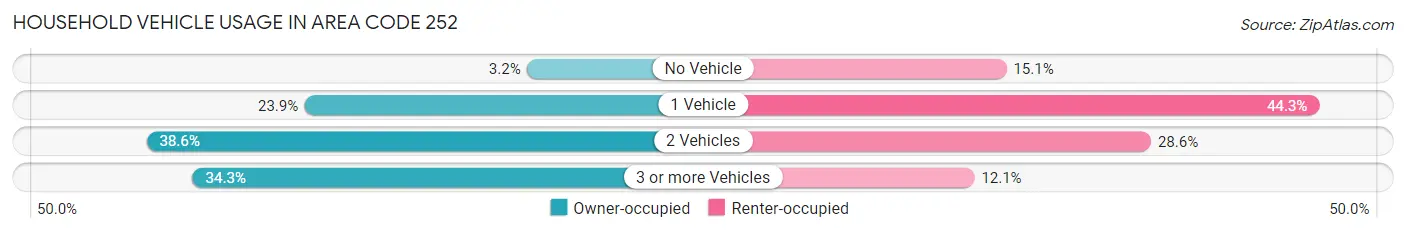
| Vehicles per Household | Owner-occupied | Renter-occupied |
| No Vehicle | 8,890 (3.2%) | 23,060 (15.1%) |
| 1 Vehicle | 67,445 (23.9%) | 67,711 (44.3%) |
| 2 Vehicles | 108,921 (38.6%) | 43,694 (28.6%) |
| 3 or more Vehicles | 96,764 (34.3%) | 18,487 (12.1%) |
| Total | 282,020 (100.0%) | 152,952 (100.0%) |
Real Estate & Mortgages in Area Code 252
Real Estate and Mortgage Overview in Area Code 252
| Characteristic | Without Mortgage | With Mortgage |
| Housing Units | 125,840 | 156,180 |
| Median Property Value | $21,024,699 | $31,757,600 |
| Median Household Income | $7,927,445 | $27,557 |
| Monthly Housing Costs | $79,184 | $6,738 |
| Real Estate Taxes | $174,767 | $3,308 |
Property Value by Mortgage Status in Area Code 252
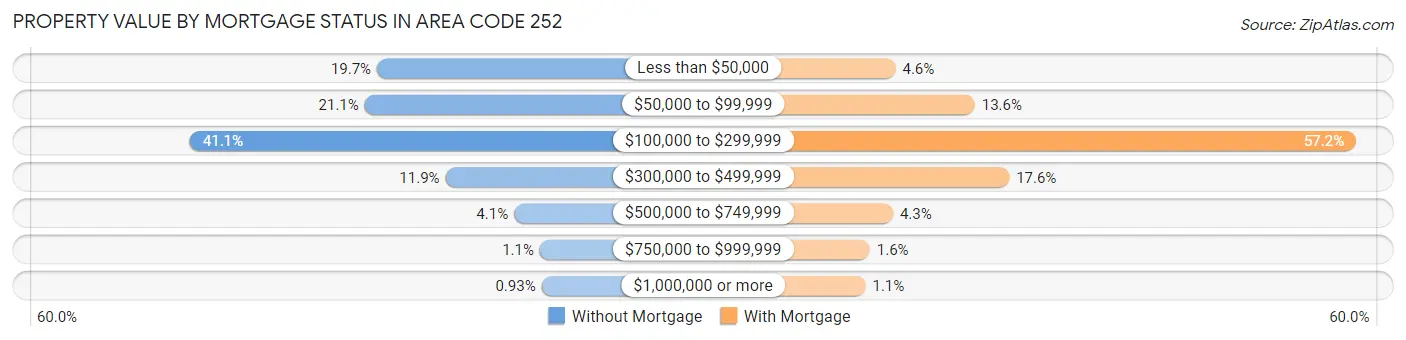
| Property Value | Without Mortgage | With Mortgage |
| Less than $50,000 | 24,830 (19.7%) | 7,130 (4.6%) |
| $50,000 to $99,999 | 26,607 (21.1%) | 21,282 (13.6%) |
| $100,000 to $299,999 | 51,729 (41.1%) | 89,322 (57.2%) |
| $300,000 to $499,999 | 14,985 (11.9%) | 27,423 (17.6%) |
| $500,000 to $749,999 | 5,119 (4.1%) | 6,687 (4.3%) |
| $750,000 to $999,999 | 1,405 (1.1%) | 2,548 (1.6%) |
| $1,000,000 or more | 1,165 (0.9%) | 1,788 (1.1%) |
| Total | 125,840 (100.0%) | 156,180 (100.0%) |
Household Income by Mortgage Status in Area Code 252
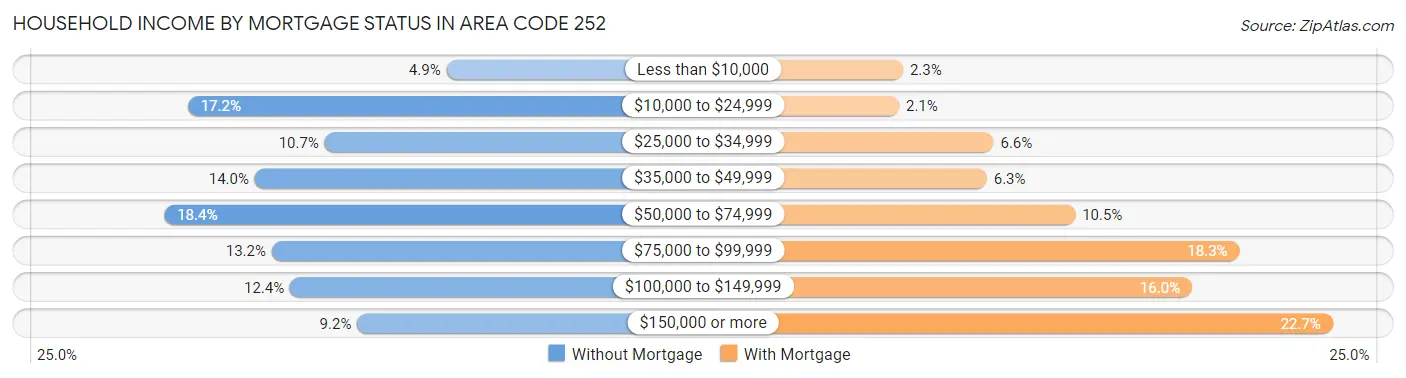
| Household Income | Without Mortgage | With Mortgage |
| Less than $10,000 | 6,179 (4.9%) | 3,523 (2.3%) |
| $10,000 to $24,999 | 21,688 (17.2%) | 3,233 (2.1%) |
| $25,000 to $34,999 | 13,480 (10.7%) | 10,256 (6.6%) |
| $35,000 to $49,999 | 17,666 (14.0%) | 9,754 (6.2%) |
| $50,000 to $74,999 | 23,090 (18.3%) | 16,339 (10.5%) |
| $75,000 to $99,999 | 16,651 (13.2%) | 28,547 (18.3%) |
| $100,000 to $149,999 | 15,554 (12.4%) | 25,014 (16.0%) |
| $150,000 or more | 11,532 (9.2%) | 35,480 (22.7%) |
| Total | 125,840 (100.0%) | 156,180 (100.0%) |
Property Value to Household Income Ratio in Area Code 252
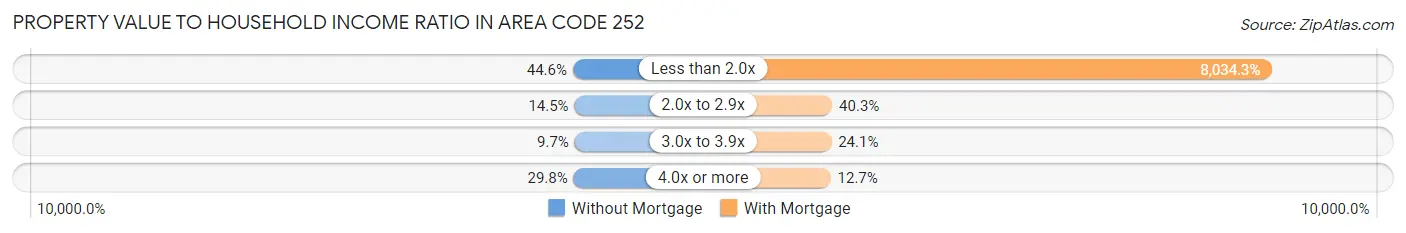
| Value-to-Income Ratio | Without Mortgage | With Mortgage |
| Less than 2.0x | 56,115 (44.6%) | 12,547,887 (8,034.3%) |
| 2.0x to 2.9x | 18,254 (14.5%) | 62,978 (40.3%) |
| 3.0x to 3.9x | 12,227 (9.7%) | 37,574 (24.1%) |
| 4.0x or more | 37,521 (29.8%) | 19,895 (12.7%) |
| Total | 125,840 (100.0%) | 156,180 (100.0%) |
Real Estate Taxes by Mortgage Status in Area Code 252
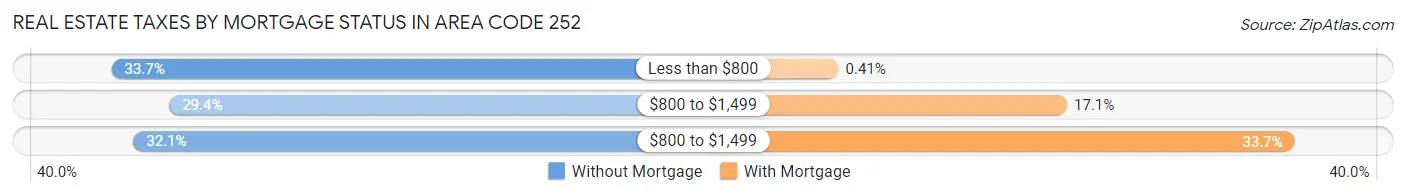
| Property Taxes | Without Mortgage | With Mortgage |
| Less than $800 | 42,340 (33.7%) | 634 (0.4%) |
| $800 to $1,499 | 37,030 (29.4%) | 26,708 (17.1%) |
| $800 to $1,499 | 40,331 (32.1%) | 52,657 (33.7%) |
| Total | 125,840 (100.0%) | 156,180 (100.0%) |
Health & Disability in Area Code 252
Health Insurance Coverage by Age in Area Code 252
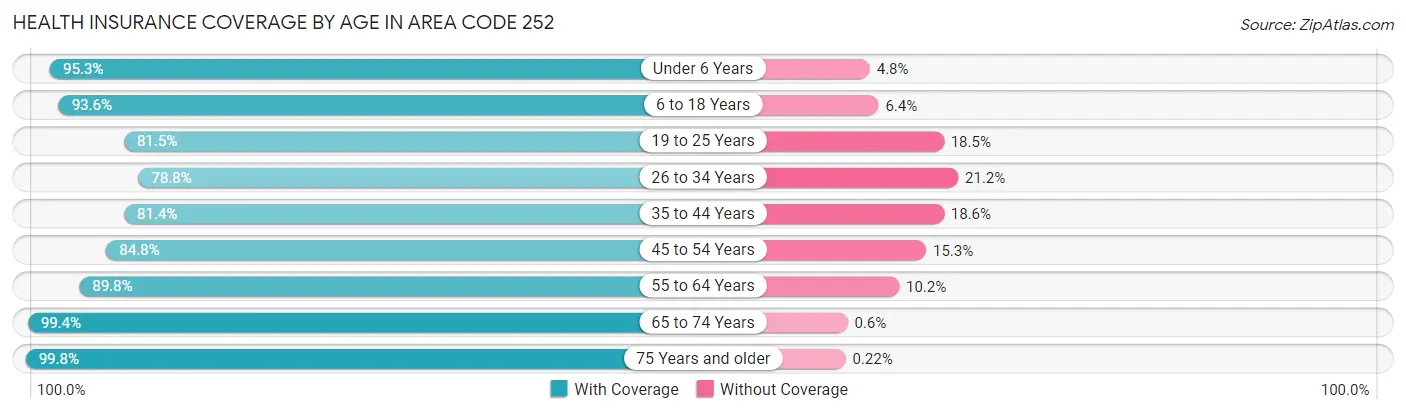
| Age Bracket | With Coverage | Without Coverage |
| Under 6 Years | 64,393 (95.3%) | 3,212 (4.8%) |
| 6 to 18 Years | 158,448 (93.6%) | 10,783 (6.4%) |
| 19 to 25 Years | 75,913 (81.5%) | 17,282 (18.5%) |
| 26 to 34 Years | 86,835 (78.8%) | 23,392 (21.2%) |
| 35 to 44 Years | 93,483 (81.4%) | 21,318 (18.6%) |
| 45 to 54 Years | 105,674 (84.8%) | 19,013 (15.2%) |
| 55 to 64 Years | 133,474 (89.8%) | 15,180 (10.2%) |
| 65 to 74 Years | 125,810 (99.4%) | 754 (0.6%) |
| 75 Years and older | 80,172 (99.8%) | 178 (0.2%) |
| Total | 924,202 (89.3%) | 111,112 (10.7%) |
Health Insurance Coverage by Citizenship Status in Area Code 252
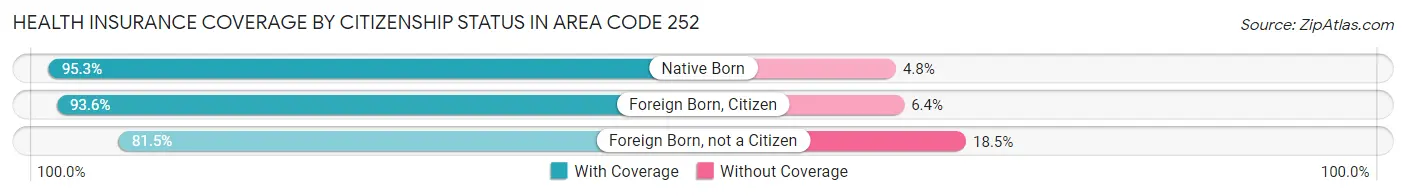
| Citizenship Status | With Coverage | Without Coverage |
| Native Born | 64,393 (95.3%) | 3,212 (4.8%) |
| Foreign Born, Citizen | 158,448 (93.6%) | 10,783 (6.4%) |
| Foreign Born, not a Citizen | 75,913 (81.5%) | 17,282 (18.5%) |
Health Insurance Coverage by Household Income in Area Code 252
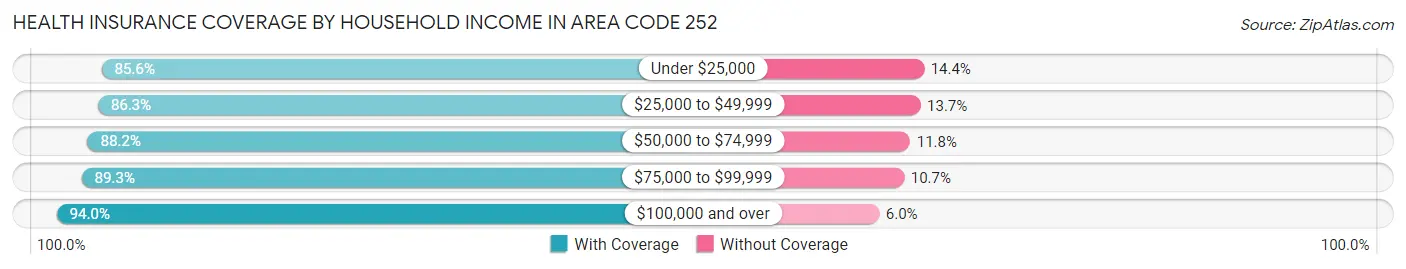
| Household Income | With Coverage | Without Coverage |
| Under $25,000 | 148,263 (85.6%) | 24,952 (14.4%) |
| $25,000 to $49,999 | 187,208 (86.3%) | 29,797 (13.7%) |
| $50,000 to $74,999 | 160,988 (88.2%) | 21,542 (11.8%) |
| $75,000 to $99,999 | 130,286 (89.3%) | 15,579 (10.7%) |
| $100,000 and over | 287,160 (94.0%) | 18,342 (6.0%) |
Public vs Private Health Insurance Coverage by Age in Area Code 252
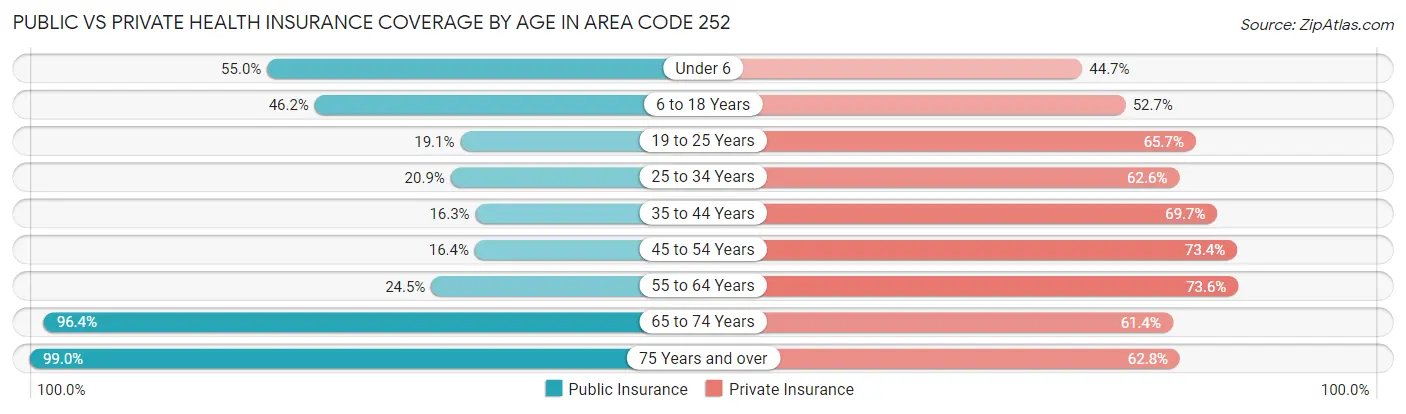
| Age Bracket | Public Insurance | Private Insurance |
| Under 6 | 37,172 (55.0%) | 30,186 (44.7%) |
| 6 to 18 Years | 78,100 (46.2%) | 89,189 (52.7%) |
| 19 to 25 Years | 17,831 (19.1%) | 61,216 (65.7%) |
| 25 to 34 Years | 23,056 (20.9%) | 69,016 (62.6%) |
| 35 to 44 Years | 18,741 (16.3%) | 80,008 (69.7%) |
| 45 to 54 Years | 20,496 (16.4%) | 91,486 (73.4%) |
| 55 to 64 Years | 36,471 (24.5%) | 109,359 (73.6%) |
| 65 to 74 Years | 122,044 (96.4%) | 77,738 (61.4%) |
| 75 Years and over | 79,546 (99.0%) | 50,420 (62.7%) |
| Total | 433,457 (41.9%) | 658,618 (63.6%) |
Disability Status by Sex by Age in Area Code 252
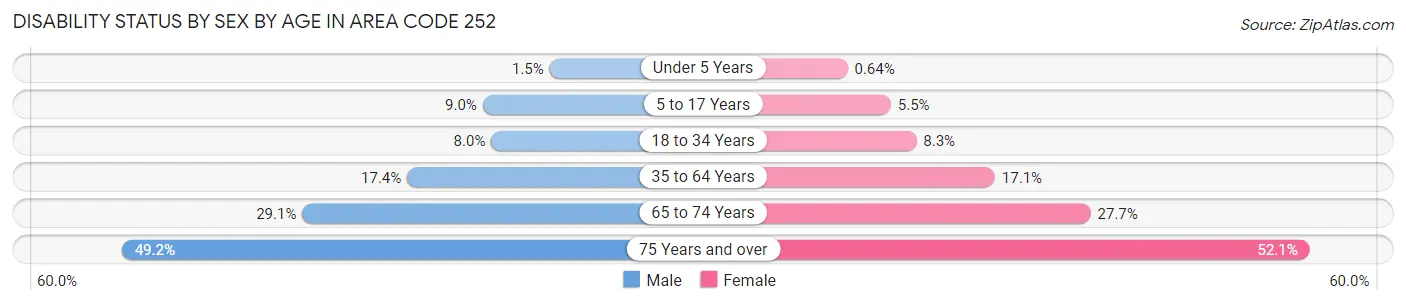
| Age Bracket | Male | Female |
| Under 5 Years | 447 (1.5%) | 174 (0.6%) |
| 5 to 17 Years | 7,615 (9.0%) | 4,408 (5.5%) |
| 18 to 34 Years | 8,564 (8.0%) | 9,299 (8.3%) |
| 35 to 64 Years | 32,019 (17.4%) | 34,805 (17.1%) |
| 65 to 74 Years | 17,056 (29.1%) | 18,821 (27.7%) |
| 75 Years and over | 16,112 (49.2%) | 24,791 (52.1%) |
Disability Class by Sex by Age in Area Code 252
Disability Class: Hearing Difficulty
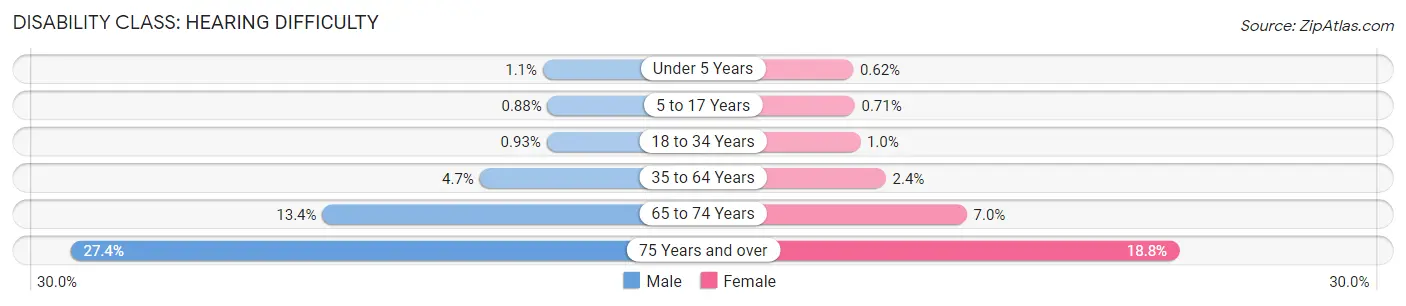
| Age Bracket | Male | Female |
| Under 5 Years | 333 (1.1%) | 167 (0.6%) |
| 5 to 17 Years | 745 (0.9%) | 571 (0.7%) |
| 18 to 34 Years | 994 (0.9%) | 1,129 (1.0%) |
| 35 to 64 Years | 8,580 (4.7%) | 4,990 (2.4%) |
| 65 to 74 Years | 7,870 (13.4%) | 4,720 (7.0%) |
| 75 Years and over | 8,988 (27.4%) | 8,934 (18.8%) |
Disability Class: Vision Difficulty
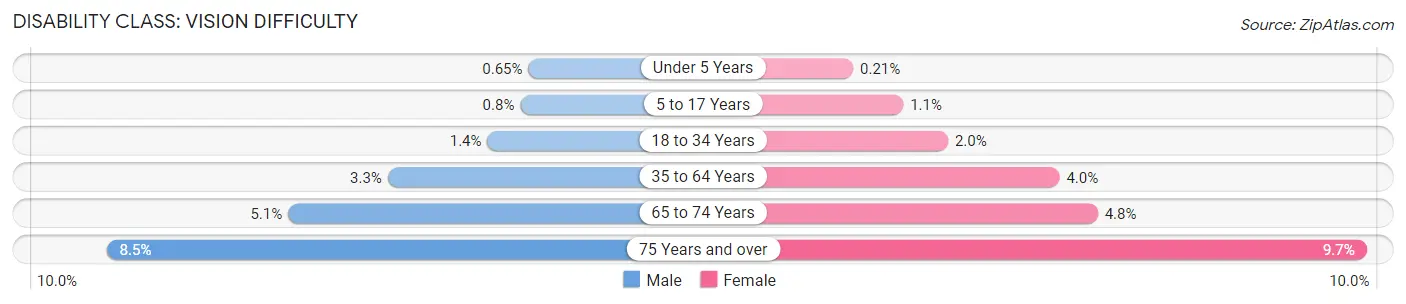
| Age Bracket | Male | Female |
| Under 5 Years | 190 (0.6%) | 57 (0.2%) |
| 5 to 17 Years | 675 (0.8%) | 922 (1.1%) |
| 18 to 34 Years | 1,500 (1.4%) | 2,206 (2.0%) |
| 35 to 64 Years | 6,004 (3.3%) | 8,240 (4.0%) |
| 65 to 74 Years | 2,997 (5.1%) | 3,228 (4.8%) |
| 75 Years and over | 2,778 (8.5%) | 4,637 (9.7%) |
Disability Class: Cognitive Difficulty
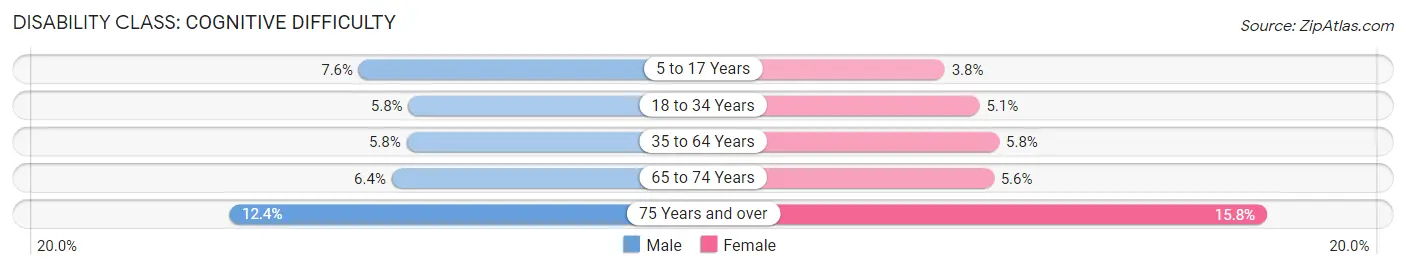
| Age Bracket | Male | Female |
| 5 to 17 Years | 6,431 (7.6%) | 3,086 (3.8%) |
| 18 to 34 Years | 6,132 (5.8%) | 5,720 (5.1%) |
| 35 to 64 Years | 10,708 (5.8%) | 11,922 (5.8%) |
| 65 to 74 Years | 3,733 (6.4%) | 3,833 (5.6%) |
| 75 Years and over | 4,064 (12.4%) | 7,509 (15.8%) |
Disability Class: Ambulatory Difficulty
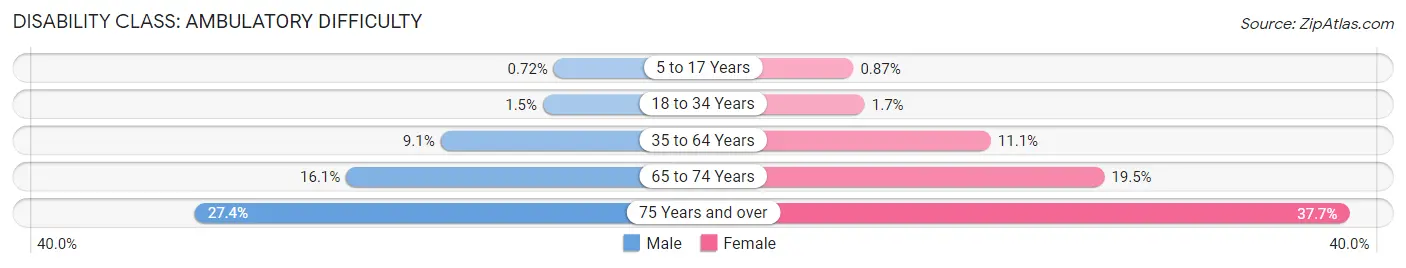
| Age Bracket | Male | Female |
| 5 to 17 Years | 609 (0.7%) | 702 (0.9%) |
| 18 to 34 Years | 1,618 (1.5%) | 1,914 (1.7%) |
| 35 to 64 Years | 16,778 (9.1%) | 22,594 (11.1%) |
| 65 to 74 Years | 9,460 (16.1%) | 13,242 (19.5%) |
| 75 Years and over | 8,962 (27.4%) | 17,933 (37.7%) |
Disability Class: Self-Care Difficulty
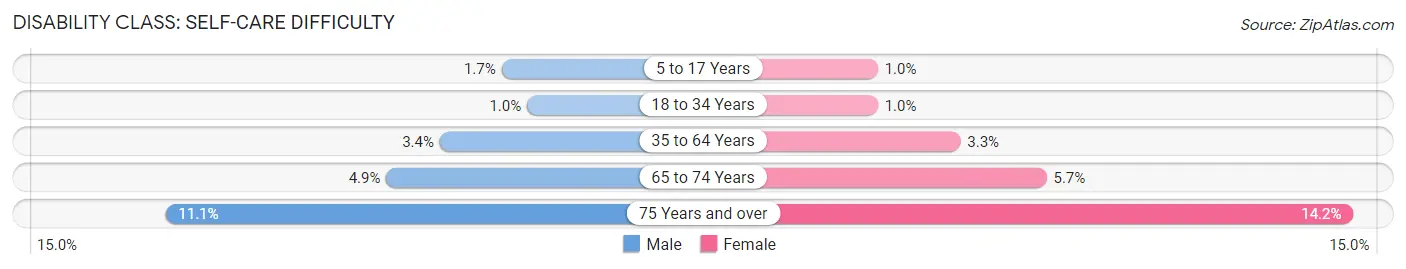
| Age Bracket | Male | Female |
| 5 to 17 Years | 1,457 (1.7%) | 806 (1.0%) |
| 18 to 34 Years | 1,078 (1.0%) | 1,116 (1.0%) |
| 35 to 64 Years | 6,336 (3.4%) | 6,730 (3.3%) |
| 65 to 74 Years | 2,892 (4.9%) | 3,870 (5.7%) |
| 75 Years and over | 3,630 (11.1%) | 6,775 (14.2%) |
Technology Access in Area Code 252
Computing Device Access in Area Code 252
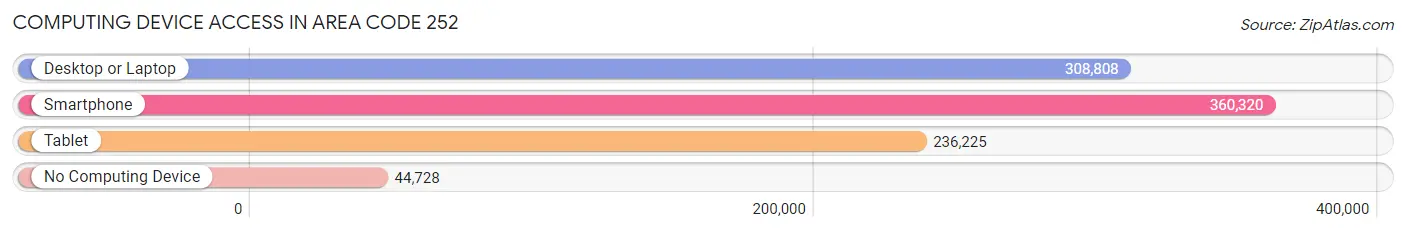
| Device Type | # Households | % Households |
| Desktop or Laptop | 308,808 | 71.0% |
| Smartphone | 360,320 | 82.8% |
| Tablet | 236,225 | 54.3% |
| No Computing Device | 44,728 | 10.3% |
| Total | 434,972 | 100.0% |
Internet Access in Area Code 252
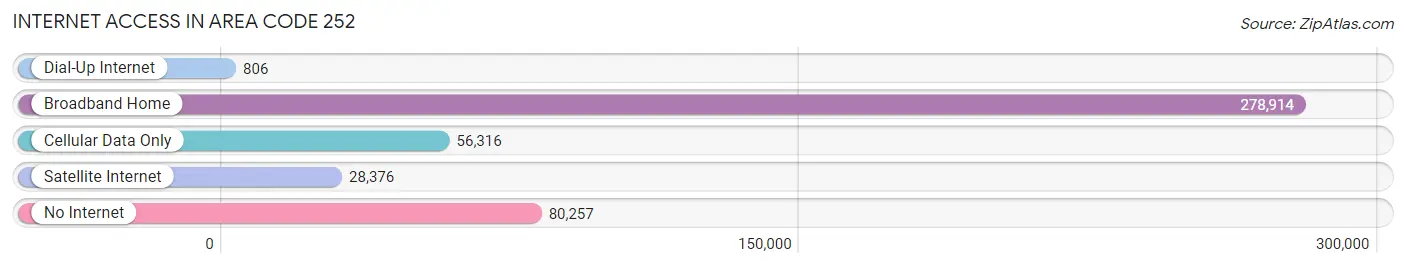
| Internet Type | # Households | % Households |
| Dial-Up Internet | 806 | 0.2% |
| Broadband Home | 278,914 | 64.1% |
| Cellular Data Only | 56,316 | 13.0% |
| Satellite Internet | 28,376 | 6.5% |
| No Internet | 80,257 | 18.4% |
| Total | 434,972 | 100.0% |
Area Code 252 Summary
Geography
Area code 252 is located in the eastern part of North Carolina, covering the Outer Banks and the northeastern part of the state. It includes the cities of Greenville, New Bern, Rocky Mount, and Elizabeth City.
Social
Area code 252 is home to a diverse population, with a mix of rural and urban communities. The area is known for its beautiful beaches, outdoor activities, and cultural attractions.
Economics
Area code 252 is an economically diverse region, with a mix of industries including agriculture, manufacturing, and tourism. The area is home to several major employers, including East Carolina University, Vidant Medical Center, and the Marine Corps Air Station Cherry Point.
Demographics
Area code 252 is home to a population of over 1.2 million people, with a median age of 38. The area is predominantly white, with African Americans making up the largest minority group. The median household income is $45,000, and the poverty rate is 17%.
Common Questions
What is Per Capita Income in Area Code 252?
Per Capita income in Area Code 252 is $31,098.
What is the Median Family Income in Area Code 252?
Median Family Income in Area Code 252 is $70,855.
What is the Median Household income in Area Code 252?
Median Household Income in Area Code 252 is $55,349.
What is Income or Wage Gap in Area Code 252?
Income or Wage Gap in Area Code 252 is 26.4%.
Women in Area Code 252 earn 73.6 cents for every dollar earned by a man.
What is Family Income Deficit in Area Code 252?
Family Income Deficit in Area Code 252 is $10,270.
Families that are below poverty line in Area Code 252 earn $10,270 less on average than the poverty threshold level.
What is Inequality or Gini Index in Area Code 252?
Inequality or Gini Index in Area Code 252 is 75.19.
What is the Total Population of Area Code 252?
Total Population of Area Code 252 is 1,062,465.
What is the Total Male Population of Area Code 252?
Total Male Population of Area Code 252 is 517,863.
What is the Total Female Population of Area Code 252?
Total Female Population of Area Code 252 is 544,602.
What is the Ratio of Males per 100 Females in Area Code 252?
There are 95.09 Males per 100 Females in Area Code 252.
What is the Ratio of Females per 100 Males in Area Code 252?
There are 105.16 Females per 100 Males in Area Code 252.
What is the Median Population Age in Area Code 252?
Median Population Age in Area Code 252 is 46.0 Years.
What is the Average Family Size in Area Code 252
Average Family Size in Area Code 252 is 2.9 People.
What is the Average Household Size in Area Code 252
Average Household Size in Area Code 252 is 2.3 People.
How Large is the Labor Force in Area Code 252?
There are 489,949 People in the Labor Forcein in Area Code 252.
What is the Percentage of People in the Labor Force in Area Code 252?
56.5% of People are in the Labor Force in Area Code 252.
What is the Unemployment Rate in Area Code 252?
Unemployment Rate in Area Code 252 is 7.6%.