Area Code 352 Map & Demographics
Area Code 352 Map
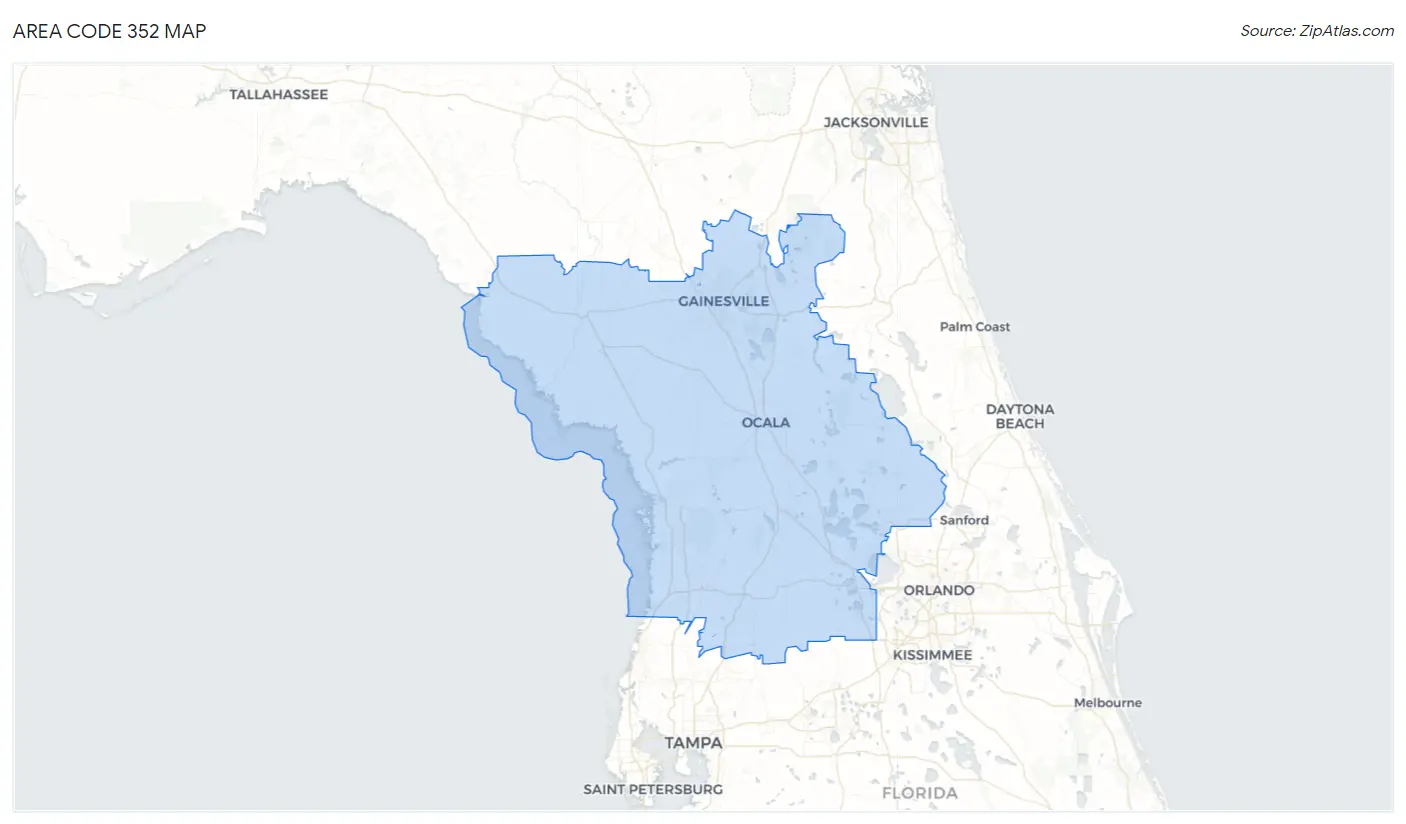
Area Code 352 Overview
$31,684
PER CAPITA INCOME
$72,308
AVG FAMILY INCOME
$59,860
AVG HOUSEHOLD INCOME
23.6%
WAGE / INCOME GAP [ % ]
76.4¢/ $1
WAGE / INCOME GAP [ $ ]
$10,564
FAMILY INCOME DEFICIT
51.74
INEQUALITY / GINI INDEX
1,668,150
TOTAL POPULATION
815,237
MALE POPULATION
852,913
FEMALE POPULATION
95.58
MALES / 100 FEMALES
104.62
FEMALES / 100 MALES
48.0
MEDIAN AGE
2.9
AVG FAMILY SIZE
2.4
AVG HOUSEHOLD SIZE
697,030
LABOR FORCE [ PEOPLE ]
49.4%
PERCENT IN LABOR FORCE
6.5%
UNEMPLOYMENT RATE
Income in Area Code 352
Income Overview in Area Code 352
Per Capita Income in Area Code 352 is $31,684, while median incomes of families and households are $72,308 and $59,860 respectively.
| Characteristic | Number | Measure |
| Per Capita Income | 1,668,150 | $31,684 |
| Median Family Income | 438,185 | $72,308 |
| Mean Family Income | 438,185 | $10,782,357 |
| Median Household Income | 682,316 | $59,860 |
| Mean Household Income | 682,316 | $9,204,458 |
| Income Deficit | 438,185 | $10,564 |
| Wage / Income Gap (%) | 1,668,150 | 23.65% |
| Wage / Income Gap ($) | 1,668,150 | 76.35¢ per $1 |
| Gini / Inequality Index | 1,668,150 | 51.74 |
Earnings by Sex in Area Code 352
Average Earnings in Area Code 352 are $35,175, $40,293 for men and $30,723 for women, a difference of 23.7%.
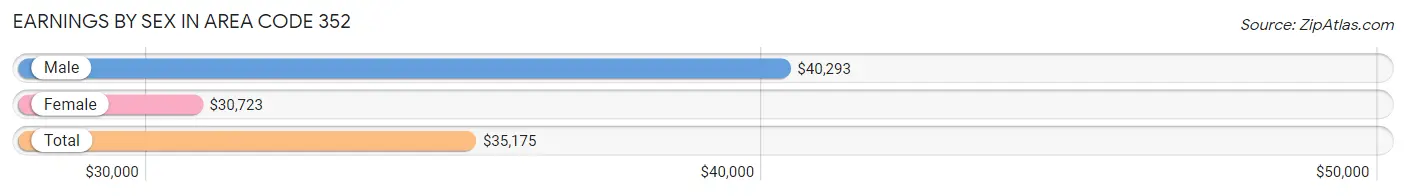
| Sex | Number | Average Earnings |
| Male | 373,703 (51.6%) | $40,293 |
| Female | 350,899 (48.4%) | $30,723 |
| Total | 724,602 (100.0%) | $35,175 |
Earnings by Sex by Income Bracket in Area Code 352
The most common earnings brackets in Area Code 352 are $100,000+ for men (44,479 | 11.9%) and $25,000 to $29,999 for women (30,215 | 8.6%).
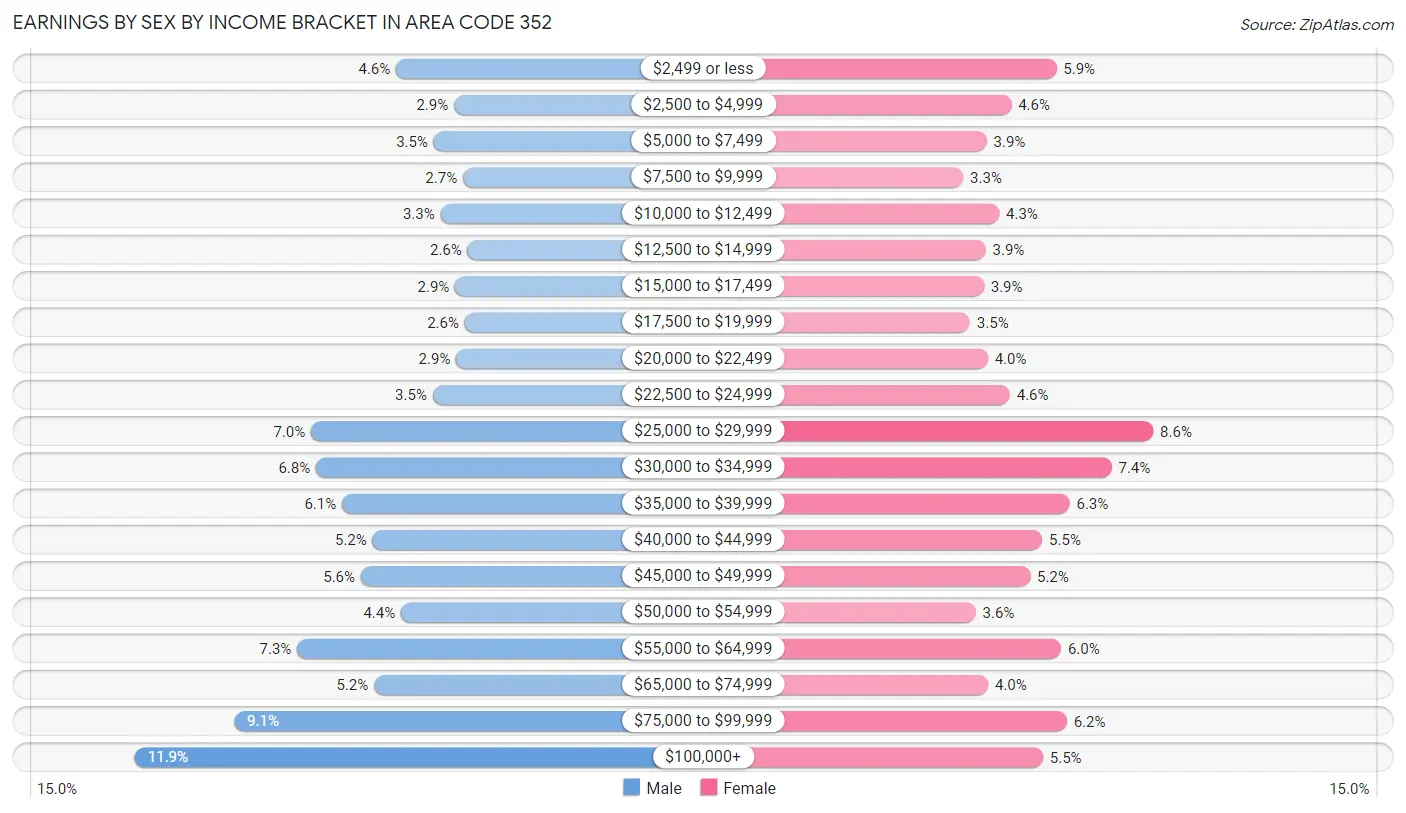
| Income | Male | Female |
| $2,499 or less | 17,052 (4.6%) | 20,664 (5.9%) |
| $2,500 to $4,999 | 10,958 (2.9%) | 16,220 (4.6%) |
| $5,000 to $7,499 | 13,065 (3.5%) | 13,778 (3.9%) |
| $7,500 to $9,999 | 10,023 (2.7%) | 11,487 (3.3%) |
| $10,000 to $12,499 | 12,368 (3.3%) | 15,035 (4.3%) |
| $12,500 to $14,999 | 9,515 (2.5%) | 13,701 (3.9%) |
| $15,000 to $17,499 | 10,822 (2.9%) | 13,499 (3.8%) |
| $17,500 to $19,999 | 9,815 (2.6%) | 12,148 (3.5%) |
| $20,000 to $22,499 | 10,708 (2.9%) | 13,896 (4.0%) |
| $22,500 to $24,999 | 13,180 (3.5%) | 16,083 (4.6%) |
| $25,000 to $29,999 | 25,983 (7.0%) | 30,215 (8.6%) |
| $30,000 to $34,999 | 25,449 (6.8%) | 26,119 (7.4%) |
| $35,000 to $39,999 | 22,728 (6.1%) | 21,953 (6.3%) |
| $40,000 to $44,999 | 19,503 (5.2%) | 19,251 (5.5%) |
| $45,000 to $49,999 | 20,741 (5.6%) | 18,081 (5.1%) |
| $50,000 to $54,999 | 16,503 (4.4%) | 12,693 (3.6%) |
| $55,000 to $64,999 | 27,435 (7.3%) | 21,126 (6.0%) |
| $65,000 to $74,999 | 19,345 (5.2%) | 13,927 (4.0%) |
| $75,000 to $99,999 | 34,031 (9.1%) | 21,675 (6.2%) |
| $100,000+ | 44,479 (11.9%) | 19,348 (5.5%) |
| Total | 373,703 (100.0%) | 350,899 (100.0%) |
Earnings by Sex by Educational Attainment in Area Code 352
Average earnings in Area Code 352 are $5,095,036 for men and $3,897,052 for women, a difference of 23.5%. Men with an educational attainment of bachelor's degree enjoy the highest average annual earnings of $5,057,590, while those with less than high school education earn the least with $2,807,792. Women with an educational attainment of graduate degree earn the most with the average annual earnings of $5,137,338, while those with less than high school education have the smallest earnings of $1,385,716.
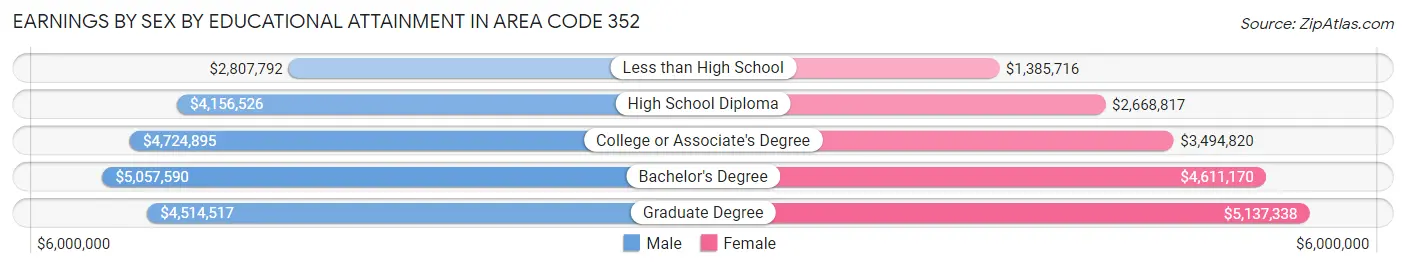
| Educational Attainment | Male Income | Female Income |
| Less than High School | $2,807,792 | $1,385,716 |
| High School Diploma | $4,156,526 | $2,668,817 |
| College or Associate's Degree | $4,724,895 | $3,494,820 |
| Bachelor's Degree | $5,057,590 | $4,611,170 |
| Graduate Degree | $4,514,517 | $5,137,338 |
| Total | $5,095,036 | $3,897,052 |
Family Income in Area Code 352
Family Income Brackets in Area Code 352
According to the Area Code 352 family income data, there are 11,033,498 families falling into the $50,000 to $74,999 income range, which is the most common income bracket and makes up 2,518.0% of all families. Conversely, the $10,000 to $14,999 income bracket is the least frequent group with only 1,086,261 families (247.9%) belonging to this category.
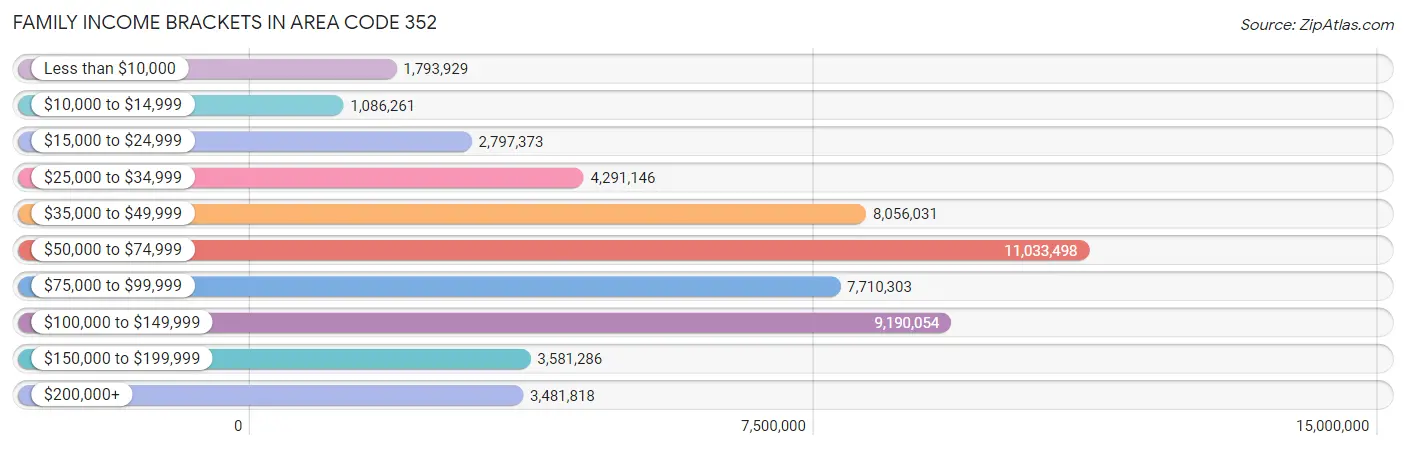
| Income Bracket | # Families | % Families |
| Less than $10,000 | 1,793,929 | 409.4% |
| $10,000 to $14,999 | 1,086,261 | 247.9% |
| $15,000 to $24,999 | 2,797,373 | 638.4% |
| $25,000 to $34,999 | 4,291,146 | 979.3% |
| $35,000 to $49,999 | 8,056,031 | 1,838.5% |
| $50,000 to $74,999 | 11,033,498 | 2,518.0% |
| $75,000 to $99,999 | 7,710,303 | 1,759.6% |
| $100,000 to $149,999 | 9,190,054 | 2,097.3% |
| $150,000 to $199,999 | 3,581,286 | 817.3% |
| $200,000+ | 3,481,818 | 794.6% |
Family Income by Famaliy Size in Area Code 352
7+ person families (5,149 | 1.2%) account for the highest median family income in Area Code 352 with $107,325 per family, while 2-person families (259,445 | 59.2%) have the highest median income of $33,216 per family member.
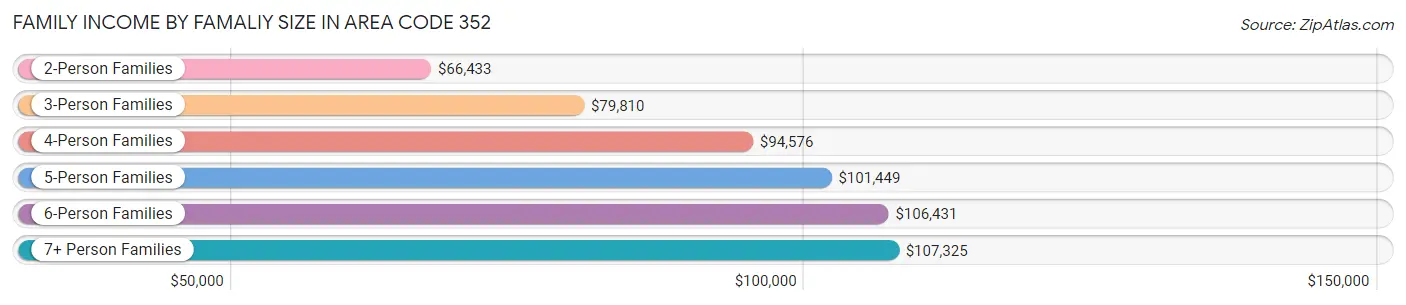
| Income Bracket | # Families | Median Income |
| 2-Person Families | 259,445 (59.2%) | $66,433 |
| 3-Person Families | 83,988 (19.2%) | $79,810 |
| 4-Person Families | 55,089 (12.6%) | $94,576 |
| 5-Person Families | 24,682 (5.6%) | $101,449 |
| 6-Person Families | 9,832 (2.2%) | $106,430 |
| 7+ Person Families | 5,149 (1.2%) | $107,325 |
| Total | 438,185 (100.0%) | $72,308 |
Family Income by Number of Earners in Area Code 352
The median family income in Area Code 352 is $72,308, with families comprising 3+ earners (33,026) having the highest median family income of $133,668, while families with no earners (135,216) have the lowest median family income of $52,927, accounting for 7.5% and 30.9% of families, respectively.
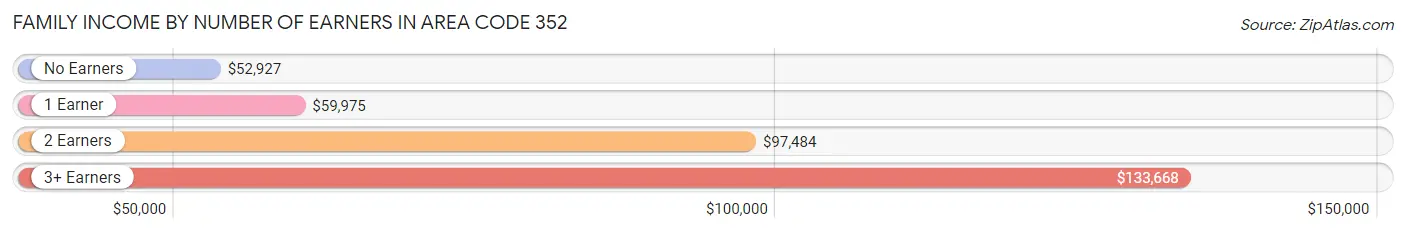
| Number of Earners | # Families | Median Income |
| No Earners | 135,216 (30.9%) | $52,927 |
| 1 Earner | 137,728 (31.4%) | $59,975 |
| 2 Earners | 132,215 (30.2%) | $97,484 |
| 3+ Earners | 33,026 (7.5%) | $133,668 |
| Total | 438,185 (100.0%) | $72,308 |
Household Income in Area Code 352
Household Income Brackets in Area Code 352
With 15,661,881 households falling in the category, the $50,000 to $74,999 income range is the most frequent in Area Code 352, accounting for 2,295.4% of all households. In contrast, only 4,073,427 households (597.0%) fall into the $200,000+ income bracket, making it the least populous group.
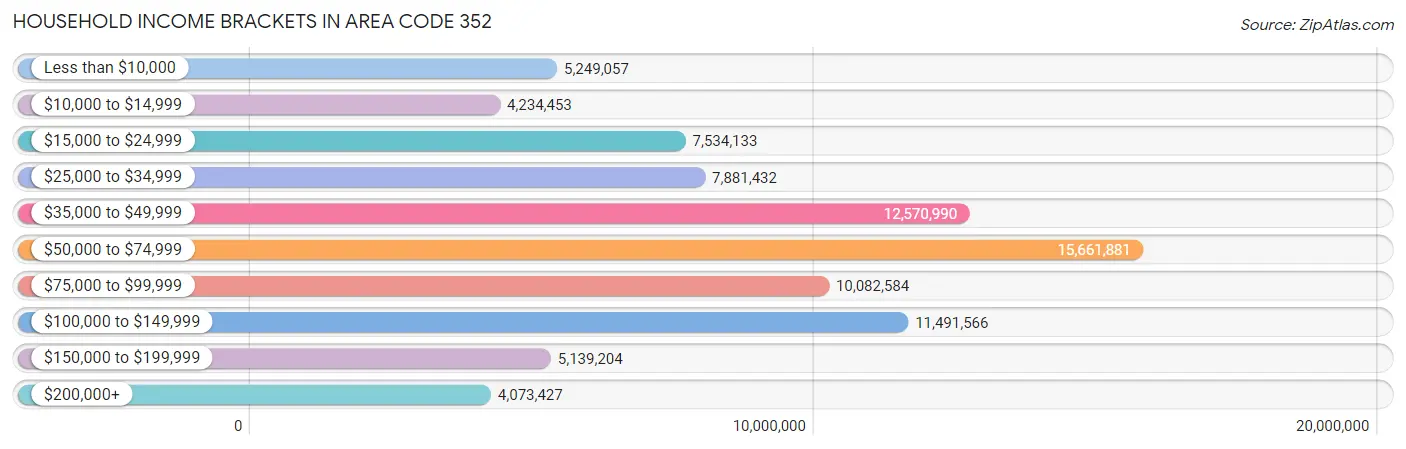
| Income Bracket | # Households | % Households |
| Less than $10,000 | 5,249,057 | 769.3% |
| $10,000 to $14,999 | 4,234,453 | 620.6% |
| $15,000 to $24,999 | 7,534,133 | 1,104.2% |
| $25,000 to $34,999 | 7,881,432 | 1,155.1% |
| $35,000 to $49,999 | 12,570,990 | 1,842.4% |
| $50,000 to $74,999 | 15,661,881 | 2,295.4% |
| $75,000 to $99,999 | 10,082,584 | 1,477.7% |
| $100,000 to $149,999 | 11,491,566 | 1,684.2% |
| $150,000 to $199,999 | 5,139,204 | 753.2% |
| $200,000+ | 4,073,427 | 597.0% |
Household Income by Householder Age in Area Code 352
The median household income in Area Code 352 is $59,860, with the highest median household income of $70,558 found in the 45 to 64 years age bracket for the primary householder. A total of 219,484 households (32.2%) fall into this category. Meanwhile, the 15 to 24 years age bracket for the primary householder has the lowest median household income of $49,007, with 25,326 households (3.7%) in this group.
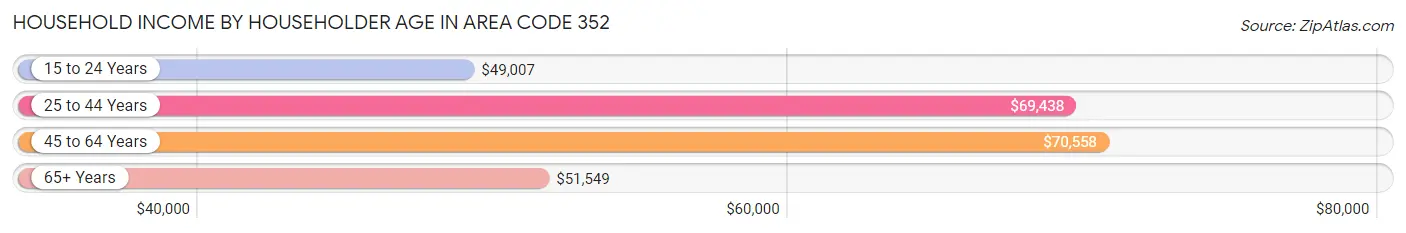
| Income Bracket | # Households | Median Income |
| 15 to 24 Years | 25,326 (3.7%) | $49,007 |
| 25 to 44 Years | 151,287 (22.2%) | $69,438 |
| 45 to 64 Years | 219,484 (32.2%) | $70,558 |
| 65+ Years | 286,219 (41.9%) | $51,549 |
| Total | 682,316 (100.0%) | $59,860 |
Poverty in Area Code 352
Income Below Poverty by Sex and Age in Area Code 352
With 12.6% poverty level for males and 14.8% for females among the residents of Area Code 352, 18 to 24 year old males and 18 to 24 year old females are the most vulnerable to poverty, with 17,864 males (26.2%) and 19,762 females (30.0%) in their respective age groups living below the poverty level.
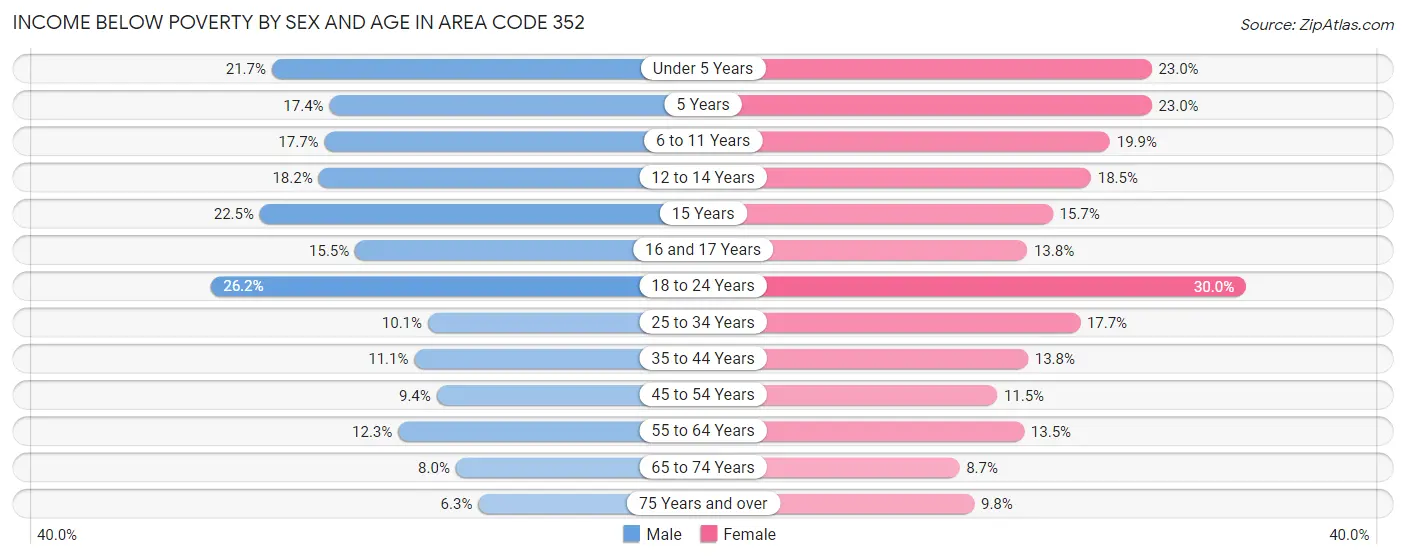
| Age Bracket | Male | Female |
| Under 5 Years | 7,782 (21.6%) | 8,130 (23.0%) |
| 5 Years | 1,275 (17.4%) | 1,523 (23.0%) |
| 6 to 11 Years | 8,480 (17.7%) | 8,991 (19.9%) |
| 12 to 14 Years | 5,048 (18.2%) | 4,806 (18.5%) |
| 15 Years | 2,120 (22.5%) | 1,278 (15.7%) |
| 16 and 17 Years | 2,581 (15.5%) | 2,299 (13.8%) |
| 18 to 24 Years | 17,864 (26.2%) | 19,762 (30.0%) |
| 25 to 34 Years | 8,797 (10.1%) | 15,469 (17.7%) |
| 35 to 44 Years | 8,899 (11.1%) | 11,494 (13.8%) |
| 45 to 54 Years | 8,006 (9.4%) | 10,285 (11.5%) |
| 55 to 64 Years | 12,892 (12.3%) | 16,155 (13.5%) |
| 65 to 74 Years | 9,366 (8.0%) | 11,962 (8.7%) |
| 75 Years and over | 6,209 (6.3%) | 10,943 (9.8%) |
| Total | 99,319 (12.6%) | 123,097 (14.8%) |
Income Above Poverty by Sex and Age in Area Code 352
According to the poverty statistics in Area Code 352, males aged 75 years and over and females aged 65 to 74 years are the age groups that are most secure financially, with 93.7% of males and 91.3% of females in these age groups living above the poverty line.
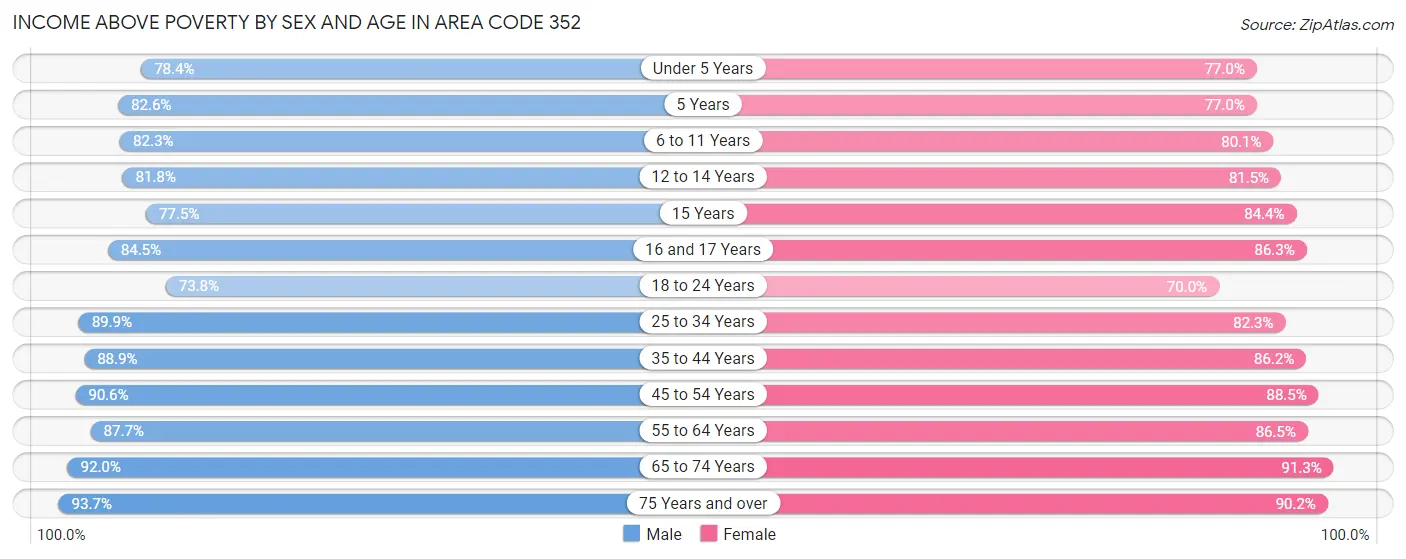
| Age Bracket | Male | Female |
| Under 5 Years | 28,165 (78.3%) | 27,231 (77.0%) |
| 5 Years | 6,064 (82.6%) | 5,103 (77.0%) |
| 6 to 11 Years | 39,319 (82.3%) | 36,192 (80.1%) |
| 12 to 14 Years | 22,712 (81.8%) | 21,191 (81.5%) |
| 15 Years | 7,286 (77.5%) | 6,887 (84.4%) |
| 16 and 17 Years | 14,116 (84.5%) | 14,421 (86.3%) |
| 18 to 24 Years | 50,296 (73.8%) | 46,079 (70.0%) |
| 25 to 34 Years | 78,669 (89.9%) | 72,022 (82.3%) |
| 35 to 44 Years | 71,488 (88.9%) | 71,737 (86.2%) |
| 45 to 54 Years | 77,034 (90.6%) | 78,988 (88.5%) |
| 55 to 64 Years | 92,214 (87.7%) | 103,321 (86.5%) |
| 65 to 74 Years | 107,851 (92.0%) | 125,212 (91.3%) |
| 75 Years and over | 92,058 (93.7%) | 100,519 (90.2%) |
| Total | 687,272 (87.4%) | 708,903 (85.2%) |
Income Below Poverty Among Married-Couple Families in Area Code 352
The poverty statistics for married-couple families in Area Code 352 show that 4.8% or 16,314 of the total 339,263 families live below the poverty line. Families with 5 or more children have the highest poverty rate of 19.1%, comprising of 293 families. On the other hand, families with no children have the lowest poverty rate of 3.9%, which includes 9,747 families.
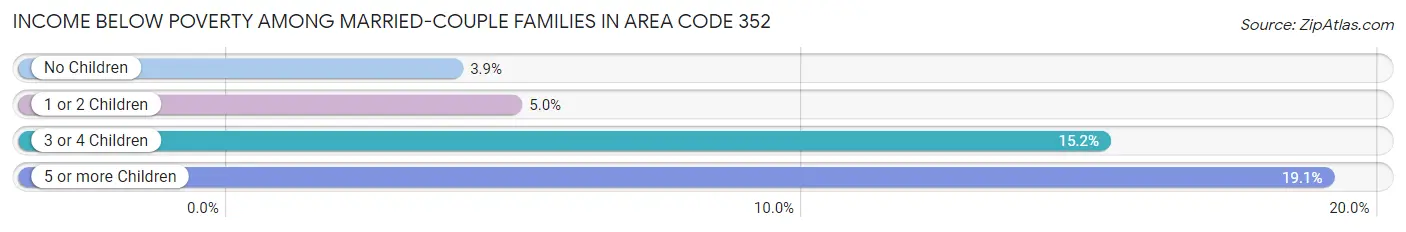
| Children | Above Poverty | Below Poverty |
| No Children | 239,126 (96.1%) | 9,747 (3.9%) |
| 1 or 2 Children | 67,039 (95.1%) | 3,491 (5.0%) |
| 3 or 4 Children | 15,541 (84.8%) | 2,783 (15.2%) |
| 5 or more Children | 1,243 (80.9%) | 293 (19.1%) |
| Total | 322,949 (95.2%) | 16,314 (4.8%) |
Income Below Poverty Among Single-Parent Households in Area Code 352
According to the poverty data in Area Code 352, 14.9% or 4,289 single-father households and 24.5% or 17,204 single-mother households are living below the poverty line. Among single-father households, those with 5 or more children have the highest poverty rate, with 35 households (100.0%) experiencing poverty. Likewise, among single-mother households, those with 5 or more children have the highest poverty rate, with 508 households (77.3%) falling below the poverty line.
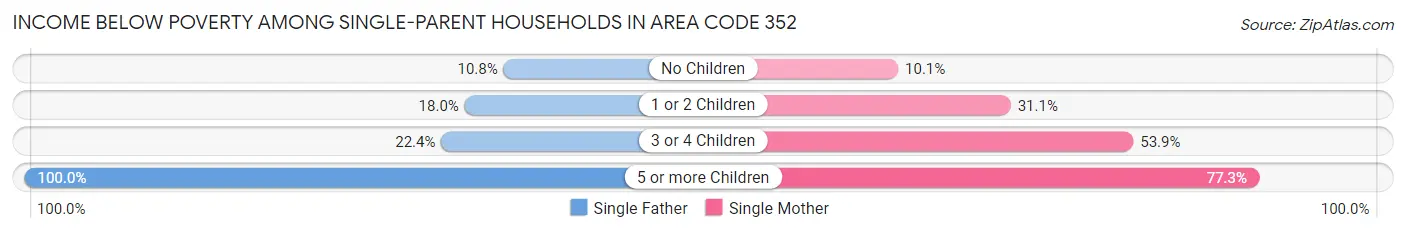
| Children | Single Father | Single Mother |
| No Children | 1,539 (10.8%) | 3,111 (10.1%) |
| 1 or 2 Children | 2,100 (18.0%) | 10,091 (31.1%) |
| 3 or 4 Children | 615 (22.4%) | 3,494 (53.9%) |
| 5 or more Children | 35 (100.0%) | 508 (77.3%) |
| Total | 4,289 (14.9%) | 17,204 (24.5%) |
Income Below Poverty Among Married-Couple vs Single-Parent Households in Area Code 352
The poverty data for Area Code 352 shows that 16,314 of the married-couple family households (4.8%) and 21,493 of the single-parent households (21.7%) are living below the poverty level. Within the married-couple family households, those with 5 or more children have the highest poverty rate, with 293 households (19.1%) falling below the poverty line. Among the single-parent households, those with 5 or more children have the highest poverty rate, with 543 household (78.5%) living below poverty.
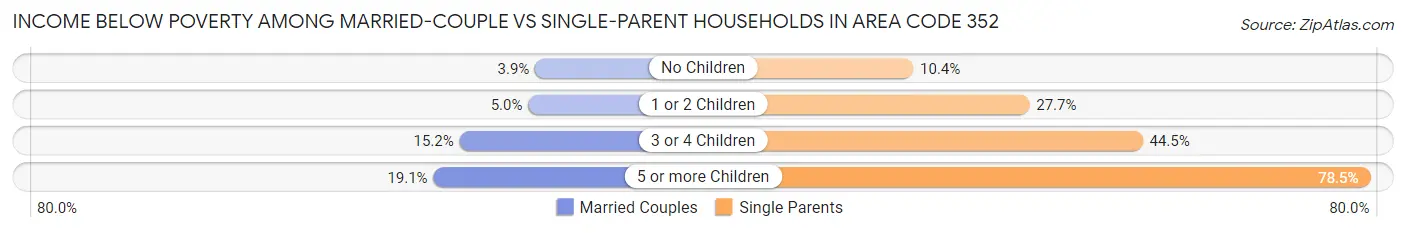
| Children | Married-Couple Families | Single-Parent Households |
| No Children | 9,747 (3.9%) | 4,650 (10.3%) |
| 1 or 2 Children | 3,491 (5.0%) | 12,191 (27.7%) |
| 3 or 4 Children | 2,783 (15.2%) | 4,109 (44.5%) |
| 5 or more Children | 293 (19.1%) | 543 (78.5%) |
| Total | 16,314 (4.8%) | 21,493 (21.7%) |
Race in Area Code 352
The most populous races in Area Code 352 are White / Caucasian (1,276,494 | 76.5%), Hispanic or Latino (221,035 | 13.3%), and Black / African American (171,701 | 10.3%).
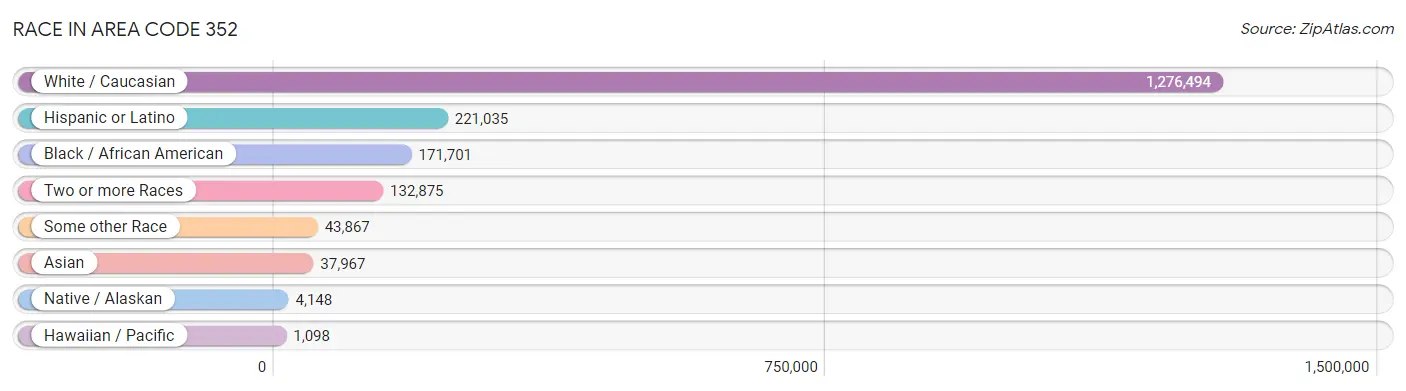
| Race | # Population | % Population |
| Asian | 37,967 | 2.3% |
| Black / African American | 171,701 | 10.3% |
| Hawaiian / Pacific | 1,098 | 0.1% |
| Hispanic or Latino | 221,035 | 13.3% |
| Native / Alaskan | 4,148 | 0.3% |
| White / Caucasian | 1,276,494 | 76.5% |
| Two or more Races | 132,875 | 8.0% |
| Some other Race | 43,867 | 2.6% |
| Total | 1,668,150 | 100.0% |
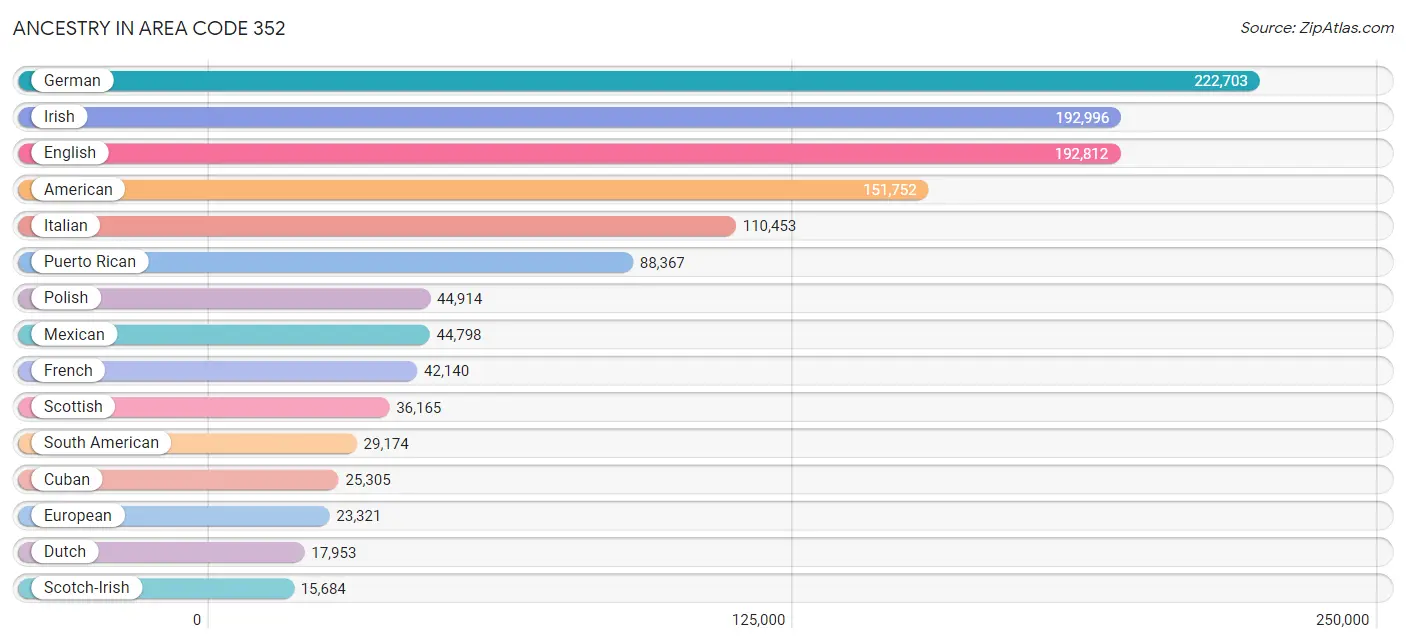
Ancestry in Area Code 352
The most populous ancestries reported in Area Code 352 are German (222,703 | 13.4%), Irish (192,996 | 11.6%), English (192,812 | 11.6%), American (151,752 | 9.1%), and Italian (110,453 | 6.6%), together accounting for 52.2% of all Area Code 352 residents.
| Ancestry | # Population | % Population |
| Afghan | 19 | 0.0% |
| African | 9,439 | 0.6% |
| Alaska Native | 47 | 0.0% |
| Alaskan Athabascan | 39 | 0.0% |
| Albanian | 977 | 0.1% |
| Aleut | 10 | 0.0% |
| Alsatian | 7 | 0.0% |
| American | 151,752 | 9.1% |
| Apache | 349 | 0.0% |
| Arab | 5,709 | 0.3% |
| Arapaho | 7 | 0.0% |
| Argentinean | 1,568 | 0.1% |
| Armenian | 869 | 0.1% |
| Assyrian / Chaldean / Syriac | 8 | 0.0% |
| Australian | 349 | 0.0% |
| Austrian | 3,303 | 0.2% |
| Bahamian | 1,745 | 0.1% |
| Bangladeshi | 116 | 0.0% |
| Barbadian | 619 | 0.0% |
| Basque | 63 | 0.0% |
| Belgian | 1,774 | 0.1% |
| Belizean | 93 | 0.0% |
| Bermudan | 73 | 0.0% |
| Bhutanese | 4,310 | 0.3% |
| Blackfeet | 1,126 | 0.1% |
| Bolivian | 655 | 0.0% |
| Brazilian | 3,039 | 0.2% |
| British | 11,310 | 0.7% |
| British West Indian | 571 | 0.0% |
| Bulgarian | 303 | 0.0% |
| Burmese | 4,087 | 0.3% |
| Cajun | 98 | 0.0% |
| Canadian | 4,819 | 0.3% |
| Cape Verdean | 113 | 0.0% |
| Celtic | 258 | 0.0% |
| Central American | 12,673 | 0.8% |
| Central American Indian | 1,257 | 0.1% |
| Cherokee | 4,865 | 0.3% |
| Chickasaw | 189 | 0.0% |
| Chilean | 1,972 | 0.1% |
| Chippewa | 393 | 0.0% |
| Choctaw | 772 | 0.1% |
| Colombian | 11,125 | 0.7% |
| Comanche | 29 | 0.0% |
| Costa Rican | 1,106 | 0.1% |
| Cree | 3 | 0.0% |
| Creek | 189 | 0.0% |
| Croatian | 1,420 | 0.1% |
| Crow | 97 | 0.0% |
| Cuban | 25,305 | 1.5% |
| Cypriot | 21 | 0.0% |
| Czech | 3,851 | 0.2% |
| Czechoslovakian | 1,522 | 0.1% |
| Danish | 4,097 | 0.3% |
| Delaware | 133 | 0.0% |
| Dominican | 9,409 | 0.6% |
| Dutch | 17,953 | 1.1% |
| Dutch West Indian | 10 | 0.0% |
| Eastern European | 3,450 | 0.2% |
| Ecuadorian | 2,929 | 0.2% |
| Egyptian | 1,369 | 0.1% |
| English | 192,812 | 11.6% |
| Estonian | 50 | 0.0% |
| Ethiopian | 330 | 0.0% |
| European | 23,321 | 1.4% |
| Filipino | 551 | 0.0% |
| Finnish | 2,586 | 0.2% |
| French | 42,140 | 2.5% |
| French American Indian | 113 | 0.0% |
| French Canadian | 12,443 | 0.7% |
| German | 222,703 | 13.4% |
| German Russian | 47 | 0.0% |
| Ghanaian | 45 | 0.0% |
| Greek | 6,339 | 0.4% |
| Guamanian / Chamorro | 260 | 0.0% |
| Guatemalan | 2,918 | 0.2% |
| Guyanese | 4,656 | 0.3% |
| Haitian | 4,789 | 0.3% |
| Honduran | 3,270 | 0.2% |
| Houma | 152 | 0.0% |
| Hungarian | 8,725 | 0.5% |
| Icelander | 134 | 0.0% |
| Indian (Asian) | 9,966 | 0.6% |
| Indonesian | 178 | 0.0% |
| Iranian | 1,149 | 0.1% |
| Iraqi | 129 | 0.0% |
| Irish | 192,996 | 11.6% |
| Iroquois | 630 | 0.0% |
| Israeli | 616 | 0.0% |
| Italian | 110,453 | 6.6% |
| Jamaican | 10,155 | 0.6% |
| Japanese | 111 | 0.0% |
| Jordanian | 131 | 0.0% |
| Kenyan | 140 | 0.0% |
| Korean | 10,877 | 0.6% |
| Laotian | 543 | 0.0% |
| Latvian | 456 | 0.0% |
| Lebanese | 1,784 | 0.1% |
| Lithuanian | 3,480 | 0.2% |
| Lumbee | 146 | 0.0% |
| Luxembourger | 341 | 0.0% |
| Macedonian | 142 | 0.0% |
| Malaysian | 499 | 0.0% |
| Maltese | 107 | 0.0% |
| Mexican | 44,798 | 2.7% |
| Mexican American Indian | 820 | 0.1% |
| Mongolian | 83 | 0.0% |
| Moroccan | 354 | 0.0% |
| Native Hawaiian | 1,403 | 0.1% |
| Navajo | 91 | 0.0% |
| New Zealander | 42 | 0.0% |
| Nicaraguan | 1,788 | 0.1% |
| Nigerian | 641 | 0.0% |
| Northern European | 1,880 | 0.1% |
| Norwegian | 12,919 | 0.8% |
| Ottawa | 81 | 0.0% |
| Pakistani | 971 | 0.1% |
| Palestinian | 273 | 0.0% |
| Panamanian | 1,224 | 0.1% |
| Paraguayan | 215 | 0.0% |
| Pennsylvania German | 1,252 | 0.1% |
| Peruvian | 3,147 | 0.2% |
| Polish | 44,914 | 2.7% |
| Portuguese | 6,215 | 0.4% |
| Potawatomi | 161 | 0.0% |
| Pueblo | 213 | 0.0% |
| Puerto Rican | 88,367 | 5.3% |
| Puget Sound Salish | 6 | 0.0% |
| Romanian | 1,659 | 0.1% |
| Russian | 10,257 | 0.6% |
| Salvadoran | 2,367 | 0.1% |
| Samoan | 57 | 0.0% |
| Scandinavian | 3,778 | 0.2% |
| Scotch-Irish | 15,684 | 0.9% |
| Scottish | 36,165 | 2.2% |
| Seminole | 198 | 0.0% |
| Senegalese | 9 | 0.0% |
| Serbian | 520 | 0.0% |
| Shoshone | 24 | 0.0% |
| Sioux | 288 | 0.0% |
| Slavic | 661 | 0.0% |
| Slovak | 3,046 | 0.2% |
| Slovene | 1,145 | 0.1% |
| South African | 482 | 0.0% |
| South American | 29,174 | 1.8% |
| South American Indian | 434 | 0.0% |
| Soviet Union | 13 | 0.0% |
| Spaniard | 3,952 | 0.2% |
| Spanish | 1,851 | 0.1% |
| Spanish American | 69 | 0.0% |
| Sri Lankan | 5,433 | 0.3% |
| Subsaharan African | 11,571 | 0.7% |
| Swedish | 15,050 | 0.9% |
| Swiss | 3,261 | 0.2% |
| Syrian | 614 | 0.0% |
| Thai | 13,012 | 0.8% |
| Tlingit-Haida | 18 | 0.0% |
| Tongan | 92 | 0.0% |
| Trinidadian and Tobagonian | 1,669 | 0.1% |
| Turkish | 1,000 | 0.1% |
| U.S. Virgin Islander | 959 | 0.1% |
| Ugandan | 10 | 0.0% |
| Ukrainian | 4,464 | 0.3% |
| Uruguayan | 428 | 0.0% |
| Venezuelan | 6,956 | 0.4% |
| Vietnamese | 319 | 0.0% |
| Welsh | 10,387 | 0.6% |
| West Indian | 1,701 | 0.1% |
| Yugoslavian | 788 | 0.1% |
| Yuman | 9 | 0.0% |
| Zimbabwean | 24 | 0.0% | View All 171 Rows |
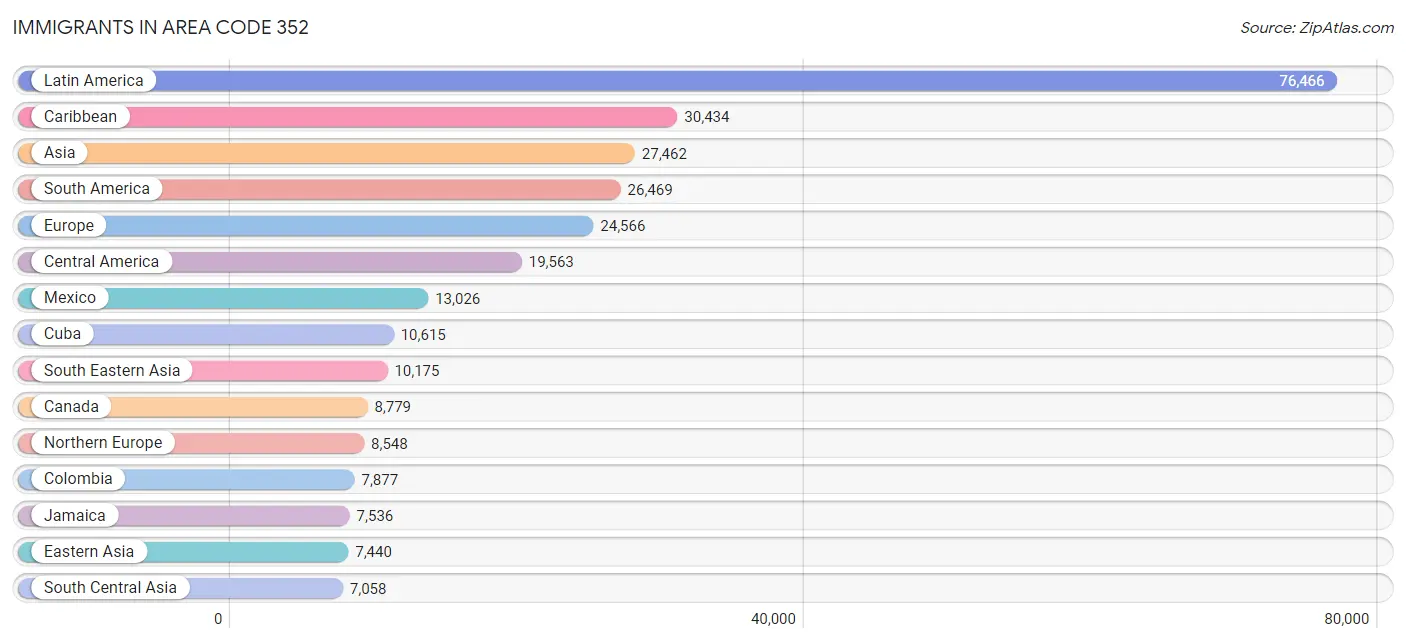
Immigrants in Area Code 352
The most numerous immigrant groups reported in Area Code 352 came from Latin America (76,466 | 4.6%), Caribbean (30,434 | 1.8%), Asia (27,462 | 1.7%), South America (26,469 | 1.6%), and Europe (24,566 | 1.5%), together accounting for 11.1% of all Area Code 352 residents.
| Immigration Origin | # Population | % Population |
| Afghanistan | 15 | 0.0% |
| Africa | 3,942 | 0.2% |
| Albania | 484 | 0.0% |
| Argentina | 1,169 | 0.1% |
| Asia | 27,462 | 1.7% |
| Australia | 207 | 0.0% |
| Austria | 201 | 0.0% |
| Azores | 26 | 0.0% |
| Bahamas | 1,053 | 0.1% |
| Bangladesh | 426 | 0.0% |
| Barbados | 514 | 0.0% |
| Belarus | 48 | 0.0% |
| Belgium | 267 | 0.0% |
| Belize | 139 | 0.0% |
| Bolivia | 168 | 0.0% |
| Bosnia and Herzegovina | 36 | 0.0% |
| Brazil | 3,285 | 0.2% |
| Bulgaria | 338 | 0.0% |
| Cambodia | 69 | 0.0% |
| Cameroon | 108 | 0.0% |
| Canada | 8,779 | 0.5% |
| Caribbean | 30,434 | 1.8% |
| Central America | 19,563 | 1.2% |
| Chile | 1,095 | 0.1% |
| China | 4,997 | 0.3% |
| Colombia | 7,877 | 0.5% |
| Congo | 3 | 0.0% |
| Costa Rica | 380 | 0.0% |
| Croatia | 54 | 0.0% |
| Cuba | 10,615 | 0.6% |
| Czechoslovakia | 265 | 0.0% |
| Denmark | 125 | 0.0% |
| Dominica | 403 | 0.0% |
| Dominican Republic | 4,594 | 0.3% |
| Eastern Africa | 574 | 0.0% |
| Eastern Asia | 7,440 | 0.4% |
| Eastern Europe | 5,697 | 0.3% |
| Ecuador | 1,481 | 0.1% |
| Egypt | 1,016 | 0.1% |
| El Salvador | 1,099 | 0.1% |
| England | 3,259 | 0.2% |
| Ethiopia | 205 | 0.0% |
| Europe | 24,566 | 1.5% |
| Fiji | 15 | 0.0% |
| France | 743 | 0.0% |
| Germany | 4,766 | 0.3% |
| Ghana | 45 | 0.0% |
| Greece | 364 | 0.0% |
| Grenada | 164 | 0.0% |
| Guatemala | 1,550 | 0.1% |
| Guyana | 3,580 | 0.2% |
| Haiti | 2,548 | 0.2% |
| Honduras | 1,742 | 0.1% |
| Hong Kong | 267 | 0.0% |
| Hungary | 345 | 0.0% |
| India | 5,305 | 0.3% |
| Indonesia | 427 | 0.0% |
| Iran | 745 | 0.0% |
| Iraq | 114 | 0.0% |
| Ireland | 1,177 | 0.1% |
| Israel | 466 | 0.0% |
| Italy | 1,823 | 0.1% |
| Jamaica | 7,536 | 0.4% |
| Japan | 633 | 0.0% |
| Jordan | 132 | 0.0% |
| Kazakhstan | 57 | 0.0% |
| Kenya | 228 | 0.0% |
| Korea | 1,810 | 0.1% |
| Kuwait | 120 | 0.0% |
| Laos | 93 | 0.0% |
| Latin America | 76,466 | 4.6% |
| Latvia | 97 | 0.0% |
| Lebanon | 475 | 0.0% |
| Liberia | 449 | 0.0% |
| Lithuania | 41 | 0.0% |
| Malaysia | 200 | 0.0% |
| Mexico | 13,026 | 0.8% |
| Micronesia | 14 | 0.0% |
| Middle Africa | 215 | 0.0% |
| Morocco | 206 | 0.0% |
| Nepal | 47 | 0.0% |
| Netherlands | 728 | 0.0% |
| Nicaragua | 948 | 0.1% |
| Nigeria | 397 | 0.0% |
| North Macedonia | 53 | 0.0% |
| Northern Africa | 1,248 | 0.1% |
| Northern Europe | 8,548 | 0.5% |
| Norway | 118 | 0.0% |
| Oceania | 402 | 0.0% |
| Pakistan | 367 | 0.0% |
| Panama | 679 | 0.0% |
| Peru | 1,742 | 0.1% |
| Philippines | 5,408 | 0.3% |
| Poland | 956 | 0.1% |
| Portugal | 526 | 0.0% |
| Romania | 445 | 0.0% |
| Russia | 989 | 0.1% |
| Saudi Arabia | 258 | 0.0% |
| Scotland | 559 | 0.0% |
| Serbia | 74 | 0.0% |
| Singapore | 36 | 0.0% |
| South Africa | 713 | 0.0% |
| South America | 26,469 | 1.6% |
| South Central Asia | 7,058 | 0.4% |
| South Eastern Asia | 10,175 | 0.6% |
| Southern Europe | 3,475 | 0.2% |
| Spain | 679 | 0.0% |
| Sri Lanka | 77 | 0.0% |
| St. Vincent and the Grenadines | 79 | 0.0% |
| Sweden | 359 | 0.0% |
| Switzerland | 141 | 0.0% |
| Syria | 108 | 0.0% |
| Taiwan | 564 | 0.0% |
| Thailand | 633 | 0.0% |
| Trinidad and Tobago | 1,777 | 0.1% |
| Turkey | 791 | 0.1% |
| Uganda | 26 | 0.0% |
| Ukraine | 524 | 0.0% |
| Uruguay | 265 | 0.0% |
| Venezuela | 5,421 | 0.3% |
| Vietnam | 3,262 | 0.2% |
| West Indies | 99 | 0.0% |
| Western Africa | 1,090 | 0.1% |
| Western Asia | 2,646 | 0.2% |
| Western Europe | 6,846 | 0.4% |
| Yemen | 147 | 0.0% |
| Zaire | 64 | 0.0% |
| Zimbabwe | 35 | 0.0% | View All 128 Rows |
Sex and Age in Area Code 352
Sex and Age in Area Code 352
The most populous age groups in Area Code 352 are 65 to 69 Years (59,542 | 7.3%) for men and 65 to 69 Years (70,229 | 8.2%) for women.
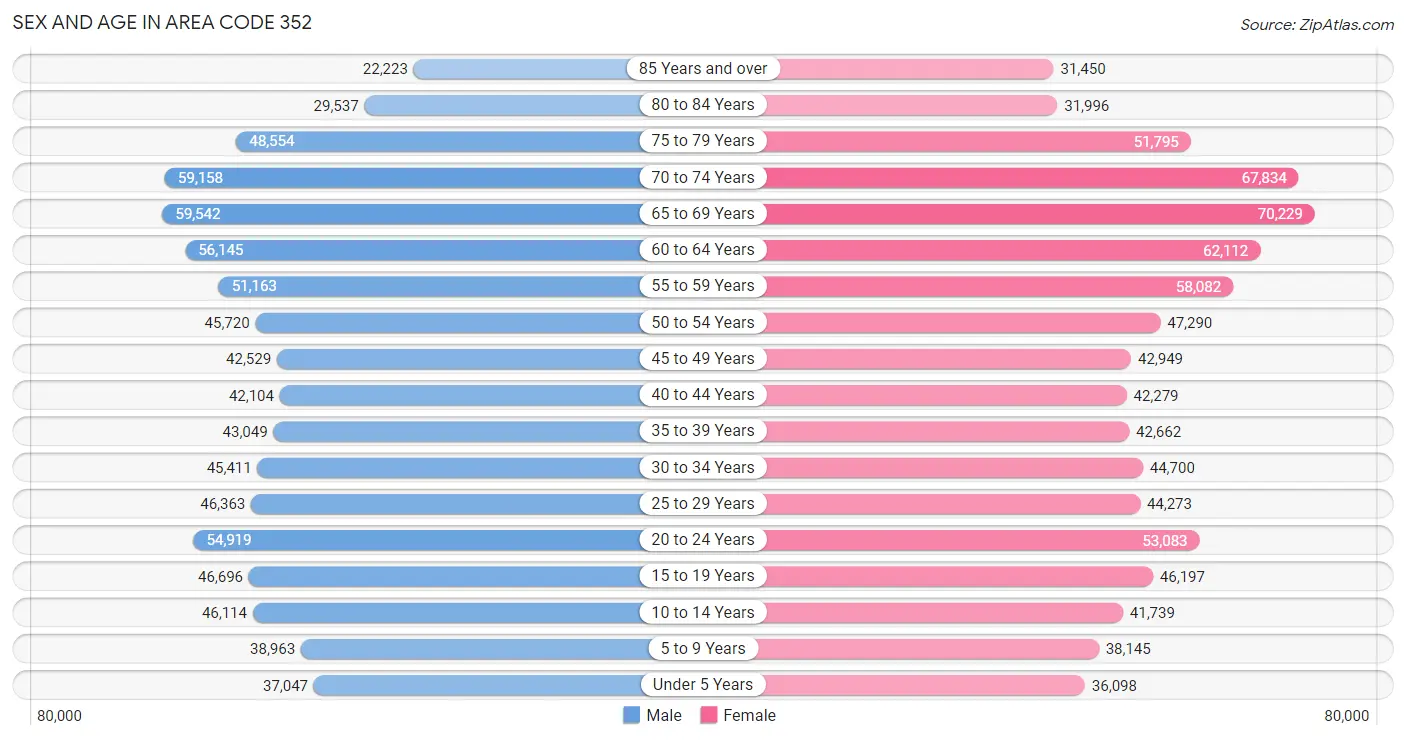
| Age Bracket | Male | Female |
| Under 5 Years | 37,047 (4.5%) | 36,098 (4.2%) |
| 5 to 9 Years | 38,963 (4.8%) | 38,145 (4.5%) |
| 10 to 14 Years | 46,114 (5.7%) | 41,739 (4.9%) |
| 15 to 19 Years | 46,696 (5.7%) | 46,197 (5.4%) |
| 20 to 24 Years | 54,919 (6.7%) | 53,083 (6.2%) |
| 25 to 29 Years | 46,363 (5.7%) | 44,273 (5.2%) |
| 30 to 34 Years | 45,411 (5.6%) | 44,700 (5.2%) |
| 35 to 39 Years | 43,049 (5.3%) | 42,662 (5.0%) |
| 40 to 44 Years | 42,104 (5.2%) | 42,279 (5.0%) |
| 45 to 49 Years | 42,529 (5.2%) | 42,949 (5.0%) |
| 50 to 54 Years | 45,720 (5.6%) | 47,290 (5.5%) |
| 55 to 59 Years | 51,163 (6.3%) | 58,082 (6.8%) |
| 60 to 64 Years | 56,145 (6.9%) | 62,112 (7.3%) |
| 65 to 69 Years | 59,542 (7.3%) | 70,229 (8.2%) |
| 70 to 74 Years | 59,158 (7.3%) | 67,834 (8.0%) |
| 75 to 79 Years | 48,554 (6.0%) | 51,795 (6.1%) |
| 80 to 84 Years | 29,537 (3.6%) | 31,996 (3.7%) |
| 85 Years and over | 22,223 (2.7%) | 31,450 (3.7%) |
| Total | 815,237 (100.0%) | 852,913 (100.0%) |
Families and Households in Area Code 352
Median Family Size in Area Code 352
The median family size in Area Code 352 is 2.92 persons per family, with single female/mother families (70,231 | 16.0%) accounting for the largest median family size of 3.1357 persons per family. On the other hand, single male/father families (28,691 | 6.6%) represent the smallest median family size with 2.83 persons per family.
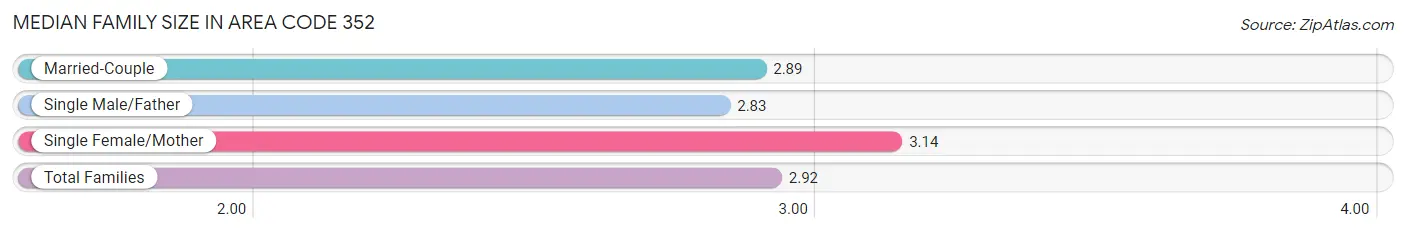
| Family Type | # Families | Family Size |
| Married-Couple | 339,263 (77.4%) | 2.89 |
| Single Male/Father | 28,691 (6.6%) | 2.83 |
| Single Female/Mother | 70,231 (16.0%) | 3.14 |
| Total Families | 438,185 (100.0%) | 2.92 |
Median Household Size in Area Code 352
The median household size in Area Code 352 is 2.43 persons per household, with single female/mother households (70,231 | 10.3%) accounting for the largest median household size of 3.37552 persons per household. non-family households (244,131 | 35.8%) represent the smallest median household size with 1.29 persons per household.
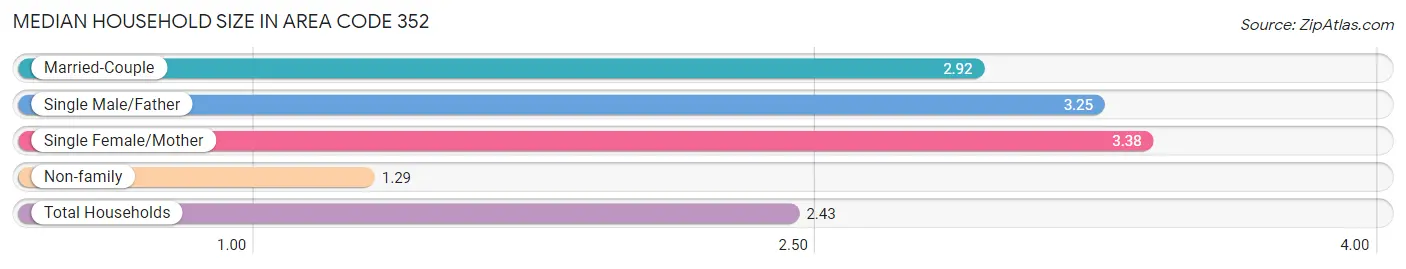
| Household Type | # Households | Household Size |
| Married-Couple | 339,263 (49.7%) | 2.92 |
| Single Male/Father | 28,691 (4.2%) | 3.25 |
| Single Female/Mother | 70,231 (10.3%) | 3.38 |
| Non-family | 244,131 (35.8%) | 1.29 |
| Total Households | 682,316 (100.0%) | 2.43 |
Household Size by Marriage Status in Area Code 352
Out of a total of 682,316 households in Area Code 352, 438,185 (64.2%) are family households, while 244,131 (35.8%) are nonfamily households. The most numerous type of family households are 2-person households, comprising 246,625, and the most common type of nonfamily households are 1-person households, comprising 196,187.
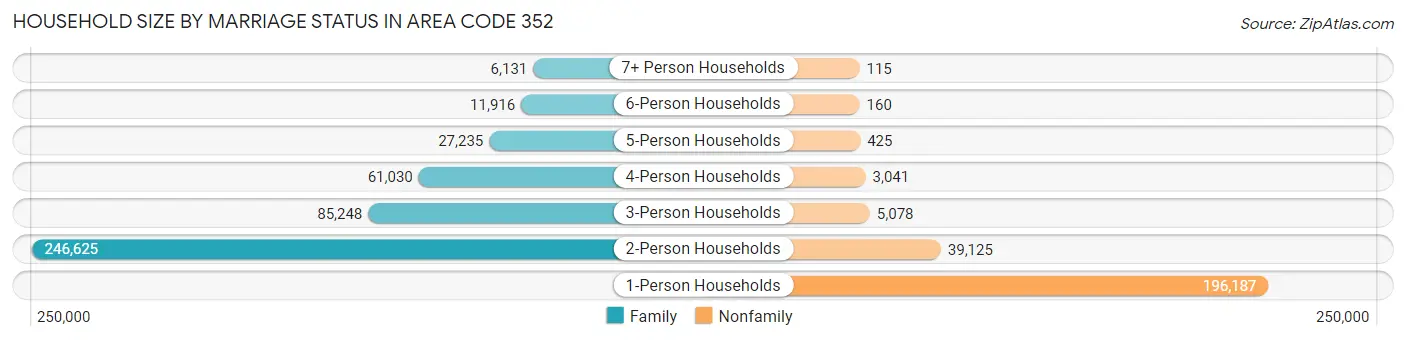
| Household Size | Family Households | Nonfamily Households |
| 1-Person Households | - | 196,187 (28.7%) |
| 2-Person Households | 246,625 (36.1%) | 39,125 (5.7%) |
| 3-Person Households | 85,248 (12.5%) | 5,078 (0.7%) |
| 4-Person Households | 61,030 (8.9%) | 3,041 (0.4%) |
| 5-Person Households | 27,235 (4.0%) | 425 (0.1%) |
| 6-Person Households | 11,916 (1.8%) | 160 (0.0%) |
| 7+ Person Households | 6,131 (0.9%) | 115 (0.0%) |
| Total | 438,185 (64.2%) | 244,131 (35.8%) |
Female Fertility in Area Code 352
Fertility by Age in Area Code 352
Average fertility rate in Area Code 352 is 53.5 births per 1,000 women. Women in the age bracket of 20 to 34 years have the highest fertility rate with 107.9 births per 1,000 women. Women in the age bracket of 20 to 34 years acount for 76.9% of all women with births.
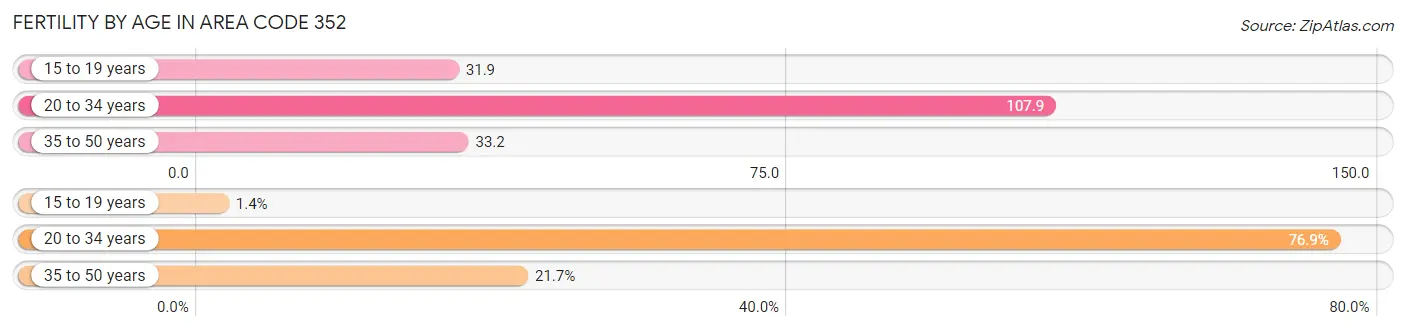
| Age Bracket | Women with Births | Births / 1,000 Women |
| 15 to 19 years | 198 (1.4%) | 31.9 |
| 20 to 34 years | 10,795 (76.9%) | 107.9 |
| 35 to 50 years | 3,050 (21.7%) | 33.2 |
| Total | 14,043 (100.0%) | 53.5 |
Fertility by Age by Marriage Status in Area Code 352
48.1% of women with births (14,043) in Area Code 352 are married. The highest percentage of unmarried women with births falls into 15 to 19 years age bracket with 96.5% of them unmarried at the time of birth, while the lowest percentage of unmarried women with births belong to 20 to 34 years age bracket with 57.3% of them unmarried.
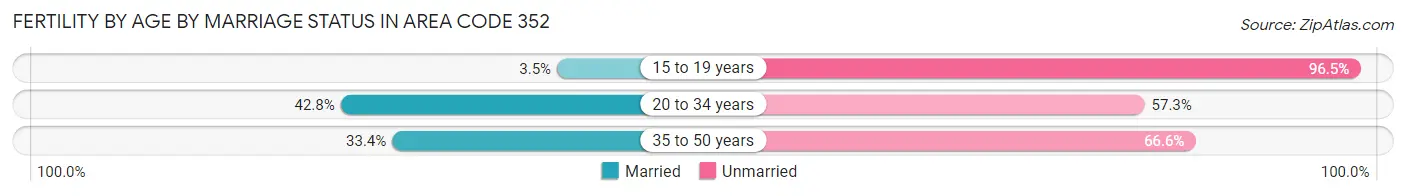
| Age Bracket | Married | Unmarried |
| 15 to 19 years | 7 (3.5%) | 191 (96.5%) |
| 20 to 34 years | 4,615 (42.7%) | 6,180 (57.3%) |
| 35 to 50 years | 1,019 (33.4%) | 2,031 (66.6%) |
| Total | 6,755 (48.1%) | 7,288 (51.9%) |
Fertility by Education in Area Code 352
Average fertility rate in Area Code 352 is 53.5 births per 1,000 women. Women with the education attainment of graduate degree have the highest fertility rate of 121.6 births per 1,000 women, while women with the education attainment of college or associate's degree have the lowest fertility at 68.6 births per 1,000 women. Women with the education attainment of college or associate's degree represent 30.9% of all women with births.
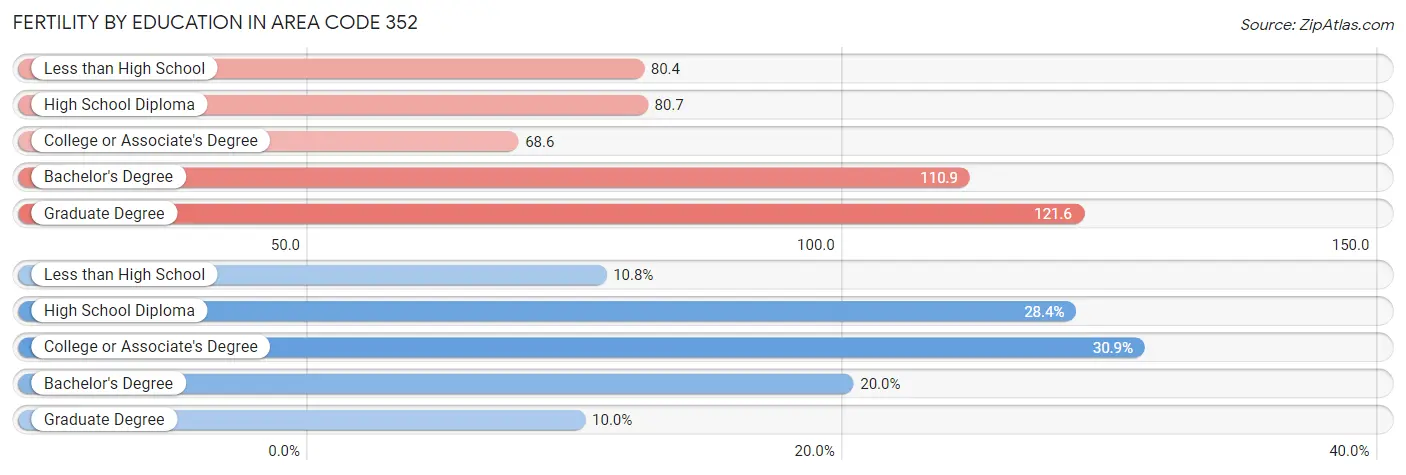
| Educational Attainment | Women with Births | Births / 1,000 Women |
| Less than High School | 1,509 (10.7%) | 80.4 |
| High School Diploma | 3,983 (28.4%) | 80.7 |
| College or Associate's Degree | 4,343 (30.9%) | 68.6 |
| Bachelor's Degree | 2,810 (20.0%) | 110.9 |
| Graduate Degree | 1,398 (10.0%) | 121.6 |
| Total | 14,043 (100.0%) | 53.5 |
Fertility by Education by Marriage Status in Area Code 352
51.9% of women with births in Area Code 352 are unmarried. Women with the educational attainment of bachelor's degree are most likely to be married with 38.2% of them married at childbirth, while women with the educational attainment of less than high school are least likely to be married with 92.9% of them unmarried at childbirth.
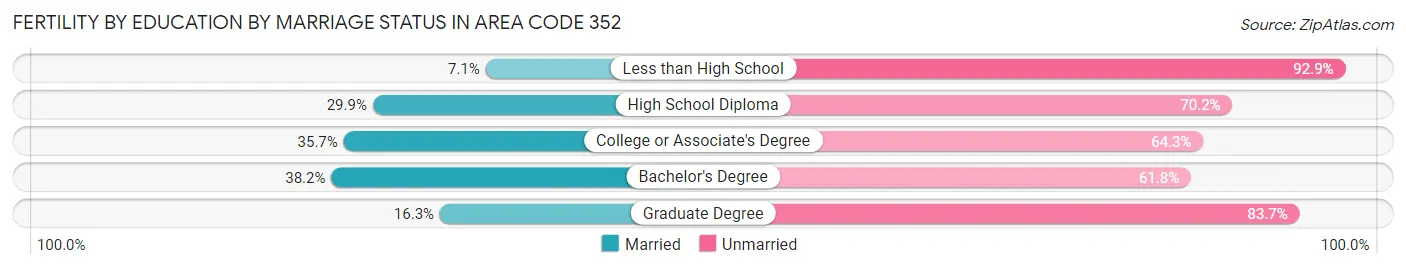
| Educational Attainment | Married | Unmarried |
| Less than High School | 107 (7.1%) | 1,402 (92.9%) |
| High School Diploma | 1,189 (29.8%) | 2,794 (70.2%) |
| College or Associate's Degree | 1,551 (35.7%) | 2,792 (64.3%) |
| Bachelor's Degree | 1,073 (38.2%) | 1,737 (61.8%) |
| Graduate Degree | 228 (16.3%) | 1,170 (83.7%) |
| Total | 6,755 (48.1%) | 7,288 (51.9%) |
Employment Characteristics in Area Code 352
Employment by Class of Employer in Area Code 352
Among the 636,678 employed individuals in Area Code 352, private company employees (425,405 | 66.8%), local government employees (50,241 | 7.9%), and not-for-profit organizations (42,496 | 6.7%) make up the most common classes of employment.
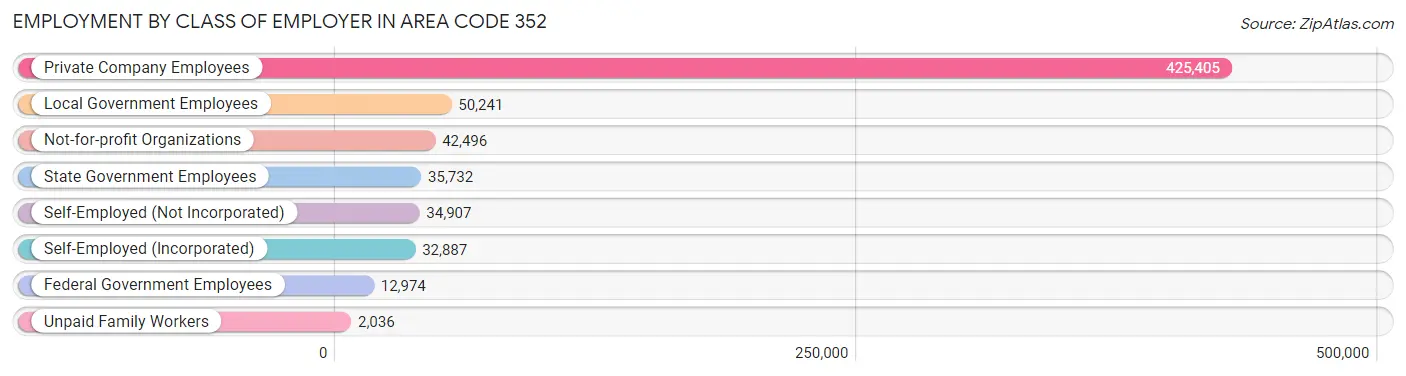
| Employer Class | # Employees | % Employees |
| Private Company Employees | 425,405 | 66.8% |
| Self-Employed (Incorporated) | 32,887 | 5.2% |
| Self-Employed (Not Incorporated) | 34,907 | 5.5% |
| Not-for-profit Organizations | 42,496 | 6.7% |
| Local Government Employees | 50,241 | 7.9% |
| State Government Employees | 35,732 | 5.6% |
| Federal Government Employees | 12,974 | 2.0% |
| Unpaid Family Workers | 2,036 | 0.3% |
| Total | 636,678 | 100.0% |
Employment Status by Age in Area Code 352
According to the labor force statistics for Area Code 352, out of the total population over 16 years of age (1,412,399), 49.3% or 697,019 individuals are in the labor force, with 6.5% or 45,306 of them unemployed. The age group with the highest labor force participation rate is 25 to 29 years, with 79.2% or 71,802 individuals in the labor force. Within the labor force, the 16 to 19 years age range has the highest percentage of unemployed individuals, with 1,638.5% or 486,520 of them being unemployed.
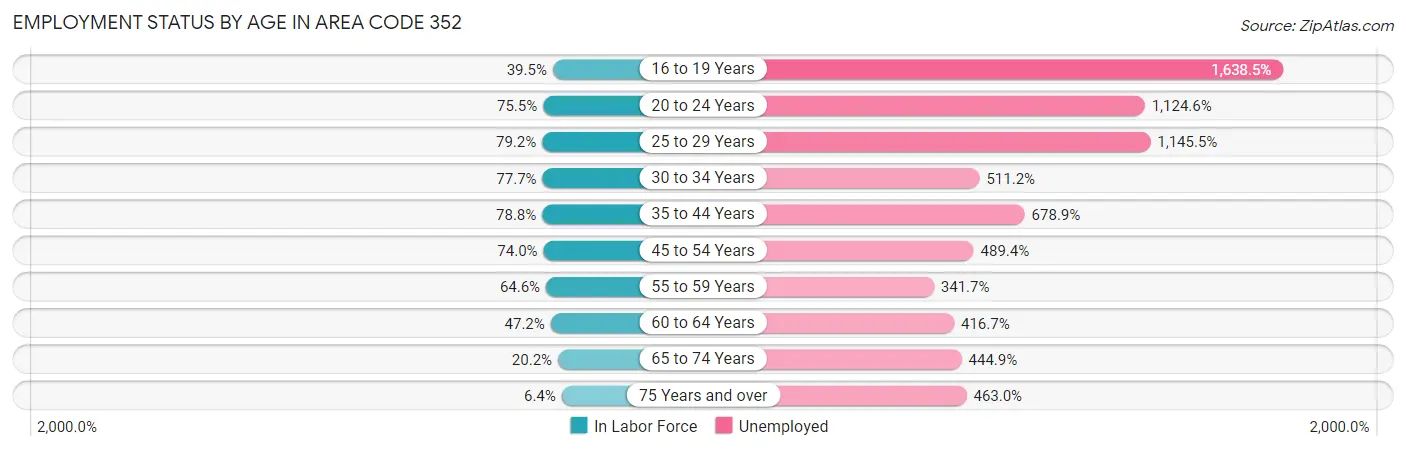
| Age Bracket | In Labor Force | Unemployed |
| 16 to 19 Years | 29,694 (39.5%) | 486,520 (1,638.5%) |
| 20 to 24 Years | 81,502 (75.5%) | 916,527 (1,124.6%) |
| 25 to 29 Years | 71,803 (79.2%) | 822,492 (1,145.5%) |
| 30 to 34 Years | 70,037 (77.7%) | 358,014 (511.2%) |
| 35 to 44 Years | 134,092 (78.8%) | 910,303 (678.9%) |
| 45 to 54 Years | 132,106 (74.0%) | 646,493 (489.4%) |
| 55 to 59 Years | 70,514 (64.5%) | 240,960 (341.7%) |
| 60 to 64 Years | 55,848 (47.2%) | 232,739 (416.7%) |
| 65 to 74 Years | 51,864 (20.2%) | 230,752 (444.9%) |
| 75 Years and over | 13,796 (6.4%) | 63,875 (463.0%) |
| Total | 697,030 (49.3%) | 45,306 (6.5%) |
Employment Status by Educational Attainment in Area Code 352
According to labor force statistics for Area Code 352, 67.5% of individuals (510,861) out of the total population between 25 and 64 years of age (756,831) are in the labor force, with 635.3% or 3,245,500 of them being unemployed. The group with the highest labor force participation rate are those with the educational attainment of bachelor's degree or higher, with 78.1% or 152,411 individuals in the labor force. Within the labor force, individuals with less than high school education have the highest percentage of unemployment, with 1,095.7% or 458,014 of them being unemployed.
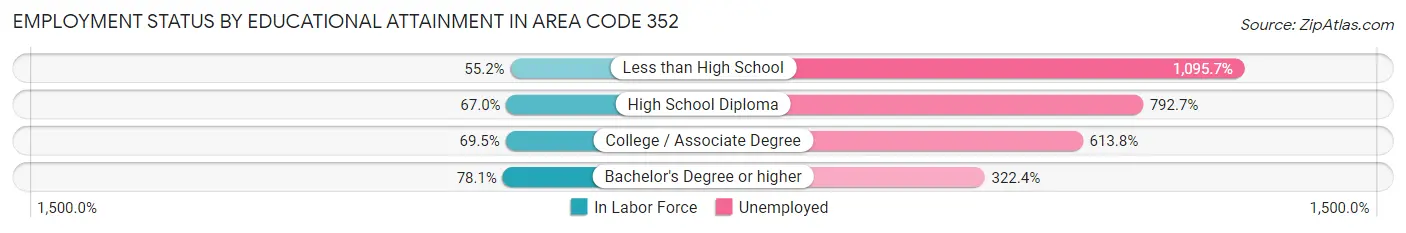
| Educational Attainment | In Labor Force | Unemployed |
| Less than High School | 41,802 (55.2%) | 829,138 (1,095.7%) |
| High School Diploma | 159,177 (67.0%) | 1,882,020 (792.7%) |
| College / Associate Degree | 172,871 (69.5%) | 1,526,318 (613.8%) |
| Bachelor's Degree or higher | 152,402 (78.1%) | 628,915 (322.4%) |
| Total | 510,842 (67.5%) | 4,808,147 (635.3%) |
Employment Occupations by Sex in Area Code 352
Management, Business, Science and Arts Occupations
The most common Management, Business, Science and Arts occupations in Area Code 352 are Community & Social Service (65,791 | 10.1%), Management (63,601 | 9.8%), Health Diagnosing & Treating (50,180 | 7.7%), Education Instruction & Library (38,925 | 6.0%), and Health Technologists (31,717 | 4.9%).
Management, Business, Science and Arts Occupations by Sex
Within the Management, Business, Science and Arts occupations in Area Code 352, the most male-oriented occupations are Architecture & Engineering (86.4%), Computers & Mathematics (74.3%), and Computers, Engineering & Science (74.0%), while the most female-oriented occupations are Health Diagnosing & Treating (72.5%), Education Instruction & Library (71.6%), and Health Technologists (70.7%).
| Occupation | Male | Female |
| Management | 35,961 (56.5%) | 27,640 (43.5%) |
| Business & Financial | 11,005 (43.1%) | 14,551 (56.9%) |
| Computers, Engineering & Science | 21,651 (74.0%) | 7,602 (26.0%) |
| Computers & Mathematics | 11,098 (74.3%) | 3,831 (25.7%) |
| Architecture & Engineering | 7,402 (86.4%) | 1,166 (13.6%) |
| Life, Physical & Social Science | 3,151 (54.7%) | 2,605 (45.3%) |
| Community & Social Service | 23,284 (35.4%) | 42,507 (64.6%) |
| Education, Arts & Media | 2,993 (33.8%) | 5,872 (66.2%) |
| Legal Services & Support | 2,684 (48.2%) | 2,889 (51.8%) |
| Education Instruction & Library | 11,070 (28.4%) | 27,855 (71.6%) |
| Arts, Media & Entertainment | 6,537 (52.6%) | 5,891 (47.4%) |
| Health Diagnosing & Treating | 13,804 (27.5%) | 36,376 (72.5%) |
| Health Technologists | 9,307 (29.3%) | 22,410 (70.7%) |
| Total (Category) | 105,705 (45.1%) | 128,676 (54.9%) |
| Total (Overall) | 335,685 (51.7%) | 313,231 (48.3%) |
Services Occupations
The most common Services occupations in Area Code 352 are Food Preparation & Serving (41,515 | 6.4%), Cleaning & Maintenance (27,127 | 4.2%), Healthcare Support (21,021 | 3.2%), Personal Care & Service (18,742 | 2.9%), and Security & Protection (18,521 | 2.9%).
Services Occupations by Sex
Within the Services occupations in Area Code 352, the most male-oriented occupations are Law Enforcement (82.3%), Security & Protection (79.5%), and Firefighting & Prevention (75.7%), while the most female-oriented occupations are Healthcare Support (87.0%), Personal Care & Service (68.6%), and Food Preparation & Serving (56.4%).
| Occupation | Male | Female |
| Healthcare Support | 2,735 (13.0%) | 18,286 (87.0%) |
| Security & Protection | 14,721 (79.5%) | 3,800 (20.5%) |
| Firefighting & Prevention | 6,066 (75.7%) | 1,943 (24.3%) |
| Law Enforcement | 8,655 (82.3%) | 1,857 (17.7%) |
| Food Preparation & Serving | 18,094 (43.6%) | 23,421 (56.4%) |
| Cleaning & Maintenance | 17,861 (65.8%) | 9,266 (34.2%) |
| Personal Care & Service | 5,881 (31.4%) | 12,861 (68.6%) |
| Total (Category) | 59,292 (46.7%) | 67,634 (53.3%) |
| Total (Overall) | 335,685 (51.7%) | 313,231 (48.3%) |
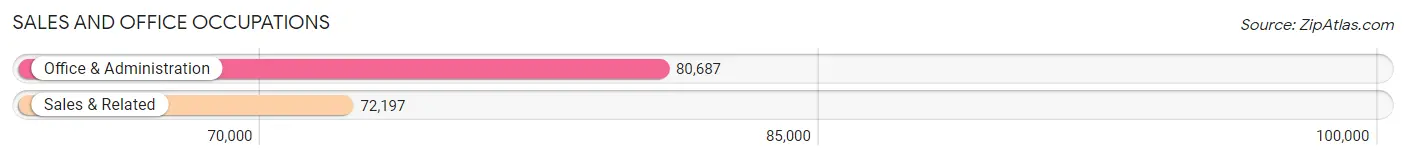
Sales and Office Occupations
The most common Sales and Office occupations in Area Code 352 are Office & Administration (80,687 | 12.4%), and Sales & Related (72,197 | 11.1%).
Sales and Office Occupations by Sex
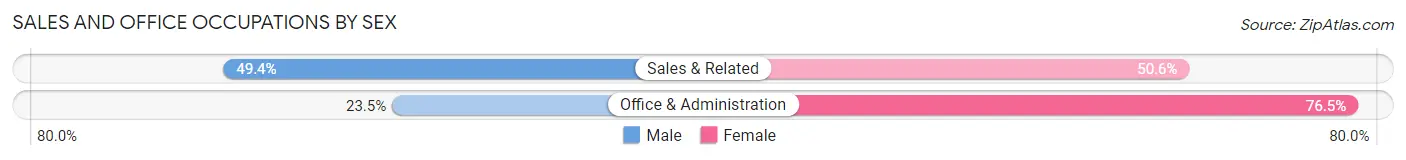
| Occupation | Male | Female |
| Sales & Related | 35,681 (49.4%) | 36,516 (50.6%) |
| Office & Administration | 18,941 (23.5%) | 61,746 (76.5%) |
| Total (Category) | 54,622 (35.7%) | 98,262 (64.3%) |
| Total (Overall) | 335,685 (51.7%) | 313,231 (48.3%) |
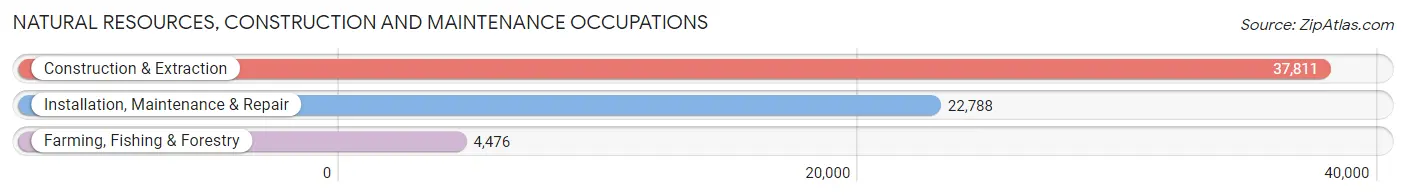
Natural Resources, Construction and Maintenance Occupations
The most common Natural Resources, Construction and Maintenance occupations in Area Code 352 are Construction & Extraction (37,811 | 5.8%), Installation, Maintenance & Repair (22,788 | 3.5%), and Farming, Fishing & Forestry (4,476 | 0.7%).
Natural Resources, Construction and Maintenance Occupations by Sex
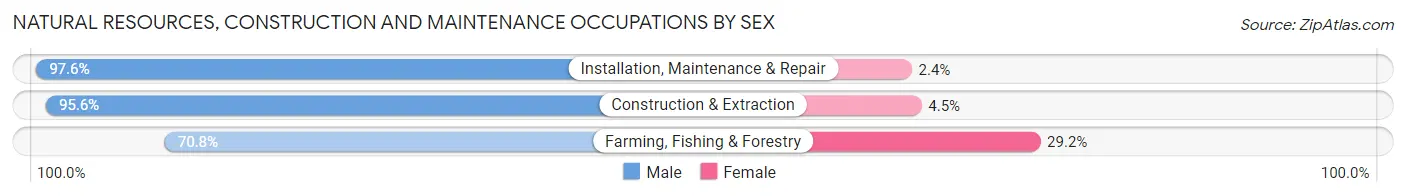
| Occupation | Male | Female |
| Farming, Fishing & Forestry | 3,170 (70.8%) | 1,306 (29.2%) |
| Construction & Extraction | 36,130 (95.6%) | 1,681 (4.4%) |
| Installation, Maintenance & Repair | 22,234 (97.6%) | 554 (2.4%) |
| Total (Category) | 61,534 (94.6%) | 3,541 (5.4%) |
| Total (Overall) | 335,685 (51.7%) | 313,231 (48.3%) |
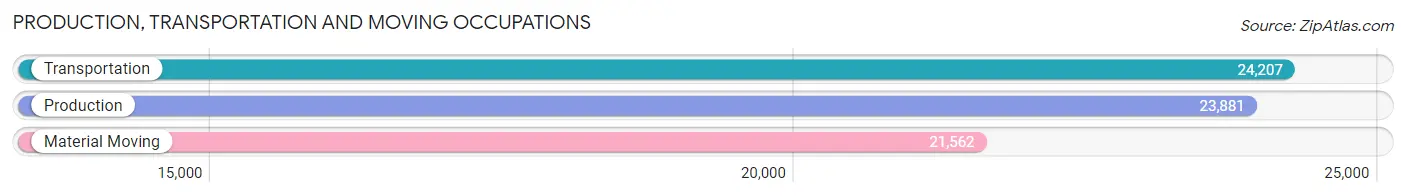
Production, Transportation and Moving Occupations
The most common Production, Transportation and Moving occupations in Area Code 352 are Transportation (24,207 | 3.7%), Production (23,881 | 3.7%), and Material Moving (21,562 | 3.3%).
Production, Transportation and Moving Occupations by Sex
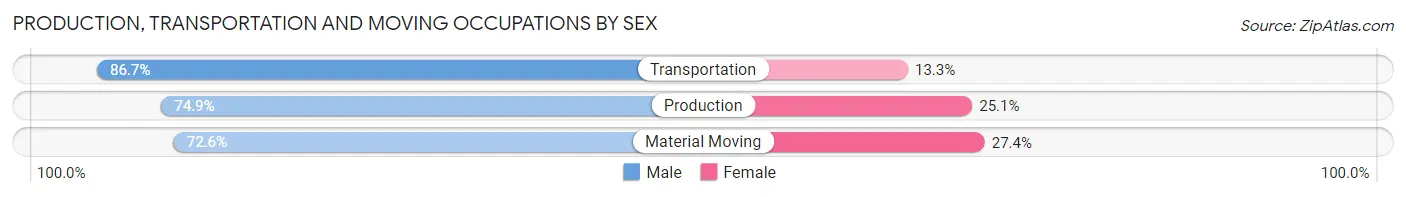
| Occupation | Male | Female |
| Production | 17,888 (74.9%) | 5,993 (25.1%) |
| Transportation | 20,987 (86.7%) | 3,220 (13.3%) |
| Material Moving | 15,657 (72.6%) | 5,905 (27.4%) |
| Total (Category) | 54,532 (78.3%) | 15,118 (21.7%) |
| Total (Overall) | 335,685 (51.7%) | 313,231 (48.3%) |
Employment Industries by Sex in Area Code 352
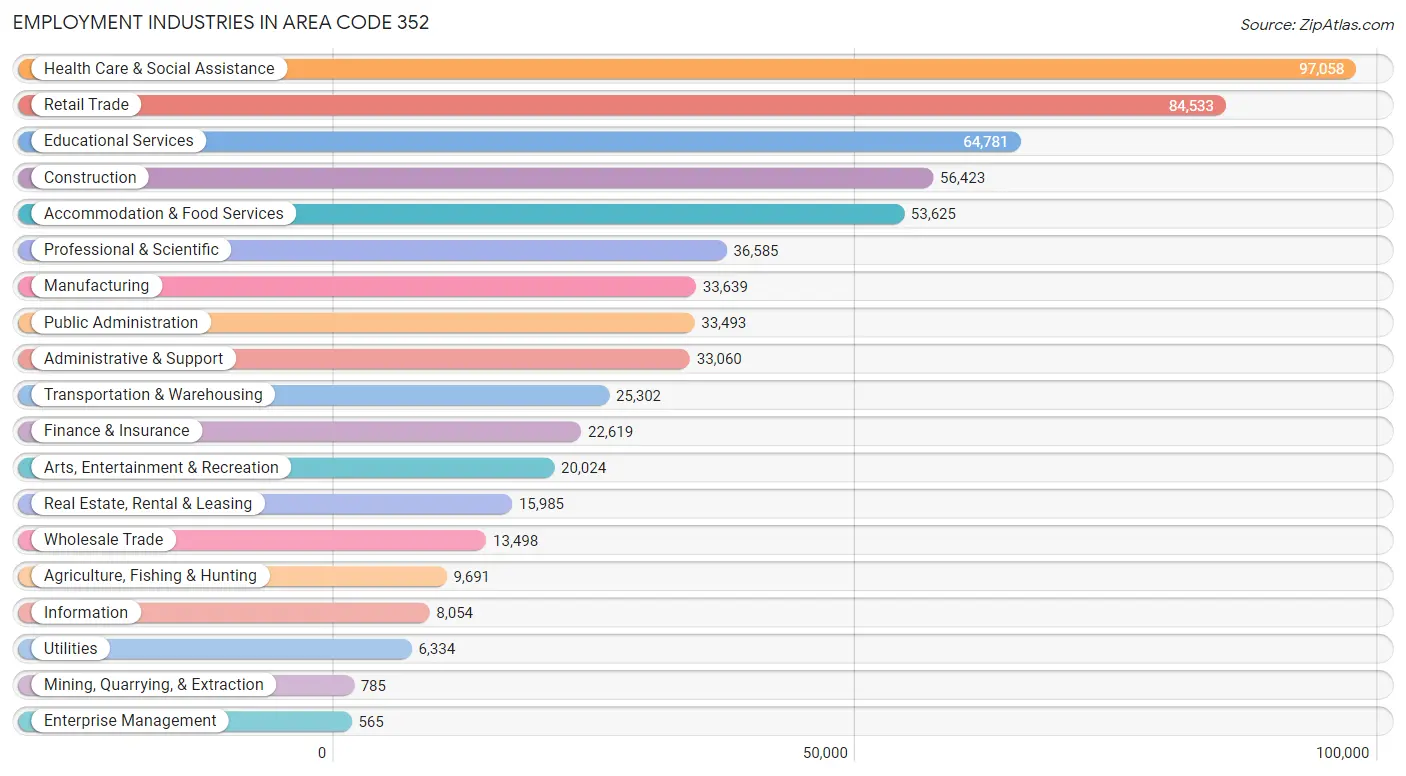
Employment Industries in Area Code 352
The major employment industries in Area Code 352 include Health Care & Social Assistance (97,058 | 15.0%), Retail Trade (84,533 | 13.0%), Educational Services (64,781 | 10.0%), Construction (56,423 | 8.7%), and Accommodation & Food Services (53,625 | 8.3%).
Employment Industries by Sex in Area Code 352
The Area Code 352 industries that see more men than women are Mining, Quarrying, & Extraction (93.6%), Construction (86.4%), and Utilities (81.8%), whereas the industries that tend to have a higher number of women are Health Care & Social Assistance (77.1%), Educational Services (66.7%), and Finance & Insurance (62.3%).
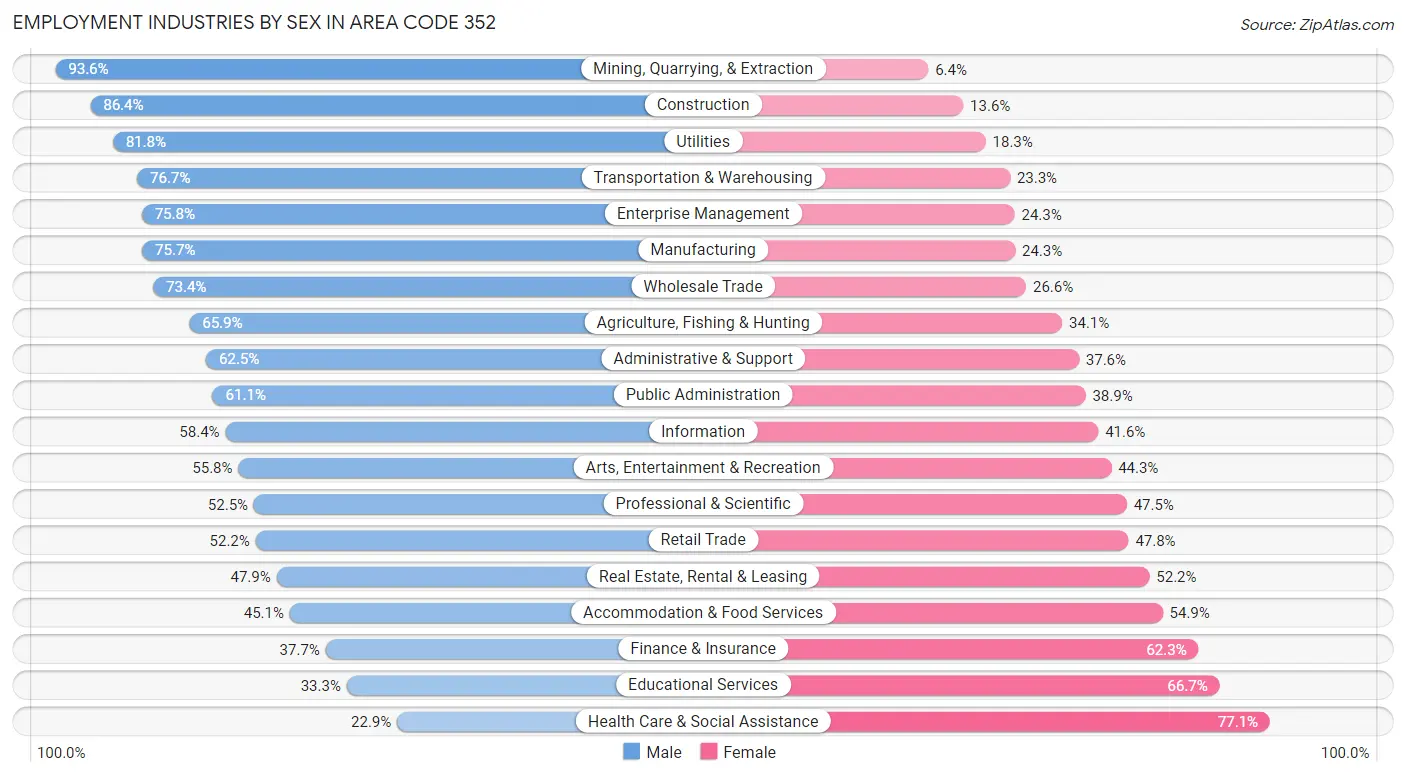
| Industry | Male | Female |
| Agriculture, Fishing & Hunting | 6,387 (65.9%) | 3,304 (34.1%) |
| Mining, Quarrying, & Extraction | 735 (93.6%) | 50 (6.4%) |
| Construction | 48,746 (86.4%) | 7,677 (13.6%) |
| Manufacturing | 25,452 (75.7%) | 8,187 (24.3%) |
| Wholesale Trade | 9,905 (73.4%) | 3,593 (26.6%) |
| Retail Trade | 44,112 (52.2%) | 40,421 (47.8%) |
| Transportation & Warehousing | 19,408 (76.7%) | 5,894 (23.3%) |
| Utilities | 5,178 (81.8%) | 1,156 (18.2%) |
| Information | 4,707 (58.4%) | 3,347 (41.6%) |
| Finance & Insurance | 8,524 (37.7%) | 14,095 (62.3%) |
| Real Estate, Rental & Leasing | 7,649 (47.8%) | 8,336 (52.1%) |
| Professional & Scientific | 19,220 (52.5%) | 17,365 (47.5%) |
| Enterprise Management | 428 (75.7%) | 137 (24.2%) |
| Administrative & Support | 20,646 (62.5%) | 12,414 (37.6%) |
| Educational Services | 21,586 (33.3%) | 43,195 (66.7%) |
| Health Care & Social Assistance | 22,222 (22.9%) | 74,836 (77.1%) |
| Arts, Entertainment & Recreation | 11,164 (55.7%) | 8,860 (44.3%) |
| Accommodation & Food Services | 24,189 (45.1%) | 29,436 (54.9%) |
| Public Administration | 20,454 (61.1%) | 13,039 (38.9%) |
| Total | 335,685 (51.7%) | 313,231 (48.3%) |
Education in Area Code 352
School Enrollment in Area Code 352
The most common levels of schooling among the 342,138 students in Area Code 352 are college / undergraduate (86,764 | 25.4%), middle school (69,523 | 20.3%), and high school (67,733 | 19.8%).
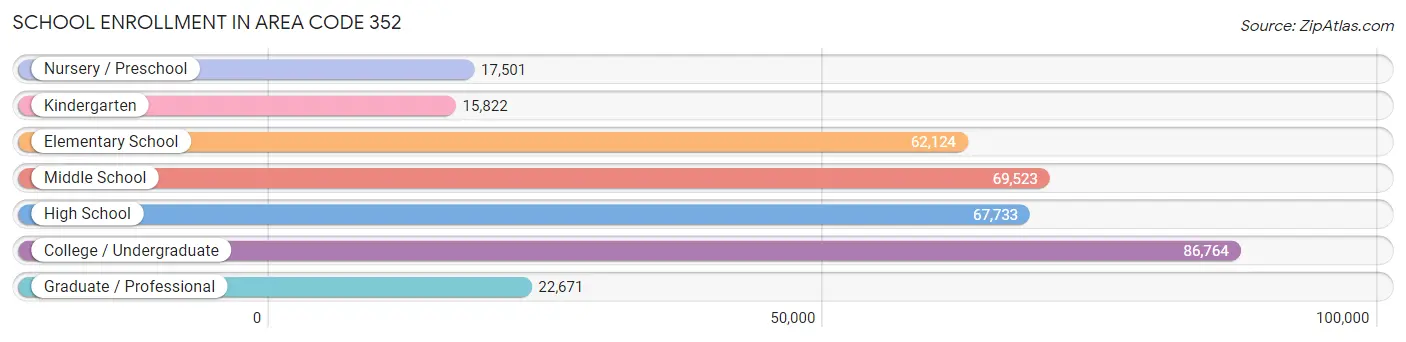
| School Level | # Students | % Students |
| Nursery / Preschool | 17,501 | 5.1% |
| Kindergarten | 15,822 | 4.6% |
| Elementary School | 62,124 | 18.2% |
| Middle School | 69,523 | 20.3% |
| High School | 67,733 | 19.8% |
| College / Undergraduate | 86,764 | 25.4% |
| Graduate / Professional | 22,671 | 6.6% |
| Total | 342,138 | 100.0% |
School Enrollment by Age by Funding Source in Area Code 352
Out of a total of 342,138 students who are enrolled in schools in Area Code 352, 58,703 (17.2%) attend a private institution, while the remaining 283,435 (82.8%) are enrolled in public schools. The age group of 3 to 4 year olds has the highest likelihood of being enrolled in private schools, with 6,281 (46.1% in the age bracket) enrolled. Conversely, the age group of 18 to 19 year olds has the lowest likelihood of being enrolled in a private school, with 29,084 (93.8% in the age bracket) attending a public institution.
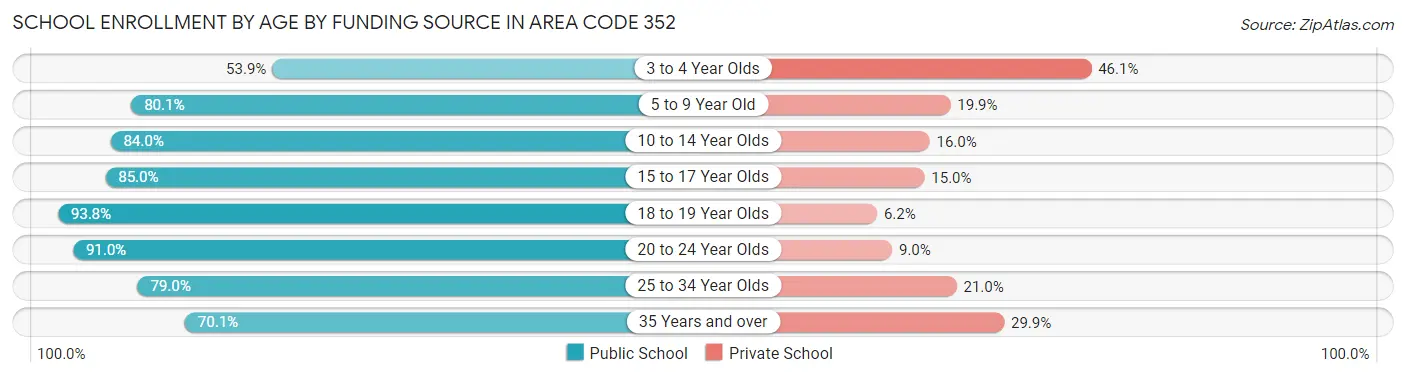
| Age Bracket | Public School | Private School |
| 3 to 4 Year Olds | 7,342 (53.9%) | 6,281 (46.1%) |
| 5 to 9 Year Old | 58,432 (80.1%) | 14,489 (19.9%) |
| 10 to 14 Year Olds | 71,353 (84.0%) | 13,593 (16.0%) |
| 15 to 17 Year Olds | 41,568 (85.0%) | 7,354 (15.0%) |
| 18 to 19 Year Olds | 29,084 (93.8%) | 1,923 (6.2%) |
| 20 to 24 Year Olds | 43,498 (91.0%) | 4,305 (9.0%) |
| 25 to 34 Year Olds | 18,327 (79.0%) | 4,881 (21.0%) |
| 35 Years and over | 13,821 (70.1%) | 5,887 (29.9%) |
| Total | 283,436 (82.8%) | 58,703 (17.2%) |
Educational Attainment by Field of Study in Area Code 352
Business (69,960 | 20.1%), education (53,174 | 15.2%), science & technology (40,565 | 11.6%), bio, nature & agricultural (25,733 | 7.4%), and engineering (23,064 | 6.6%) are the most common fields of study among 348,741 individuals in Area Code 352 who have obtained a bachelor's degree or higher.
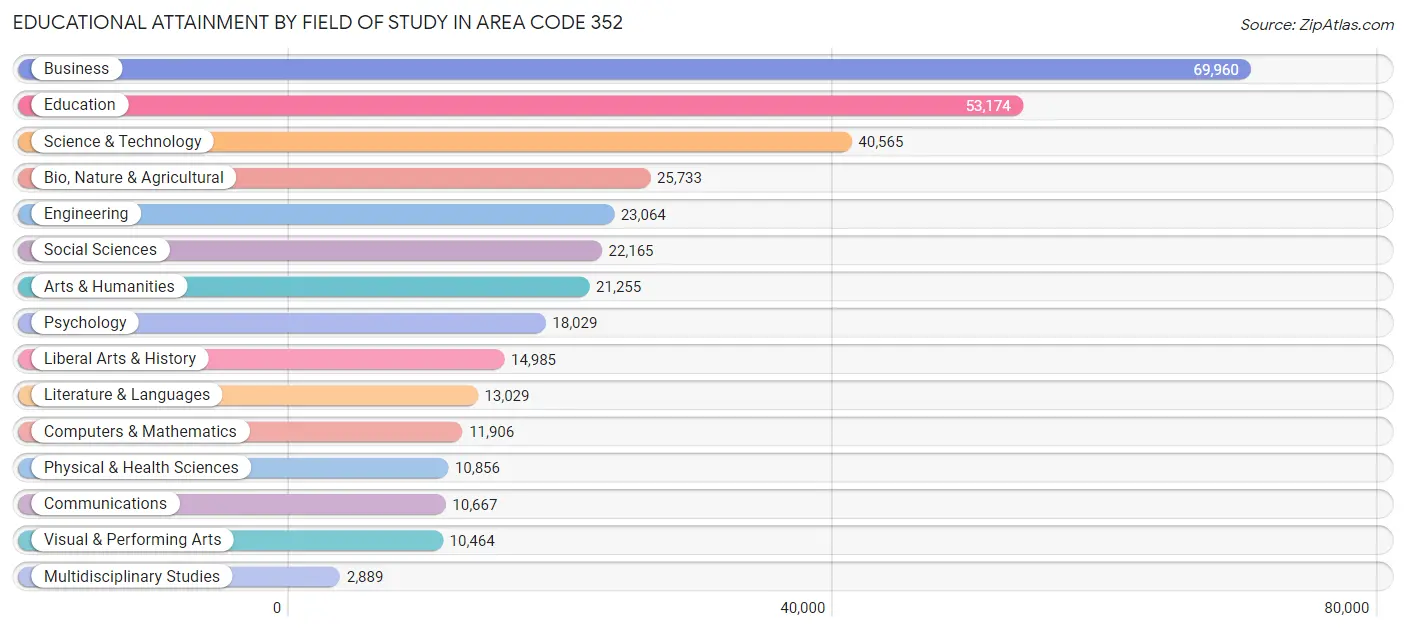
| Field of Study | # Graduates | % Graduates |
| Computers & Mathematics | 11,906 | 3.4% |
| Bio, Nature & Agricultural | 25,733 | 7.4% |
| Physical & Health Sciences | 10,856 | 3.1% |
| Psychology | 18,029 | 5.2% |
| Social Sciences | 22,165 | 6.4% |
| Engineering | 23,064 | 6.6% |
| Multidisciplinary Studies | 2,889 | 0.8% |
| Science & Technology | 40,565 | 11.6% |
| Business | 69,960 | 20.1% |
| Education | 53,174 | 15.2% |
| Literature & Languages | 13,029 | 3.7% |
| Liberal Arts & History | 14,985 | 4.3% |
| Visual & Performing Arts | 10,464 | 3.0% |
| Communications | 10,667 | 3.1% |
| Arts & Humanities | 21,255 | 6.1% |
| Total | 348,741 | 100.0% |
Transportation & Commute in Area Code 352
Vehicle Availability by Sex in Area Code 352
The most prevalent vehicle ownership categories in Area Code 352 are males with 2 vehicles (139,869, accounting for 42.4%) and females with 2 vehicles (127,125, making up 46.1%).
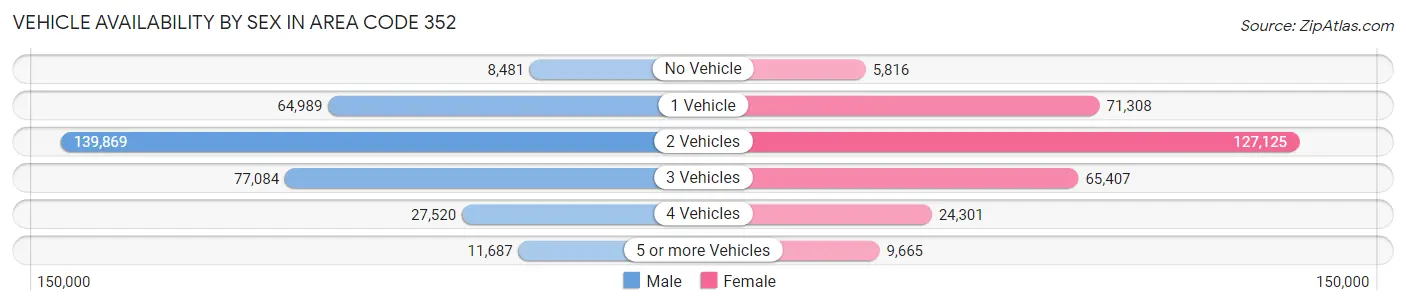
| Vehicles Available | Male | Female |
| No Vehicle | 8,481 (2.6%) | 5,816 (1.9%) |
| 1 Vehicle | 64,989 (19.7%) | 71,308 (23.5%) |
| 2 Vehicles | 139,869 (42.4%) | 127,125 (41.9%) |
| 3 Vehicles | 77,084 (23.4%) | 65,407 (21.5%) |
| 4 Vehicles | 27,520 (8.4%) | 24,301 (8.0%) |
| 5 or more Vehicles | 11,687 (3.5%) | 9,665 (3.2%) |
| Total | 329,630 (100.0%) | 303,622 (100.0%) |
Commute Time in Area Code 352
The most frequently occuring commute durations in Area Code 352 are 15 to 19 minutes (90,499 commuters, 15.9%), 20 to 24 minutes (81,666 commuters, 14.3%), and 30 to 34 minutes (75,792 commuters, 13.3%).
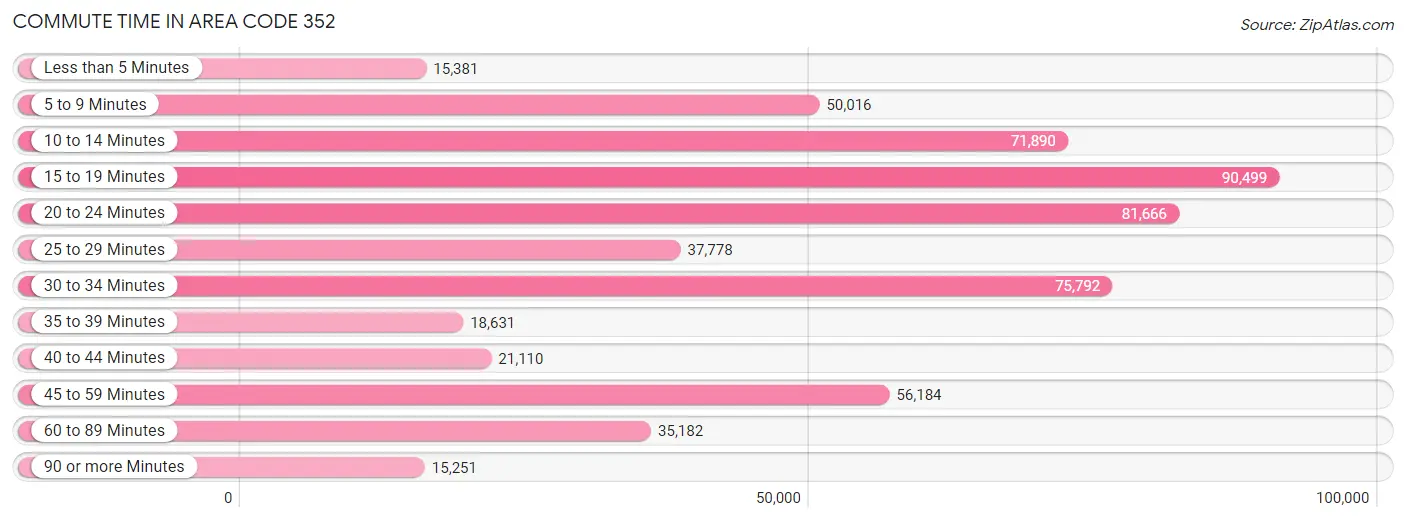
| Commute Time | # Commuters | % Commuters |
| Less than 5 Minutes | 15,381 | 2.7% |
| 5 to 9 Minutes | 50,016 | 8.8% |
| 10 to 14 Minutes | 71,890 | 12.6% |
| 15 to 19 Minutes | 90,499 | 15.9% |
| 20 to 24 Minutes | 81,666 | 14.3% |
| 25 to 29 Minutes | 37,778 | 6.6% |
| 30 to 34 Minutes | 75,792 | 13.3% |
| 35 to 39 Minutes | 18,631 | 3.3% |
| 40 to 44 Minutes | 21,110 | 3.7% |
| 45 to 59 Minutes | 56,184 | 9.9% |
| 60 to 89 Minutes | 35,182 | 6.2% |
| 90 or more Minutes | 15,251 | 2.7% |
Commute Time by Sex in Area Code 352
The most common commute times in Area Code 352 are 15 to 19 minutes (45,916 commuters, 15.3%) for males and 15 to 19 minutes (44,583 commuters, 16.5%) for females.
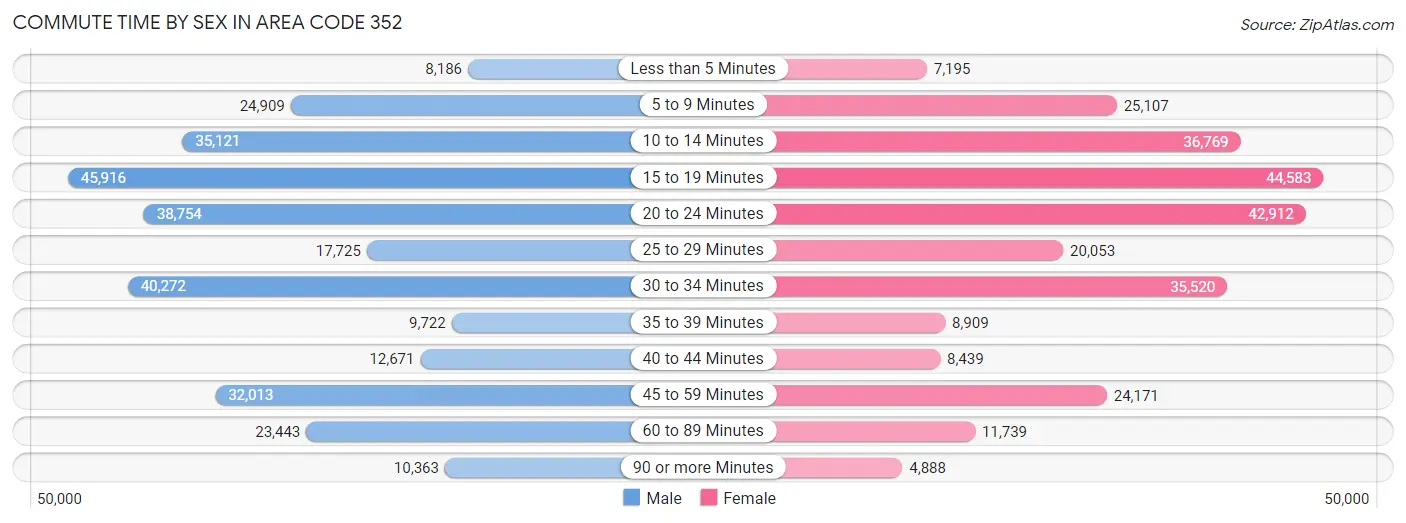
| Commute Time | Male | Female |
| Less than 5 Minutes | 8,186 (2.7%) | 7,195 (2.7%) |
| 5 to 9 Minutes | 24,909 (8.3%) | 25,107 (9.3%) |
| 10 to 14 Minutes | 35,121 (11.7%) | 36,769 (13.6%) |
| 15 to 19 Minutes | 45,916 (15.3%) | 44,583 (16.5%) |
| 20 to 24 Minutes | 38,754 (13.0%) | 42,912 (15.9%) |
| 25 to 29 Minutes | 17,725 (5.9%) | 20,053 (7.4%) |
| 30 to 34 Minutes | 40,272 (13.5%) | 35,520 (13.1%) |
| 35 to 39 Minutes | 9,722 (3.3%) | 8,909 (3.3%) |
| 40 to 44 Minutes | 12,671 (4.2%) | 8,439 (3.1%) |
| 45 to 59 Minutes | 32,013 (10.7%) | 24,171 (8.9%) |
| 60 to 89 Minutes | 23,443 (7.8%) | 11,739 (4.3%) |
| 90 or more Minutes | 10,363 (3.5%) | 4,888 (1.8%) |
Time of Departure to Work by Sex in Area Code 352
The most frequent times of departure to work in Area Code 352 are 7:00 AM to 7:29 AM (42,418, 14.2%) for males and 7:00 AM to 7:29 AM (46,695, 17.3%) for females.
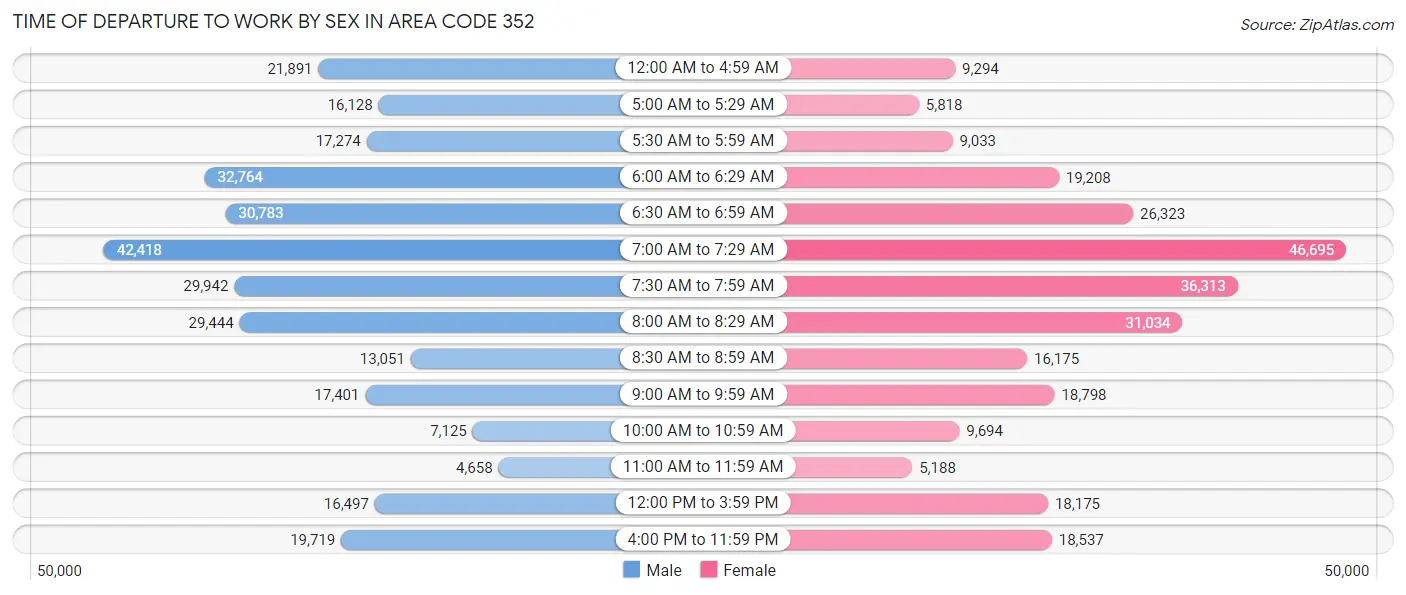
| Time of Departure | Male | Female |
| 12:00 AM to 4:59 AM | 21,891 (7.3%) | 9,294 (3.4%) |
| 5:00 AM to 5:29 AM | 16,128 (5.4%) | 5,818 (2.1%) |
| 5:30 AM to 5:59 AM | 17,274 (5.8%) | 9,033 (3.3%) |
| 6:00 AM to 6:29 AM | 32,764 (11.0%) | 19,208 (7.1%) |
| 6:30 AM to 6:59 AM | 30,783 (10.3%) | 26,323 (9.7%) |
| 7:00 AM to 7:29 AM | 42,418 (14.2%) | 46,695 (17.3%) |
| 7:30 AM to 7:59 AM | 29,942 (10.0%) | 36,313 (13.4%) |
| 8:00 AM to 8:29 AM | 29,444 (9.8%) | 31,034 (11.5%) |
| 8:30 AM to 8:59 AM | 13,051 (4.4%) | 16,175 (6.0%) |
| 9:00 AM to 9:59 AM | 17,401 (5.8%) | 18,798 (7.0%) |
| 10:00 AM to 10:59 AM | 7,125 (2.4%) | 9,694 (3.6%) |
| 11:00 AM to 11:59 AM | 4,658 (1.6%) | 5,188 (1.9%) |
| 12:00 PM to 3:59 PM | 16,497 (5.5%) | 18,175 (6.7%) |
| 4:00 PM to 11:59 PM | 19,719 (6.6%) | 18,537 (6.9%) |
| Total | 299,095 (100.0%) | 270,285 (100.0%) |
Housing Occupancy in Area Code 352
Occupancy by Ownership in Area Code 352
Of the total 682,316 dwellings in Area Code 352, owner-occupied units account for 516,575 (75.7%), while renter-occupied units make up 165,741 (24.3%).
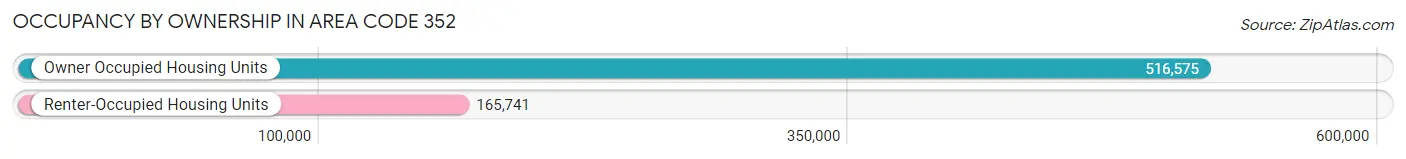
| Occupancy | # Housing Units | % Housing Units |
| Owner Occupied Housing Units | 516,575 | 75.7% |
| Renter-Occupied Housing Units | 165,741 | 24.3% |
| Total Occupied Housing Units | 682,316 | 100.0% |
Occupancy by Household Size in Area Code 352
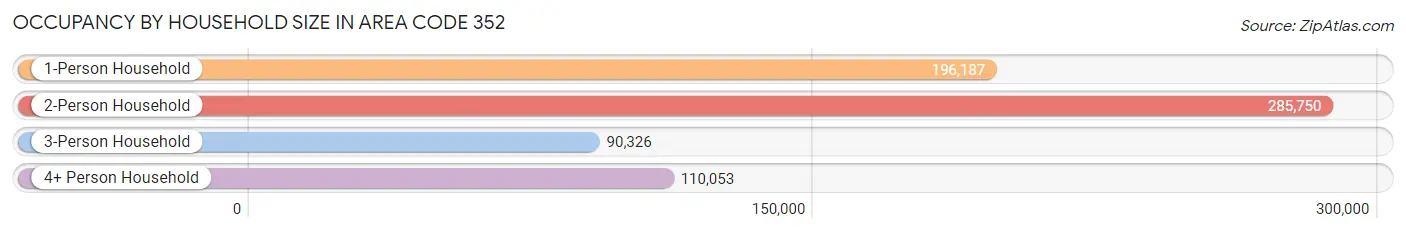
| Household Size | # Housing Units | % Housing Units |
| 1-Person Household | 196,187 | 28.7% |
| 2-Person Household | 285,750 | 41.9% |
| 3-Person Household | 90,326 | 13.2% |
| 4+ Person Household | 110,053 | 16.1% |
| Total Housing Units | 682,316 | 100.0% |
Occupancy by Ownership by Household Size in Area Code 352
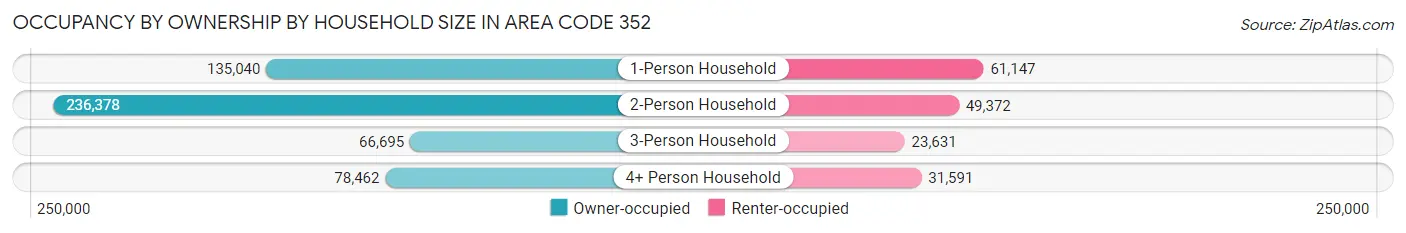
| Household Size | Owner-occupied | Renter-occupied |
| 1-Person Household | 135,040 (68.8%) | 61,147 (31.2%) |
| 2-Person Household | 236,378 (82.7%) | 49,372 (17.3%) |
| 3-Person Household | 66,695 (73.8%) | 23,631 (26.2%) |
| 4+ Person Household | 78,462 (71.3%) | 31,591 (28.7%) |
| Total Housing Units | 516,575 (75.7%) | 165,741 (24.3%) |
Occupancy by Educational Attainment in Area Code 352
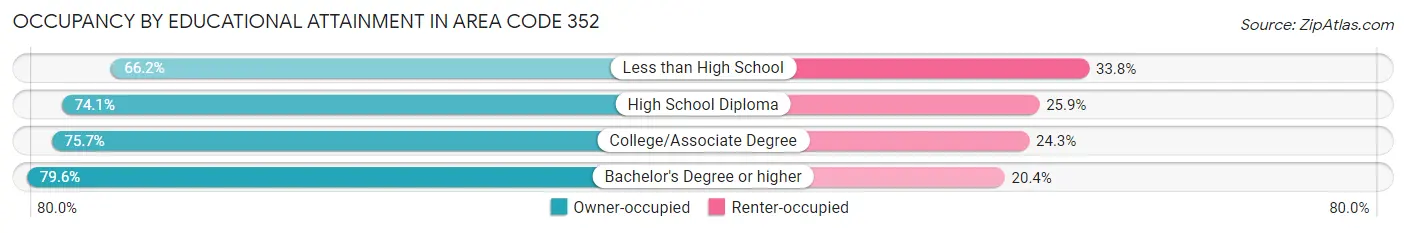
| Household Size | Owner-occupied | Renter-occupied |
| Less than High School | 35,486 (66.2%) | 18,090 (33.8%) |
| High School Diploma | 139,173 (74.1%) | 48,554 (25.9%) |
| College/Associate Degree | 180,528 (75.7%) | 57,809 (24.3%) |
| Bachelor's Degree or higher | 161,388 (79.6%) | 41,288 (20.4%) |
Occupancy by Age of Householder in Area Code 352
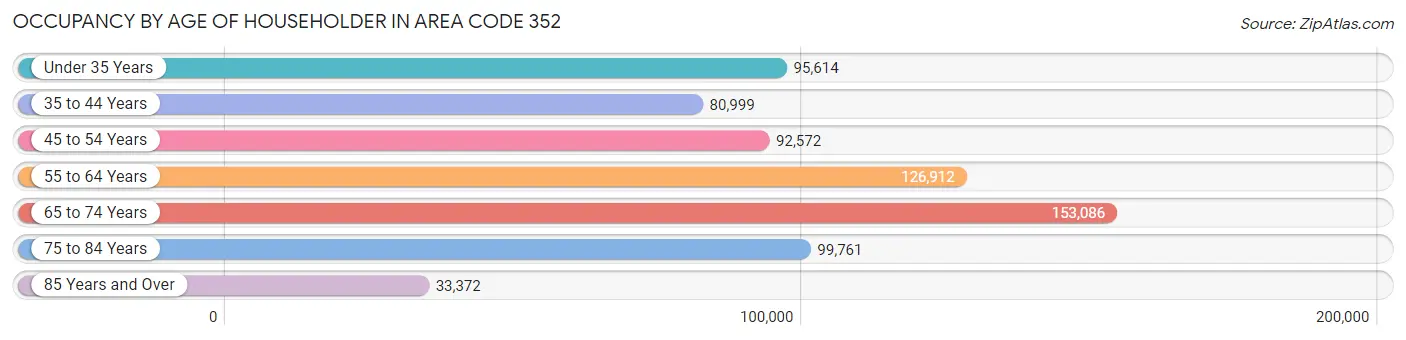
| Age Bracket | # Households | % Households |
| Under 35 Years | 95,614 | 14.0% |
| 35 to 44 Years | 80,999 | 11.9% |
| 45 to 54 Years | 92,572 | 13.6% |
| 55 to 64 Years | 126,912 | 18.6% |
| 65 to 74 Years | 153,086 | 22.4% |
| 75 to 84 Years | 99,761 | 14.6% |
| 85 Years and Over | 33,372 | 4.9% |
| Total | 682,316 | 100.0% |
Housing Finances in Area Code 352
Median Income by Occupancy in Area Code 352
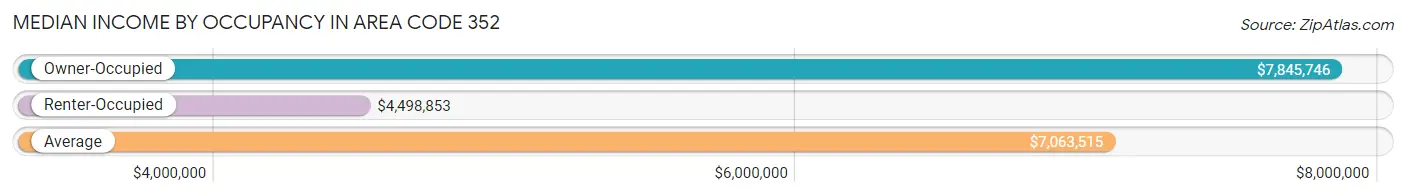
| Occupancy Type | # Households | Median Income |
| Owner-Occupied | 516,575 (75.7%) | $7,845,746 |
| Renter-Occupied | 165,741 (24.3%) | $4,498,853 |
| Average | 682,316 (100.0%) | $7,063,515 |
Occupancy by Householder Income Bracket in Area Code 352
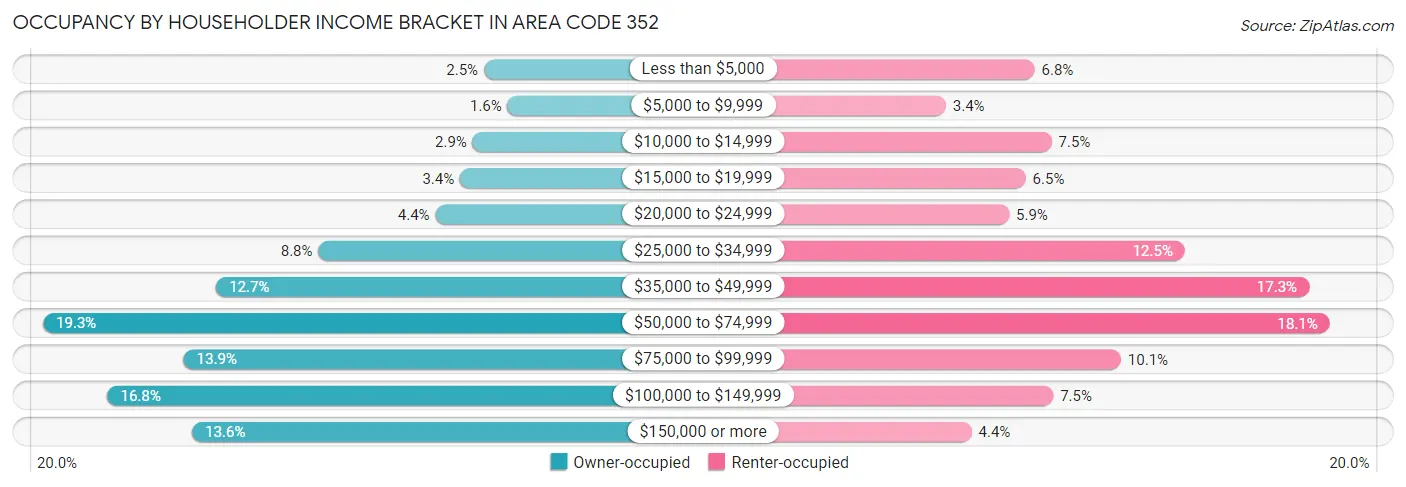
| Income Bracket | Owner-occupied | Renter-occupied |
| Less than $5,000 | 12,940 (2.5%) | 11,307 (6.8%) |
| $5,000 to $9,999 | 8,284 (1.6%) | 5,708 (3.4%) |
| $10,000 to $14,999 | 15,132 (2.9%) | 12,380 (7.5%) |
| $15,000 to $19,999 | 17,603 (3.4%) | 10,732 (6.5%) |
| $20,000 to $24,999 | 22,465 (4.3%) | 9,700 (5.9%) |
| $25,000 to $34,999 | 45,518 (8.8%) | 20,787 (12.5%) |
| $35,000 to $49,999 | 65,584 (12.7%) | 28,626 (17.3%) |
| $50,000 to $74,999 | 99,692 (19.3%) | 29,940 (18.1%) |
| $75,000 to $99,999 | 72,018 (13.9%) | 16,763 (10.1%) |
| $100,000 to $149,999 | 86,991 (16.8%) | 12,480 (7.5%) |
| $150,000 or more | 70,348 (13.6%) | 7,318 (4.4%) |
| Total | 516,575 (100.0%) | 165,741 (100.0%) |
Monthly Housing Cost Tiers in Area Code 352
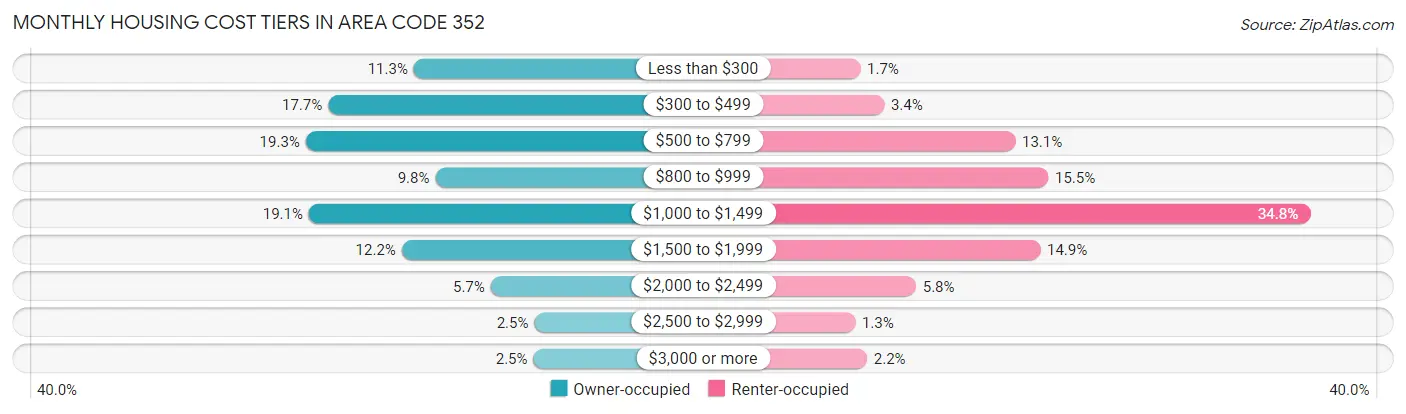
| Monthly Cost | Owner-occupied | Renter-occupied |
| Less than $300 | 58,554 (11.3%) | 2,776 (1.7%) |
| $300 to $499 | 91,164 (17.6%) | 5,690 (3.4%) |
| $500 to $799 | 99,720 (19.3%) | 21,680 (13.1%) |
| $800 to $999 | 50,349 (9.8%) | 25,703 (15.5%) |
| $1,000 to $1,499 | 98,524 (19.1%) | 57,679 (34.8%) |
| $1,500 to $1,999 | 63,154 (12.2%) | 24,722 (14.9%) |
| $2,000 to $2,499 | 29,344 (5.7%) | 9,566 (5.8%) |
| $2,500 to $2,999 | 12,692 (2.5%) | 2,130 (1.3%) |
| $3,000 or more | 13,074 (2.5%) | 3,600 (2.2%) |
| Total | 516,575 (100.0%) | 165,741 (100.0%) |
Physical Housing Characteristics in Area Code 352
Housing Structures in Area Code 352
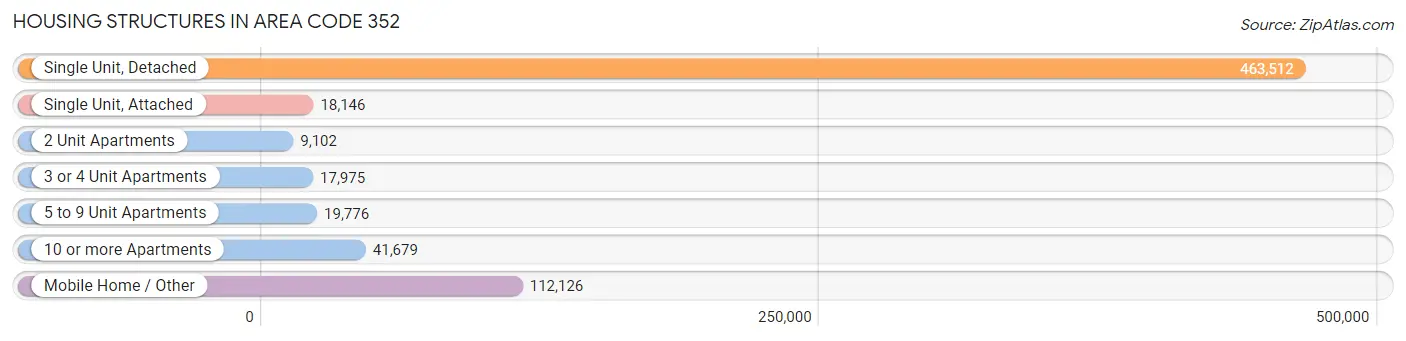
| Structure Type | # Housing Units | % Housing Units |
| Single Unit, Detached | 463,512 | 67.9% |
| Single Unit, Attached | 18,146 | 2.7% |
| 2 Unit Apartments | 9,102 | 1.3% |
| 3 or 4 Unit Apartments | 17,975 | 2.6% |
| 5 to 9 Unit Apartments | 19,776 | 2.9% |
| 10 or more Apartments | 41,679 | 6.1% |
| Mobile Home / Other | 112,126 | 16.4% |
| Total | 682,316 | 100.0% |
Housing Structures by Occupancy in Area Code 352
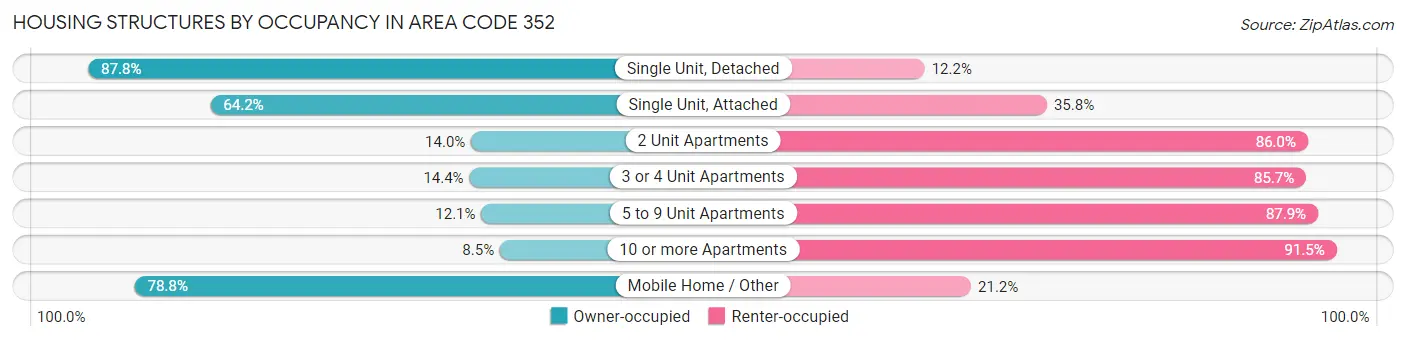
| Structure Type | Owner-occupied | Renter-occupied |
| Single Unit, Detached | 406,769 (87.8%) | 56,743 (12.2%) |
| Single Unit, Attached | 11,653 (64.2%) | 6,493 (35.8%) |
| 2 Unit Apartments | 1,276 (14.0%) | 7,826 (86.0%) |
| 3 or 4 Unit Apartments | 2,579 (14.3%) | 15,396 (85.7%) |
| 5 to 9 Unit Apartments | 2,385 (12.1%) | 17,391 (87.9%) |
| 10 or more Apartments | 3,529 (8.5%) | 38,150 (91.5%) |
| Mobile Home / Other | 88,384 (78.8%) | 23,742 (21.2%) |
| Total | 516,575 (75.7%) | 165,741 (24.3%) |
Housing Structures by Number of Rooms in Area Code 352
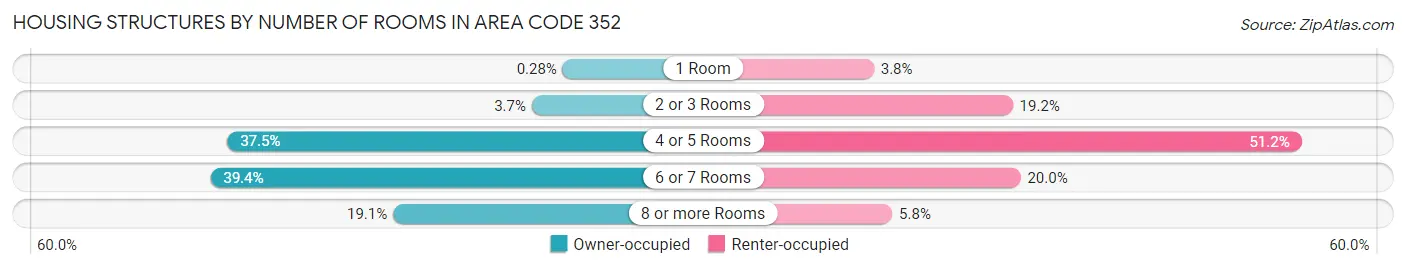
| Number of Rooms | Owner-occupied | Renter-occupied |
| 1 Room | 1,442 (0.3%) | 6,236 (3.8%) |
| 2 or 3 Rooms | 19,151 (3.7%) | 31,776 (19.2%) |
| 4 or 5 Rooms | 193,758 (37.5%) | 84,899 (51.2%) |
| 6 or 7 Rooms | 203,482 (39.4%) | 33,219 (20.0%) |
| 8 or more Rooms | 98,742 (19.1%) | 9,611 (5.8%) |
| Total | 516,575 (100.0%) | 165,741 (100.0%) |
Housing Structure by Heating Type in Area Code 352
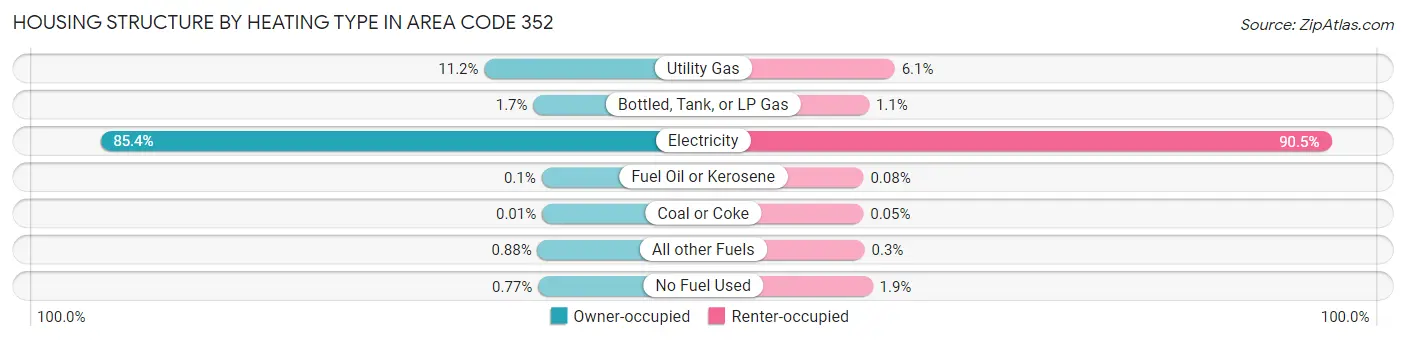
| Heating Type | Owner-occupied | Renter-occupied |
| Utility Gas | 57,675 (11.2%) | 10,151 (6.1%) |
| Bottled, Tank, or LP Gas | 8,729 (1.7%) | 1,887 (1.1%) |
| Electricity | 441,092 (85.4%) | 149,922 (90.5%) |
| Fuel Oil or Kerosene | 532 (0.1%) | 135 (0.1%) |
| Coal or Coke | 35 (0.0%) | 81 (0.1%) |
| All other Fuels | 4,526 (0.9%) | 491 (0.3%) |
| No Fuel Used | 3,986 (0.8%) | 3,074 (1.8%) |
| Total | 516,575 (100.0%) | 165,741 (100.0%) |
Household Vehicle Usage in Area Code 352
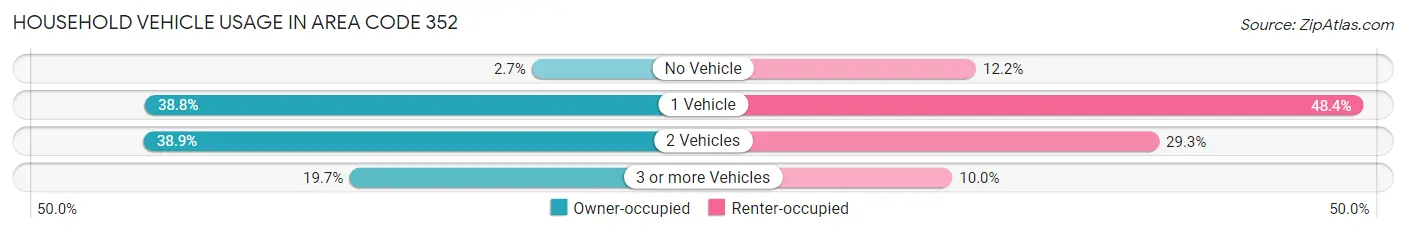
| Vehicles per Household | Owner-occupied | Renter-occupied |
| No Vehicle | 13,823 (2.7%) | 20,294 (12.2%) |
| 1 Vehicle | 200,170 (38.8%) | 80,204 (48.4%) |
| 2 Vehicles | 200,761 (38.9%) | 48,613 (29.3%) |
| 3 or more Vehicles | 101,821 (19.7%) | 16,630 (10.0%) |
| Total | 516,575 (100.0%) | 165,741 (100.0%) |
Real Estate & Mortgages in Area Code 352
Real Estate and Mortgage Overview in Area Code 352
| Characteristic | Without Mortgage | With Mortgage |
| Housing Units | 256,012 | 260,563 |
| Median Property Value | $21,261,800 | $27,250,900 |
| Median Household Income | $6,126,165 | $45,482 |
| Monthly Housing Costs | $51,096 | $12,301 |
| Real Estate Taxes | $164,371 | $8,102 |
Property Value by Mortgage Status in Area Code 352
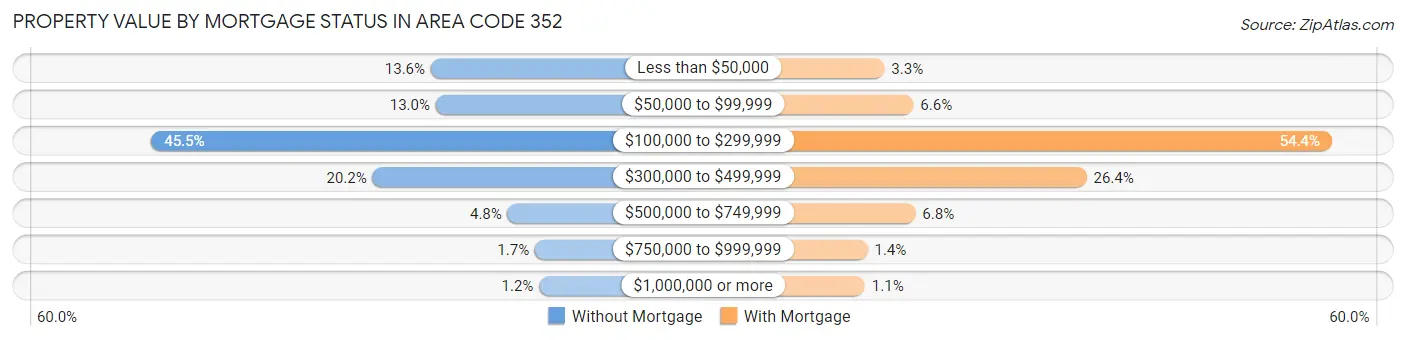
| Property Value | Without Mortgage | With Mortgage |
| Less than $50,000 | 34,743 (13.6%) | 8,590 (3.3%) |
| $50,000 to $99,999 | 33,318 (13.0%) | 17,211 (6.6%) |
| $100,000 to $299,999 | 116,547 (45.5%) | 141,824 (54.4%) |
| $300,000 to $499,999 | 51,786 (20.2%) | 68,776 (26.4%) |
| $500,000 to $749,999 | 12,297 (4.8%) | 17,817 (6.8%) |
| $750,000 to $999,999 | 4,282 (1.7%) | 3,565 (1.4%) |
| $1,000,000 or more | 3,039 (1.2%) | 2,780 (1.1%) |
| Total | 256,012 (100.0%) | 260,563 (100.0%) |
Household Income by Mortgage Status in Area Code 352
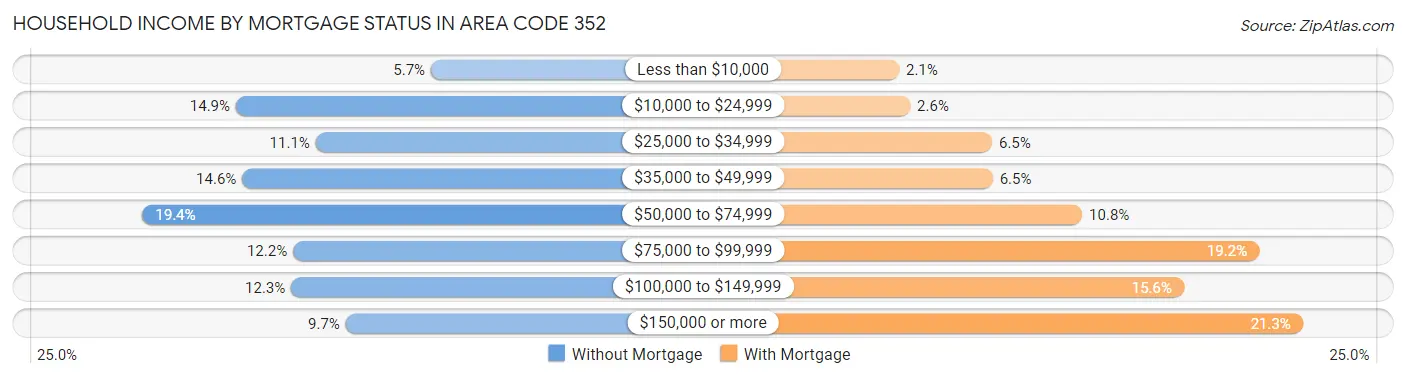
| Household Income | Without Mortgage | With Mortgage |
| Less than $10,000 | 14,455 (5.7%) | 5,394 (2.1%) |
| $10,000 to $24,999 | 38,258 (14.9%) | 6,769 (2.6%) |
| $25,000 to $34,999 | 28,508 (11.1%) | 16,942 (6.5%) |
| $35,000 to $49,999 | 37,482 (14.6%) | 17,010 (6.5%) |
| $50,000 to $74,999 | 49,642 (19.4%) | 28,102 (10.8%) |
| $75,000 to $99,999 | 31,290 (12.2%) | 50,050 (19.2%) |
| $100,000 to $149,999 | 31,511 (12.3%) | 40,728 (15.6%) |
| $150,000 or more | 24,866 (9.7%) | 55,480 (21.3%) |
| Total | 256,012 (100.0%) | 260,563 (100.0%) |
Property Value to Household Income Ratio in Area Code 352
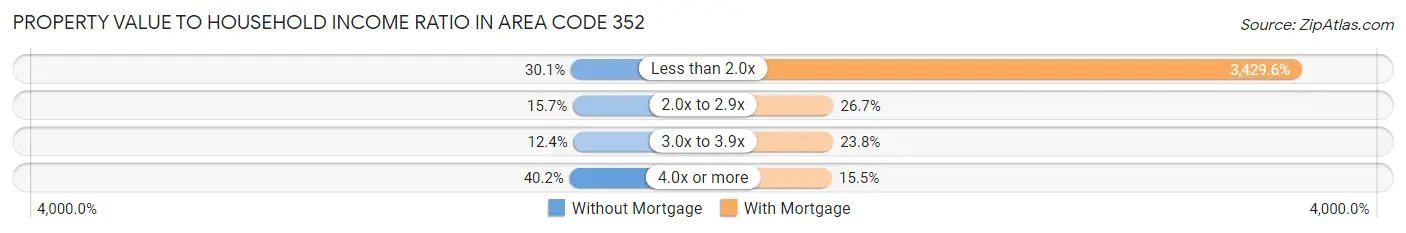
| Value-to-Income Ratio | Without Mortgage | With Mortgage |
| Less than 2.0x | 76,920 (30.0%) | 8,936,306 (3,429.6%) |
| 2.0x to 2.9x | 40,071 (15.7%) | 69,546 (26.7%) |
| 3.0x to 3.9x | 31,847 (12.4%) | 62,078 (23.8%) |
| 4.0x or more | 103,005 (40.2%) | 40,381 (15.5%) |
| Total | 256,012 (100.0%) | 260,563 (100.0%) |
Real Estate Taxes by Mortgage Status in Area Code 352
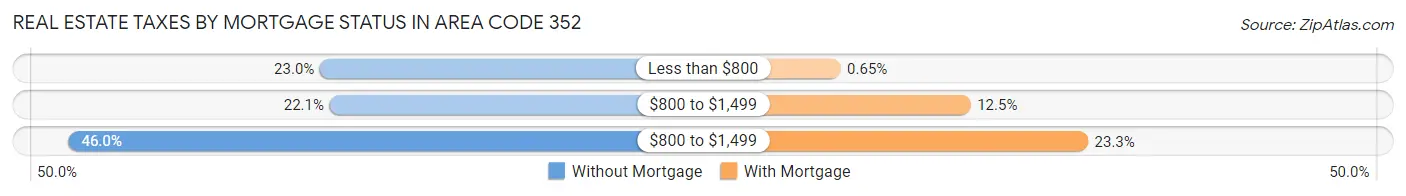
| Property Taxes | Without Mortgage | With Mortgage |
| Less than $800 | 58,905 (23.0%) | 1,683 (0.6%) |
| $800 to $1,499 | 56,655 (22.1%) | 32,645 (12.5%) |
| $800 to $1,499 | 117,707 (46.0%) | 60,581 (23.3%) |
| Total | 256,012 (100.0%) | 260,563 (100.0%) |
Health & Disability in Area Code 352
Health Insurance Coverage by Age in Area Code 352
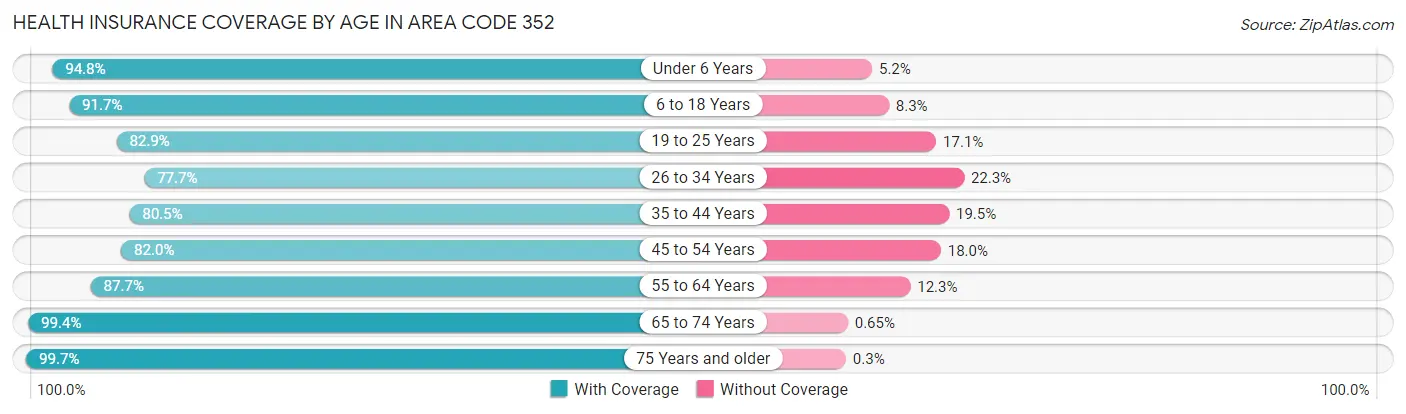
| Age Bracket | With Coverage | Without Coverage |
| Under 6 Years | 82,897 (94.8%) | 4,517 (5.2%) |
| 6 to 18 Years | 205,159 (91.7%) | 18,582 (8.3%) |
| 19 to 25 Years | 118,657 (82.9%) | 24,529 (17.1%) |
| 26 to 34 Years | 122,105 (77.7%) | 35,063 (22.3%) |
| 35 to 44 Years | 131,448 (80.5%) | 31,894 (19.5%) |
| 45 to 54 Years | 142,748 (82.0%) | 31,311 (18.0%) |
| 55 to 64 Years | 196,977 (87.7%) | 27,622 (12.3%) |
| 65 to 74 Years | 252,744 (99.4%) | 1,647 (0.6%) |
| 75 Years and older | 209,101 (99.7%) | 628 (0.3%) |
| Total | 1,461,836 (89.3%) | 175,793 (10.7%) |
Health Insurance Coverage by Citizenship Status in Area Code 352
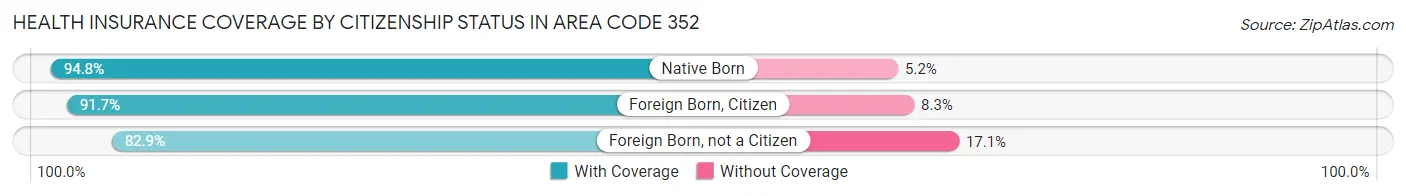
| Citizenship Status | With Coverage | Without Coverage |
| Native Born | 82,897 (94.8%) | 4,517 (5.2%) |
| Foreign Born, Citizen | 205,159 (91.7%) | 18,582 (8.3%) |
| Foreign Born, not a Citizen | 118,657 (82.9%) | 24,529 (17.1%) |
Health Insurance Coverage by Household Income in Area Code 352
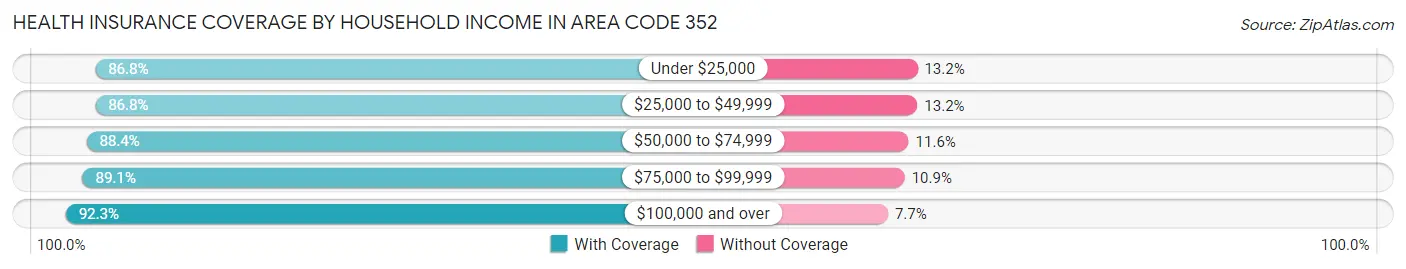
| Household Income | With Coverage | Without Coverage |
| Under $25,000 | 185,704 (86.8%) | 28,335 (13.2%) |
| $25,000 to $49,999 | 285,442 (86.8%) | 43,524 (13.2%) |
| $50,000 to $74,999 | 276,005 (88.4%) | 36,199 (11.6%) |
| $75,000 to $99,999 | 208,182 (89.1%) | 25,356 (10.9%) |
| $100,000 and over | 489,585 (92.3%) | 40,923 (7.7%) |
Public vs Private Health Insurance Coverage by Age in Area Code 352
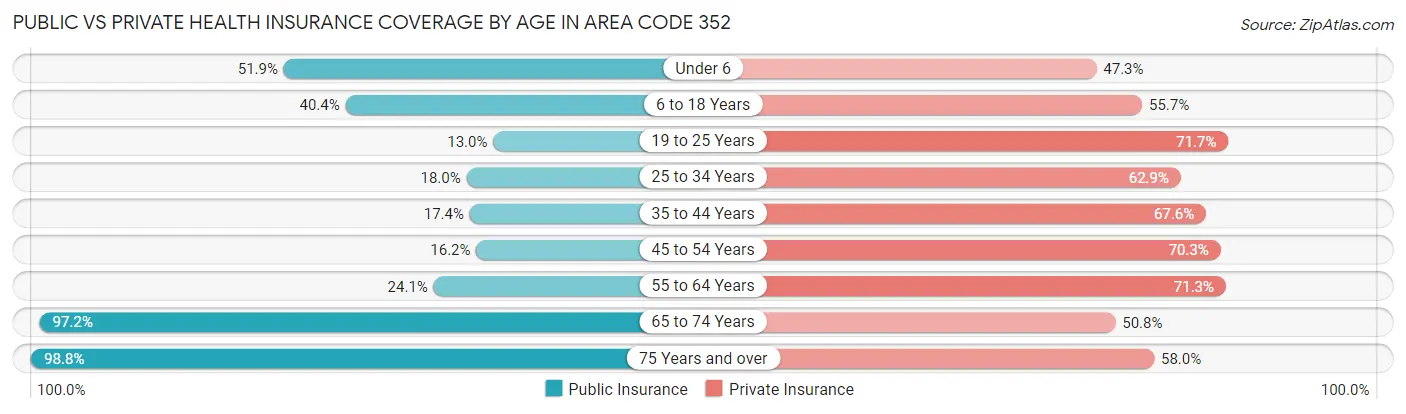
| Age Bracket | Public Insurance | Private Insurance |
| Under 6 | 45,356 (51.9%) | 41,305 (47.2%) |
| 6 to 18 Years | 90,453 (40.4%) | 124,699 (55.7%) |
| 19 to 25 Years | 18,628 (13.0%) | 102,725 (71.7%) |
| 25 to 34 Years | 28,225 (18.0%) | 98,883 (62.9%) |
| 35 to 44 Years | 28,362 (17.4%) | 110,406 (67.6%) |
| 45 to 54 Years | 28,113 (16.2%) | 122,402 (70.3%) |
| 55 to 64 Years | 54,061 (24.1%) | 160,089 (71.3%) |
| 65 to 74 Years | 247,312 (97.2%) | 129,135 (50.8%) |
| 75 Years and over | 207,218 (98.8%) | 121,550 (58.0%) |
| Total | 747,728 (45.7%) | 1,011,194 (61.8%) |
Disability Status by Sex by Age in Area Code 352
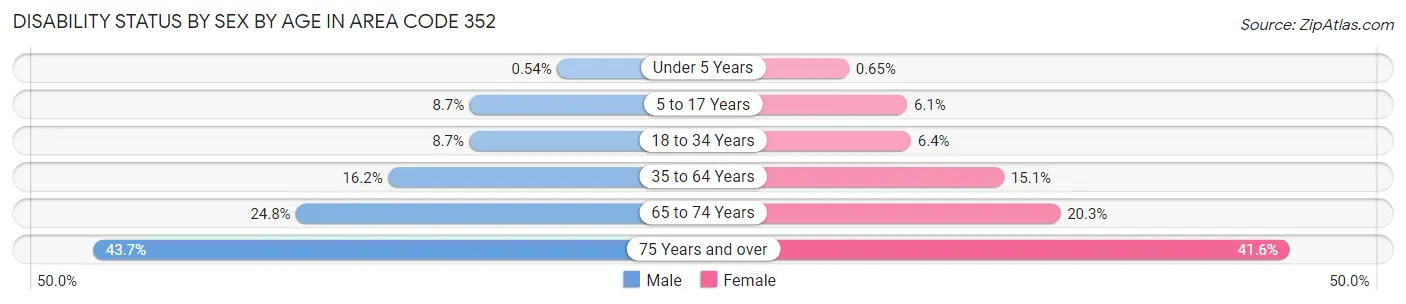
| Age Bracket | Male | Female |
| Under 5 Years | 200 (0.5%) | 234 (0.6%) |
| 5 to 17 Years | 9,622 (8.6%) | 6,352 (6.1%) |
| 18 to 34 Years | 13,972 (8.7%) | 10,343 (6.4%) |
| 35 to 64 Years | 43,829 (16.2%) | 43,931 (15.0%) |
| 65 to 74 Years | 29,035 (24.8%) | 27,801 (20.3%) |
| 75 Years and over | 42,914 (43.7%) | 46,347 (41.6%) |
Disability Class by Sex by Age in Area Code 352
Disability Class: Hearing Difficulty
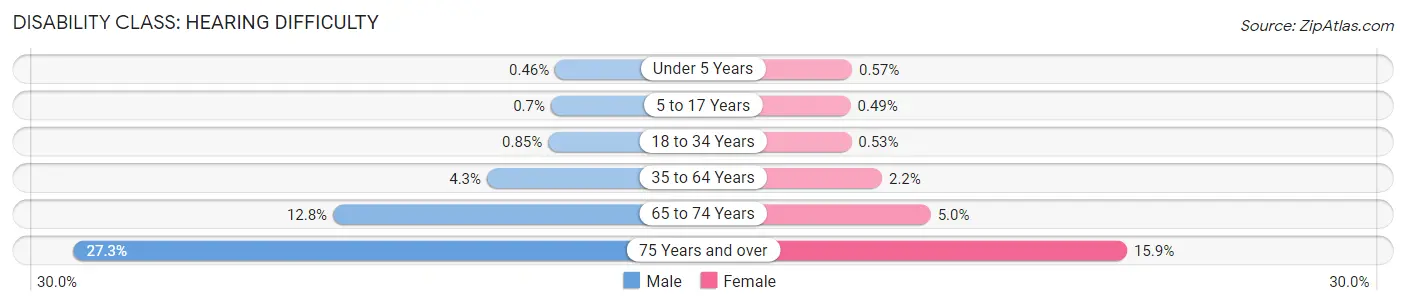
| Age Bracket | Male | Female |
| Under 5 Years | 172 (0.5%) | 204 (0.6%) |
| 5 to 17 Years | 776 (0.7%) | 516 (0.5%) |
| 18 to 34 Years | 1,361 (0.9%) | 859 (0.5%) |
| 35 to 64 Years | 11,509 (4.3%) | 6,549 (2.2%) |
| 65 to 74 Years | 15,034 (12.8%) | 6,787 (5.0%) |
| 75 Years and over | 26,793 (27.3%) | 17,701 (15.9%) |
Disability Class: Vision Difficulty
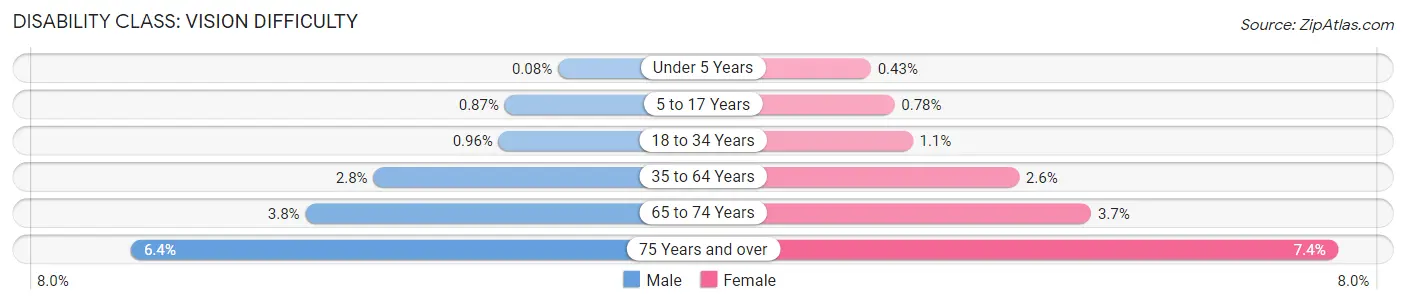
| Age Bracket | Male | Female |
| Under 5 Years | 28 (0.1%) | 157 (0.4%) |
| 5 to 17 Years | 970 (0.9%) | 819 (0.8%) |
| 18 to 34 Years | 1,549 (1.0%) | 1,701 (1.1%) |
| 35 to 64 Years | 7,610 (2.8%) | 7,686 (2.6%) |
| 65 to 74 Years | 4,492 (3.8%) | 5,076 (3.7%) |
| 75 Years and over | 6,309 (6.4%) | 8,201 (7.4%) |
Disability Class: Cognitive Difficulty
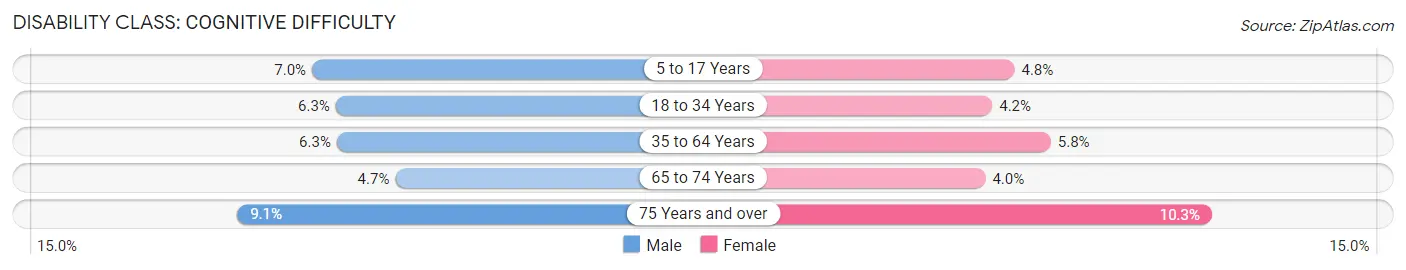
| Age Bracket | Male | Female |
| 5 to 17 Years | 7,786 (7.0%) | 5,047 (4.8%) |
| 18 to 34 Years | 10,213 (6.3%) | 6,767 (4.2%) |
| 35 to 64 Years | 17,035 (6.3%) | 17,002 (5.8%) |
| 65 to 74 Years | 5,484 (4.7%) | 5,485 (4.0%) |
| 75 Years and over | 8,922 (9.1%) | 11,482 (10.3%) |
Disability Class: Ambulatory Difficulty
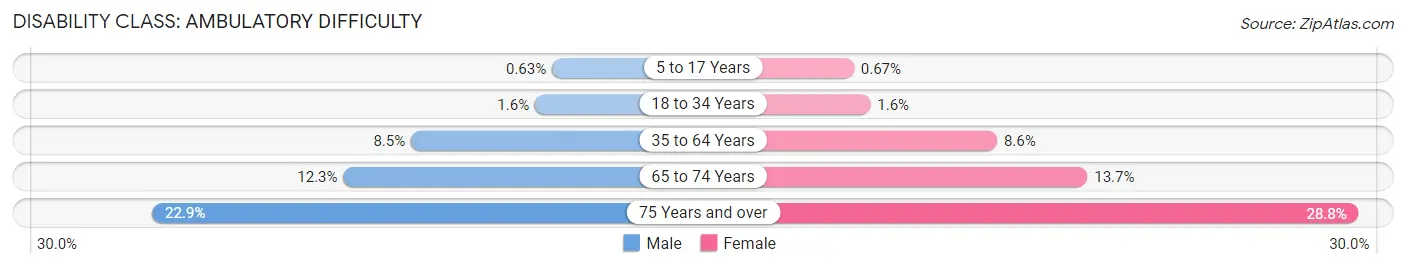
| Age Bracket | Male | Female |
| 5 to 17 Years | 705 (0.6%) | 703 (0.7%) |
| 18 to 34 Years | 2,537 (1.6%) | 2,568 (1.6%) |
| 35 to 64 Years | 22,887 (8.5%) | 25,225 (8.6%) |
| 65 to 74 Years | 14,355 (12.2%) | 18,756 (13.7%) |
| 75 Years and over | 22,499 (22.9%) | 32,082 (28.8%) |
Disability Class: Self-Care Difficulty
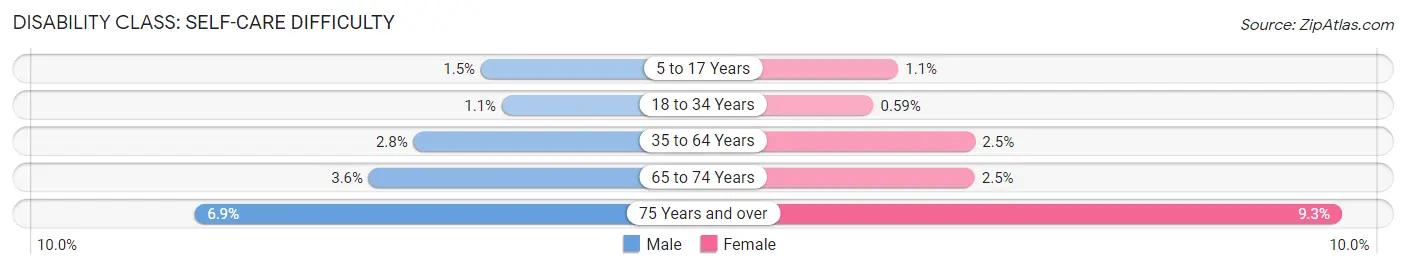
| Age Bracket | Male | Female |
| 5 to 17 Years | 1,706 (1.5%) | 1,104 (1.1%) |
| 18 to 34 Years | 1,838 (1.1%) | 952 (0.6%) |
| 35 to 64 Years | 7,499 (2.8%) | 7,248 (2.5%) |
| 65 to 74 Years | 4,226 (3.6%) | 3,385 (2.5%) |
| 75 Years and over | 6,732 (6.9%) | 10,343 (9.3%) |
Technology Access in Area Code 352
Computing Device Access in Area Code 352
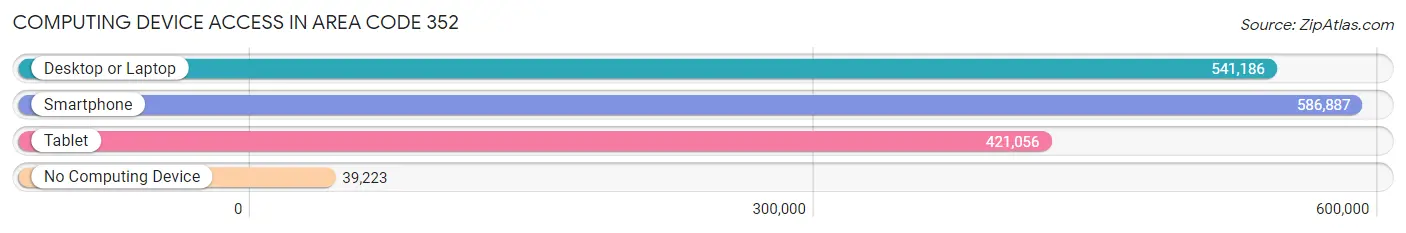
| Device Type | # Households | % Households |
| Desktop or Laptop | 541,186 | 79.3% |
| Smartphone | 586,887 | 86.0% |
| Tablet | 421,056 | 61.7% |
| No Computing Device | 39,223 | 5.8% |
| Total | 682,316 | 100.0% |
Internet Access in Area Code 352
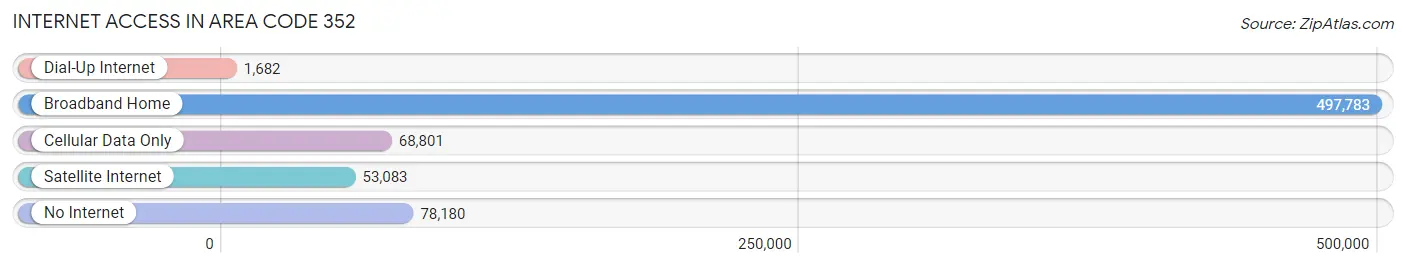
| Internet Type | # Households | % Households |
| Dial-Up Internet | 1,682 | 0.3% |
| Broadband Home | 497,783 | 73.0% |
| Cellular Data Only | 68,801 | 10.1% |
| Satellite Internet | 53,083 | 7.8% |
| No Internet | 78,180 | 11.5% |
| Total | 682,316 | 100.0% |
Area Code 352 Summary
Geography
Area code 352 is a telephone area code in the North American Numbering Plan (NANP) for the state of Florida. It serves the Gainesville, Ocala, and the Nature Coast regions of the state. It was created in 1996 when it was split off from area code 904.
Social
Area code 352 is home to a diverse population of people from all walks of life. The area is known for its vibrant culture, with a variety of festivals and events throughout the year. It is also home to a number of universities and colleges, including the University of Florida and Santa Fe College.
Economics
Area code 352 is a major economic hub in the state of Florida. It is home to a number of large companies, including the University of Florida, Shands Healthcare, and the Ocala Regional Medical Center. The area is also home to a number of smaller businesses, such as restaurants, retail stores, and other services.
Demographics
Area code 352 is home to a population of over 1.2 million people. The population is diverse, with a mix of races and ethnicities. The median age is 37.5 years, and the median household income is $45,000. The area is also home to a large number of retirees, with over 20% of the population over the age of 65.
Common Questions
What is Per Capita Income in Area Code 352?
Per Capita income in Area Code 352 is $31,684.
What is the Median Family Income in Area Code 352?
Median Family Income in Area Code 352 is $72,308.
What is the Median Household income in Area Code 352?
Median Household Income in Area Code 352 is $59,860.
What is Income or Wage Gap in Area Code 352?
Income or Wage Gap in Area Code 352 is 23.6%.
Women in Area Code 352 earn 76.4 cents for every dollar earned by a man.
What is Family Income Deficit in Area Code 352?
Family Income Deficit in Area Code 352 is $10,564.
Families that are below poverty line in Area Code 352 earn $10,564 less on average than the poverty threshold level.
What is Inequality or Gini Index in Area Code 352?
Inequality or Gini Index in Area Code 352 is 51.74.
What is the Total Population of Area Code 352?
Total Population of Area Code 352 is 1,668,150.
What is the Total Male Population of Area Code 352?
Total Male Population of Area Code 352 is 815,237.
What is the Total Female Population of Area Code 352?
Total Female Population of Area Code 352 is 852,913.
What is the Ratio of Males per 100 Females in Area Code 352?
There are 95.58 Males per 100 Females in Area Code 352.
What is the Ratio of Females per 100 Males in Area Code 352?
There are 104.62 Females per 100 Males in Area Code 352.
What is the Median Population Age in Area Code 352?
Median Population Age in Area Code 352 is 48.0 Years.
What is the Average Family Size in Area Code 352
Average Family Size in Area Code 352 is 2.9 People.
What is the Average Household Size in Area Code 352
Average Household Size in Area Code 352 is 2.4 People.
How Large is the Labor Force in Area Code 352?
There are 697,030 People in the Labor Forcein in Area Code 352.
What is the Percentage of People in the Labor Force in Area Code 352?
49.4% of People are in the Labor Force in Area Code 352.
What is the Unemployment Rate in Area Code 352?
Unemployment Rate in Area Code 352 is 6.5%.