Area Code 281 Map & Demographics
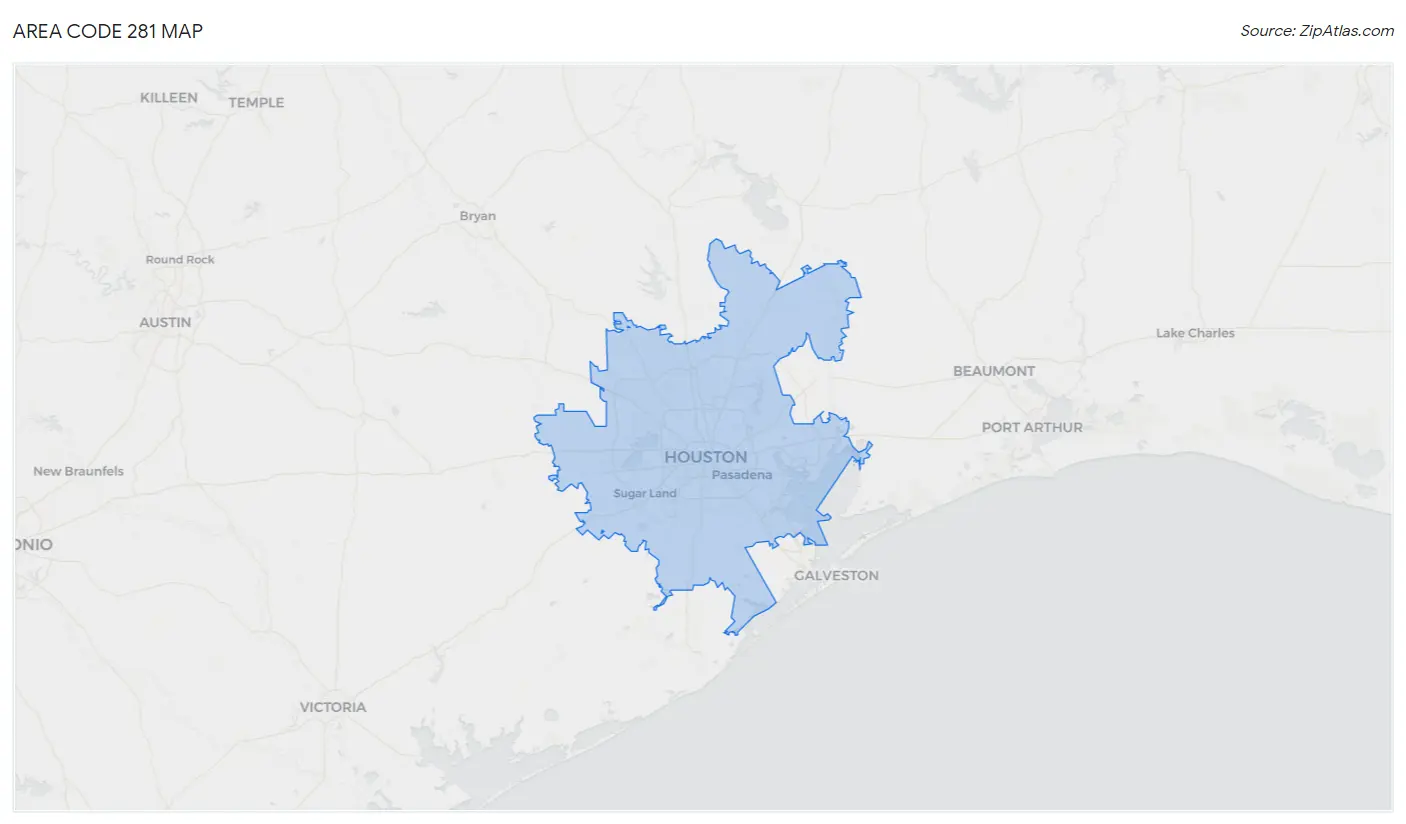
Area Code 281 Map
Area Code 281 Overview
$42,543
PER CAPITA INCOME
$97,886
AVG FAMILY INCOME
$84,892
AVG HOUSEHOLD INCOME
31.4%
WAGE / INCOME GAP [ % ]
68.6¢/ $1
WAGE / INCOME GAP [ $ ]
$11,285
FAMILY INCOME DEFICIT
50.63
INEQUALITY / GINI INDEX
4,574,961
TOTAL POPULATION
2,284,276
MALE POPULATION
2,290,685
FEMALE POPULATION
99.72
MALES / 100 FEMALES
100.28
FEMALES / 100 MALES
35.8
MEDIAN AGE
3.3
AVG FAMILY SIZE
2.8
AVG HOUSEHOLD SIZE
2,317,166
LABOR FORCE [ PEOPLE ]
66.4%
PERCENT IN LABOR FORCE
6.0%
UNEMPLOYMENT RATE
Income in Area Code 281
Income Overview in Area Code 281
Per Capita Income in Area Code 281 is $42,543, while median incomes of families and households are $97,886 and $84,892 respectively.
| Characteristic | Number | Measure |
| Per Capita Income | 4,574,961 | $42,543 |
| Median Family Income | 1,138,102 | $97,886 |
| Mean Family Income | 1,138,102 | $14,794,243 |
| Median Household Income | 1,600,107 | $84,892 |
| Mean Household Income | 1,600,107 | $12,929,154 |
| Income Deficit | 1,138,102 | $11,285 |
| Wage / Income Gap (%) | 4,574,961 | 31.44% |
| Wage / Income Gap ($) | 4,574,961 | 68.56¢ per $1 |
| Gini / Inequality Index | 4,574,961 | 50.63 |
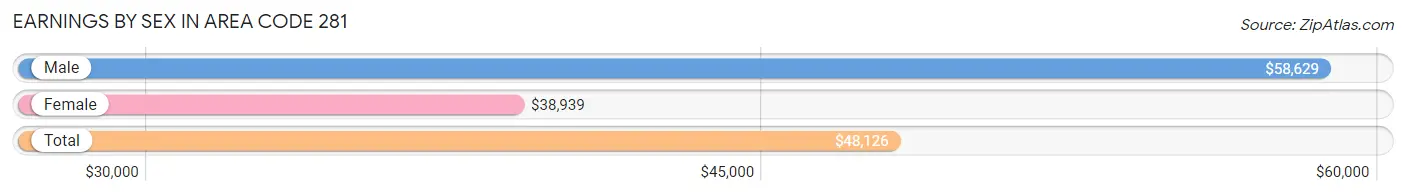
Earnings by Sex in Area Code 281
Average Earnings in Area Code 281 are $48,126, $58,629 for men and $38,939 for women, a difference of 33.6%.
| Sex | Number | Average Earnings |
| Male | 1,317,415 (54.9%) | $58,629 |
| Female | 1,083,538 (45.1%) | $38,939 |
| Total | 2,400,953 (100.0%) | $48,126 |
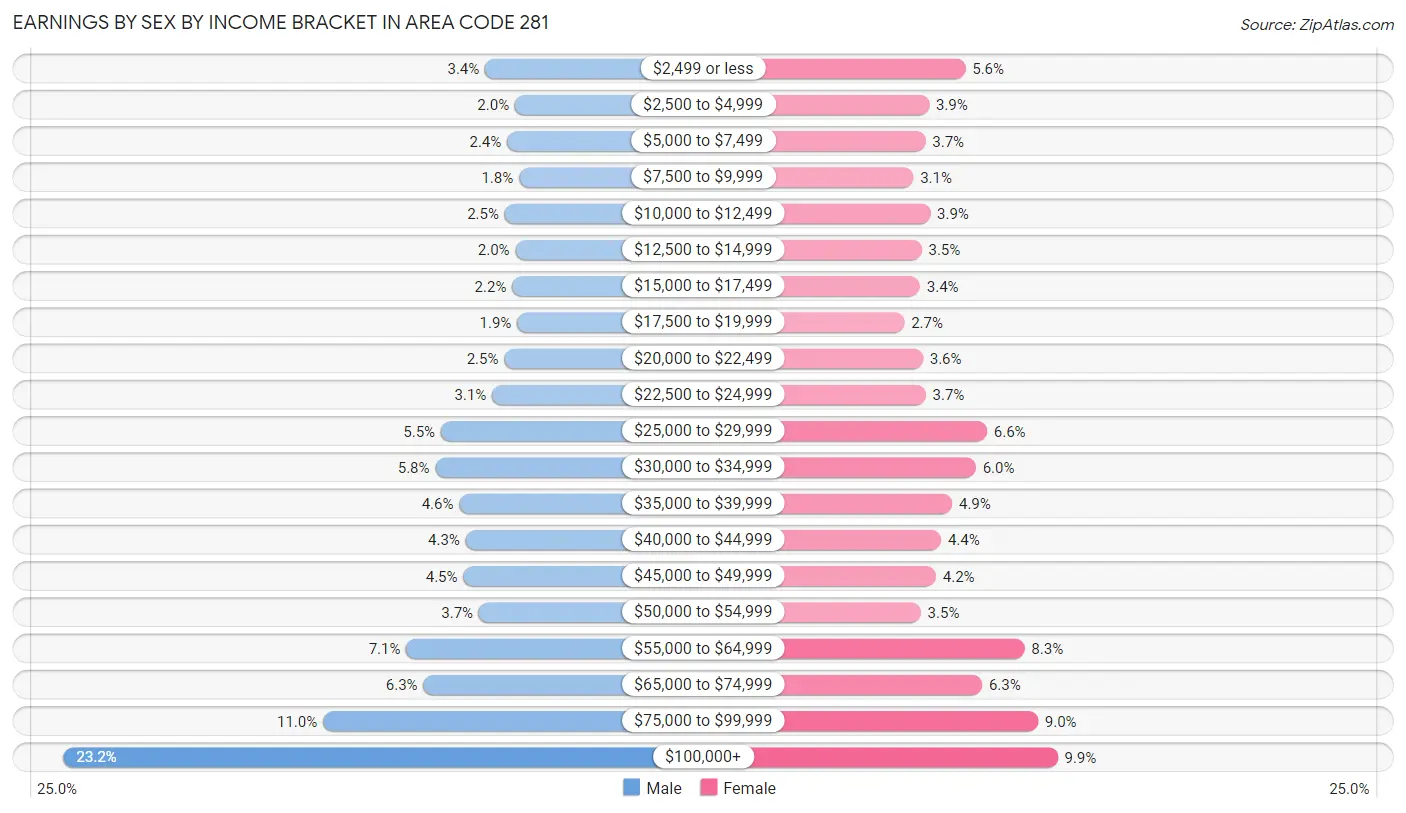
Earnings by Sex by Income Bracket in Area Code 281
The most common earnings brackets in Area Code 281 are $100,000+ for men (305,410 | 23.2%) and $100,000+ for women (106,971 | 9.9%).
| Income | Male | Female |
| $2,499 or less | 45,210 (3.4%) | 60,106 (5.6%) |
| $2,500 to $4,999 | 26,727 (2.0%) | 41,686 (3.8%) |
| $5,000 to $7,499 | 31,581 (2.4%) | 39,902 (3.7%) |
| $7,500 to $9,999 | 24,287 (1.8%) | 33,723 (3.1%) |
| $10,000 to $12,499 | 33,054 (2.5%) | 42,298 (3.9%) |
| $12,500 to $14,999 | 26,484 (2.0%) | 37,889 (3.5%) |
| $15,000 to $17,499 | 28,431 (2.2%) | 37,105 (3.4%) |
| $17,500 to $19,999 | 25,478 (1.9%) | 29,130 (2.7%) |
| $20,000 to $22,499 | 33,304 (2.5%) | 38,546 (3.6%) |
| $22,500 to $24,999 | 40,800 (3.1%) | 40,026 (3.7%) |
| $25,000 to $29,999 | 72,509 (5.5%) | 71,081 (6.6%) |
| $30,000 to $34,999 | 75,858 (5.8%) | 65,399 (6.0%) |
| $35,000 to $39,999 | 61,157 (4.6%) | 53,457 (4.9%) |
| $40,000 to $44,999 | 57,144 (4.3%) | 47,778 (4.4%) |
| $45,000 to $49,999 | 58,604 (4.4%) | 45,194 (4.2%) |
| $50,000 to $54,999 | 49,016 (3.7%) | 37,486 (3.5%) |
| $55,000 to $64,999 | 93,862 (7.1%) | 90,173 (8.3%) |
| $65,000 to $74,999 | 83,319 (6.3%) | 68,637 (6.3%) |
| $75,000 to $99,999 | 145,180 (11.0%) | 96,951 (8.9%) |
| $100,000+ | 305,410 (23.2%) | 106,971 (9.9%) |
| Total | 1,317,415 (100.0%) | 1,083,538 (100.0%) |
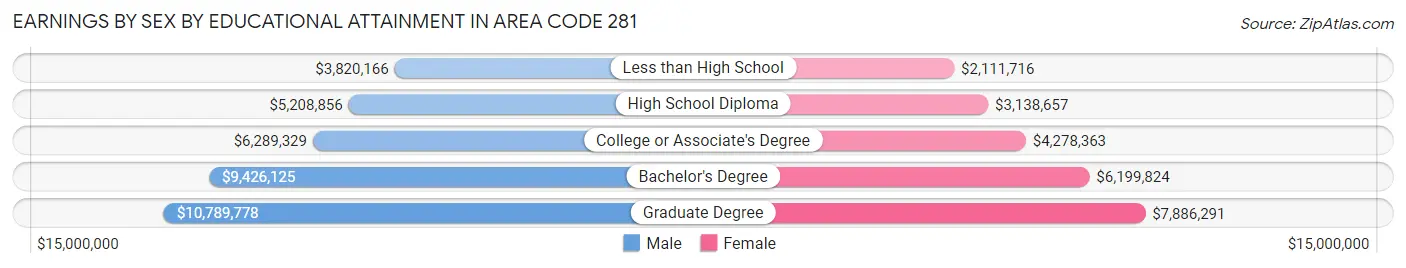
Earnings by Sex by Educational Attainment in Area Code 281
Average earnings in Area Code 281 are $7,471,385 for men and $5,062,199 for women, a difference of 32.3%. Men with an educational attainment of graduate degree enjoy the highest average annual earnings of $10,789,778, while those with less than high school education earn the least with $3,820,166. Women with an educational attainment of graduate degree earn the most with the average annual earnings of $7,886,291, while those with less than high school education have the smallest earnings of $2,111,716.
| Educational Attainment | Male Income | Female Income |
| Less than High School | $3,820,166 | $2,111,716 |
| High School Diploma | $5,208,856 | $3,138,657 |
| College or Associate's Degree | $6,289,329 | $4,278,363 |
| Bachelor's Degree | $9,426,125 | $6,199,824 |
| Graduate Degree | $10,789,778 | $7,886,291 |
| Total | $7,471,385 | $5,062,199 |
Family Income in Area Code 281
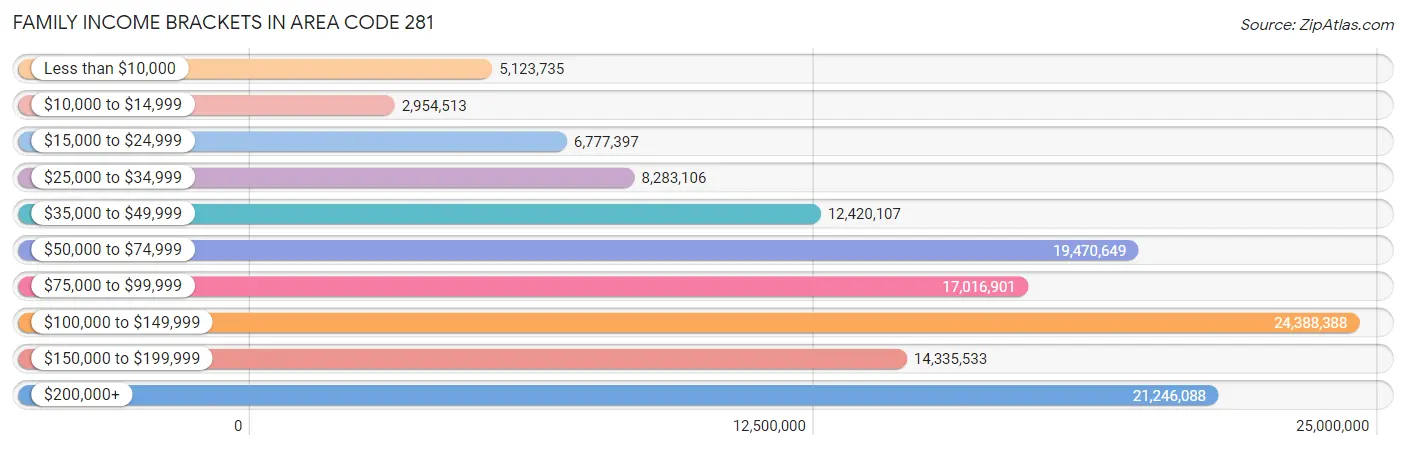
Family Income Brackets in Area Code 281
According to the Area Code 281 family income data, there are 24,388,388 families falling into the $100,000 to $149,999 income range, which is the most common income bracket and makes up 2,142.9% of all families. Conversely, the $10,000 to $14,999 income bracket is the least frequent group with only 2,954,513 families (259.6%) belonging to this category.
| Income Bracket | # Families | % Families |
| Less than $10,000 | 5,123,735 | 450.2% |
| $10,000 to $14,999 | 2,954,513 | 259.6% |
| $15,000 to $24,999 | 6,777,397 | 595.5% |
| $25,000 to $34,999 | 8,283,106 | 727.8% |
| $35,000 to $49,999 | 12,420,107 | 1,091.3% |
| $50,000 to $74,999 | 19,470,649 | 1,710.8% |
| $75,000 to $99,999 | 17,016,901 | 1,495.2% |
| $100,000 to $149,999 | 24,388,388 | 2,142.9% |
| $150,000 to $199,999 | 14,335,533 | 1,259.6% |
| $200,000+ | 21,246,088 | 1,866.8% |
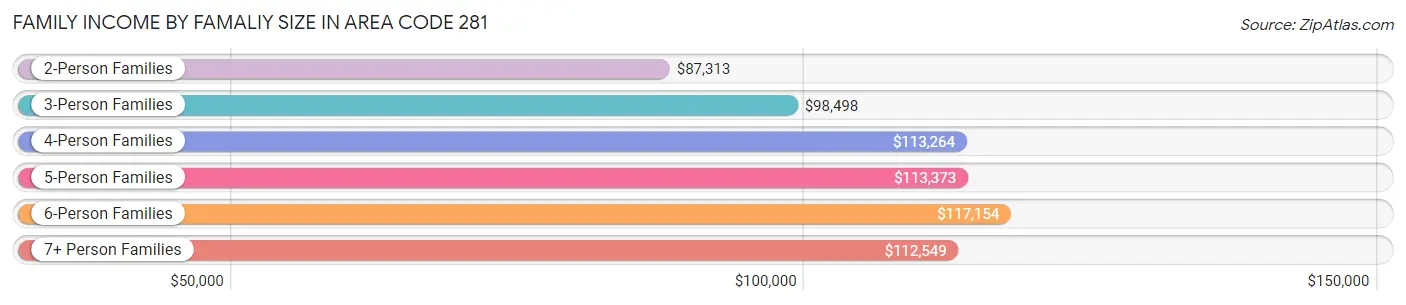
Family Income by Famaliy Size in Area Code 281
6-person families (44,947 | 4.0%) account for the highest median family income in Area Code 281 with $117,154 per family, while 2-person families (427,552 | 37.6%) have the highest median income of $43,656 per family member.
| Income Bracket | # Families | Median Income |
| 2-Person Families | 427,552 (37.6%) | $87,313 |
| 3-Person Families | 270,266 (23.7%) | $98,498 |
| 4-Person Families | 247,054 (21.7%) | $113,264 |
| 5-Person Families | 123,418 (10.8%) | $113,373 |
| 6-Person Families | 44,947 (4.0%) | $117,154 |
| 7+ Person Families | 24,865 (2.2%) | $112,549 |
| Total | 1,138,102 (100.0%) | $97,886 |
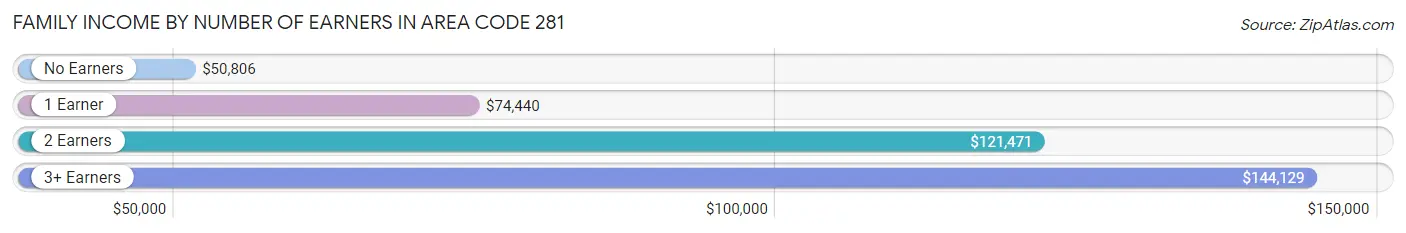
Family Income by Number of Earners in Area Code 281
The median family income in Area Code 281 is $97,886, with families comprising 3+ earners (148,837) having the highest median family income of $144,129, while families with no earners (113,057) have the lowest median family income of $50,806, accounting for 13.1% and 9.9% of families, respectively.
| Number of Earners | # Families | Median Income |
| No Earners | 113,057 (9.9%) | $50,806 |
| 1 Earner | 393,534 (34.6%) | $74,440 |
| 2 Earners | 482,674 (42.4%) | $121,471 |
| 3+ Earners | 148,837 (13.1%) | $144,129 |
| Total | 1,138,102 (100.0%) | $97,886 |
Household Income in Area Code 281
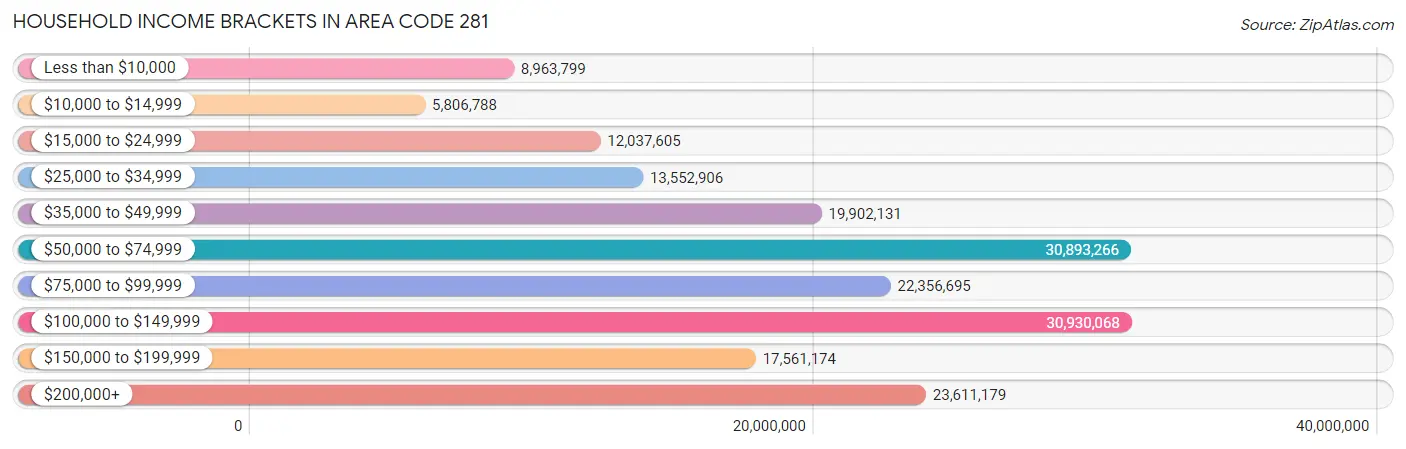
Household Income Brackets in Area Code 281
With 30,930,068 households falling in the category, the $100,000 to $149,999 income range is the most frequent in Area Code 281, accounting for 1,933.0% of all households. In contrast, only 5,806,788 households (362.9%) fall into the $10,000 to $14,999 income bracket, making it the least populous group.
| Income Bracket | # Households | % Households |
| Less than $10,000 | 8,963,799 | 560.2% |
| $10,000 to $14,999 | 5,806,788 | 362.9% |
| $15,000 to $24,999 | 12,037,605 | 752.3% |
| $25,000 to $34,999 | 13,552,906 | 847.0% |
| $35,000 to $49,999 | 19,902,131 | 1,243.8% |
| $50,000 to $74,999 | 30,893,266 | 1,930.7% |
| $75,000 to $99,999 | 22,356,695 | 1,397.2% |
| $100,000 to $149,999 | 30,930,068 | 1,933.0% |
| $150,000 to $199,999 | 17,561,174 | 1,097.5% |
| $200,000+ | 23,611,179 | 1,475.6% |
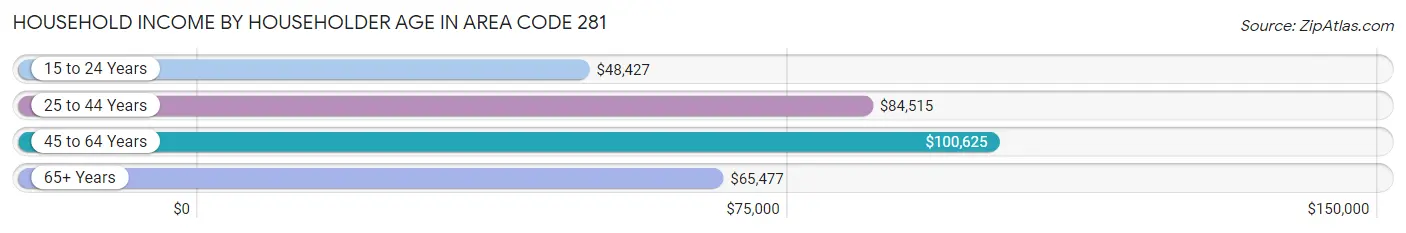
Household Income by Householder Age in Area Code 281
The median household income in Area Code 281 is $84,892, with the highest median household income of $100,625 found in the 45 to 64 years age bracket for the primary householder. A total of 602,585 households (37.7%) fall into this category. Meanwhile, the 15 to 24 years age bracket for the primary householder has the lowest median household income of $48,427, with 62,071 households (3.9%) in this group.
| Income Bracket | # Households | Median Income |
| 15 to 24 Years | 62,071 (3.9%) | $48,427 |
| 25 to 44 Years | 638,859 (39.9%) | $84,515 |
| 45 to 64 Years | 602,585 (37.7%) | $100,625 |
| 65+ Years | 296,592 (18.5%) | $65,477 |
| Total | 1,600,107 (100.0%) | $84,892 |
Poverty in Area Code 281
Income Below Poverty by Sex and Age in Area Code 281
With 11.2% poverty level for males and 14.0% for females among the residents of Area Code 281, 5 year old males and under 5 year old females are the most vulnerable to poverty, with 7,567 males (20.8%) and 30,848 females (20.4%) in their respective age groups living below the poverty level.
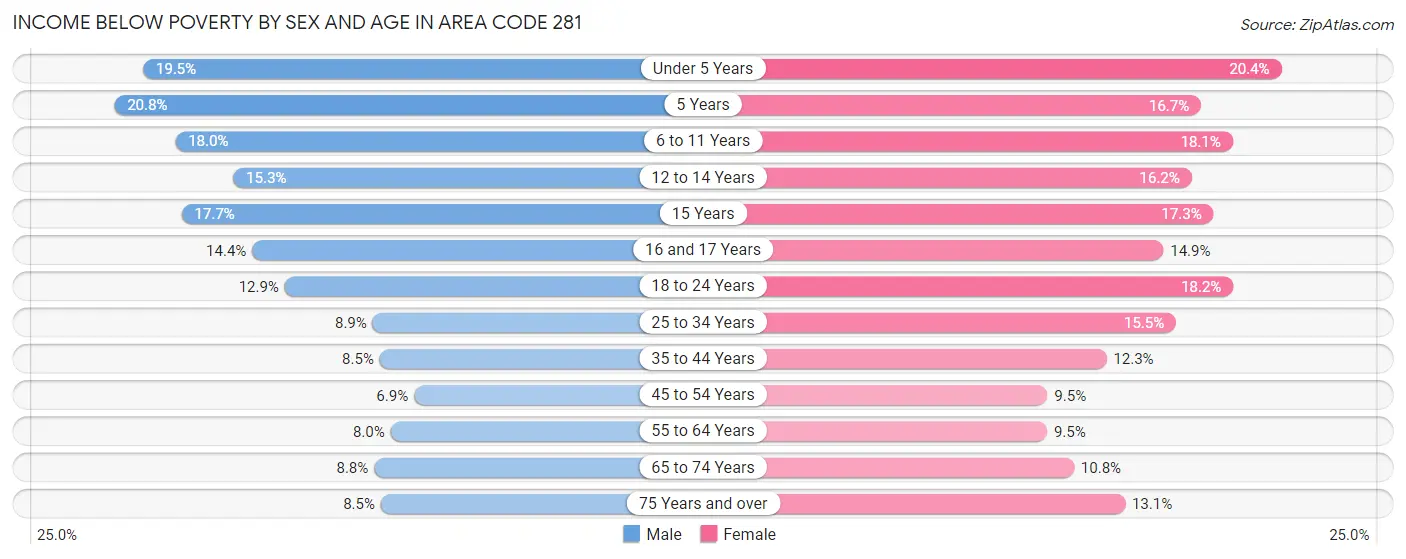
| Age Bracket | Male | Female |
| Under 5 Years | 30,139 (19.5%) | 30,848 (20.4%) |
| 5 Years | 7,567 (20.8%) | 5,135 (16.7%) |
| 6 to 11 Years | 38,258 (18.0%) | 37,205 (18.1%) |
| 12 to 14 Years | 16,675 (15.3%) | 16,597 (16.2%) |
| 15 Years | 6,299 (17.7%) | 5,940 (17.2%) |
| 16 and 17 Years | 10,271 (14.4%) | 10,406 (14.9%) |
| 18 to 24 Years | 27,085 (12.9%) | 36,175 (18.2%) |
| 25 to 34 Years | 28,787 (8.8%) | 49,988 (15.5%) |
| 35 to 44 Years | 28,676 (8.5%) | 41,411 (12.3%) |
| 45 to 54 Years | 20,537 (6.9%) | 27,946 (9.5%) |
| 55 to 64 Years | 19,342 (8.0%) | 23,852 (9.5%) |
| 65 to 74 Years | 13,289 (8.8%) | 18,464 (10.8%) |
| 75 Years and over | 6,381 (8.5%) | 14,051 (13.1%) |
| Total | 253,306 (11.2%) | 318,018 (14.0%) |
Income Above Poverty by Sex and Age in Area Code 281
According to the poverty statistics in Area Code 281, males aged 45 to 54 years and females aged 55 to 64 years are the age groups that are most secure financially, with 93.1% of males and 90.5% of females in these age groups living above the poverty line.
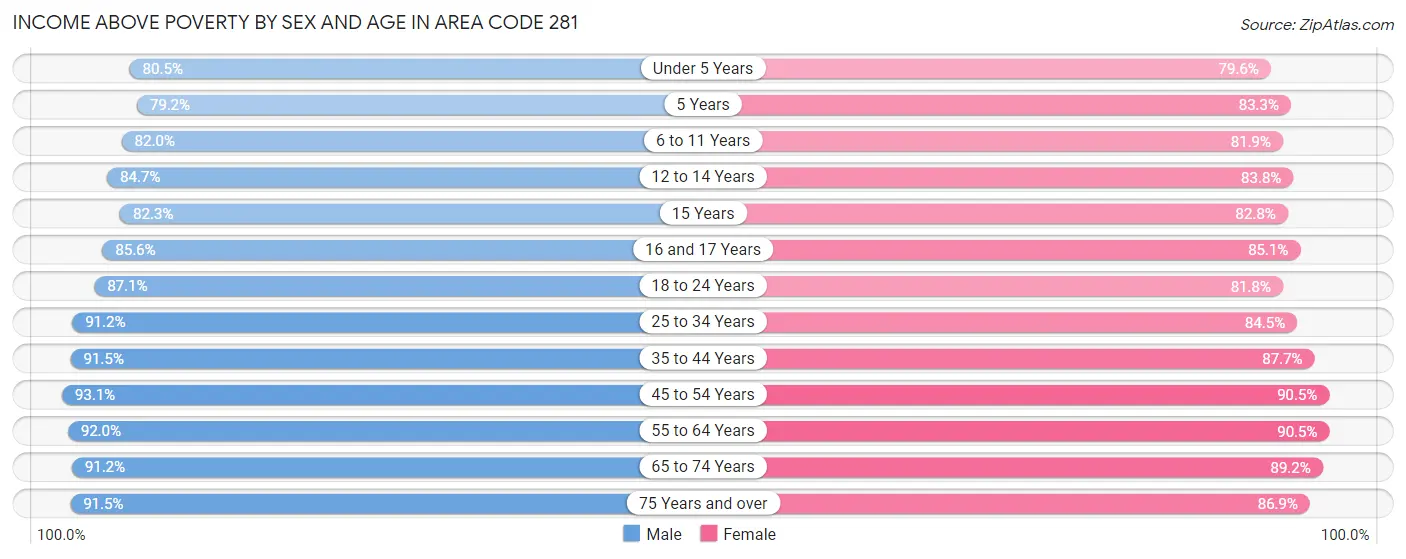
| Age Bracket | Male | Female |
| Under 5 Years | 124,345 (80.5%) | 120,348 (79.6%) |
| 5 Years | 28,751 (79.2%) | 25,667 (83.3%) |
| 6 to 11 Years | 174,124 (82.0%) | 167,930 (81.9%) |
| 12 to 14 Years | 92,205 (84.7%) | 85,651 (83.8%) |
| 15 Years | 29,256 (82.3%) | 28,488 (82.8%) |
| 16 and 17 Years | 60,875 (85.6%) | 59,356 (85.1%) |
| 18 to 24 Years | 182,401 (87.1%) | 162,986 (81.8%) |
| 25 to 34 Years | 296,393 (91.1%) | 272,383 (84.5%) |
| 35 to 44 Years | 307,988 (91.5%) | 295,747 (87.7%) |
| 45 to 54 Years | 275,954 (93.1%) | 264,956 (90.5%) |
| 55 to 64 Years | 221,861 (92.0%) | 226,681 (90.5%) |
| 65 to 74 Years | 138,014 (91.2%) | 152,908 (89.2%) |
| 75 Years and over | 68,987 (91.5%) | 92,851 (86.9%) |
| Total | 2,001,154 (88.8%) | 1,955,952 (86.0%) |
Income Below Poverty Among Married-Couple Families in Area Code 281
The poverty statistics for married-couple families in Area Code 281 show that 5.7% or 46,902 of the total 826,831 families live below the poverty line. Families with 5 or more children have the highest poverty rate of 29.0%, comprising of 1,781 families. On the other hand, families with no children have the lowest poverty rate of 4.2%, which includes 16,987 families.
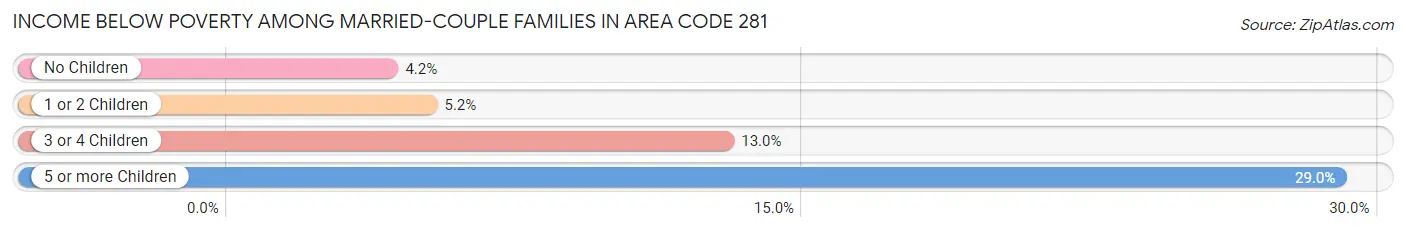
| Children | Above Poverty | Below Poverty |
| No Children | 388,340 (95.8%) | 16,987 (4.2%) |
| 1 or 2 Children | 314,289 (94.8%) | 17,277 (5.2%) |
| 3 or 4 Children | 72,931 (87.0%) | 10,857 (13.0%) |
| 5 or more Children | 4,369 (71.0%) | 1,781 (29.0%) |
| Total | 779,929 (94.3%) | 46,902 (5.7%) |
Income Below Poverty Among Single-Parent Households in Area Code 281
According to the poverty data in Area Code 281, 11.7% or 10,779 single-father households and 25.8% or 56,507 single-mother households are living below the poverty line. Among single-father households, those with 5 or more children have the highest poverty rate, with 506 households (57.6%) experiencing poverty. Likewise, among single-mother households, those with 5 or more children have the highest poverty rate, with 2,325 households (79.7%) falling below the poverty line.
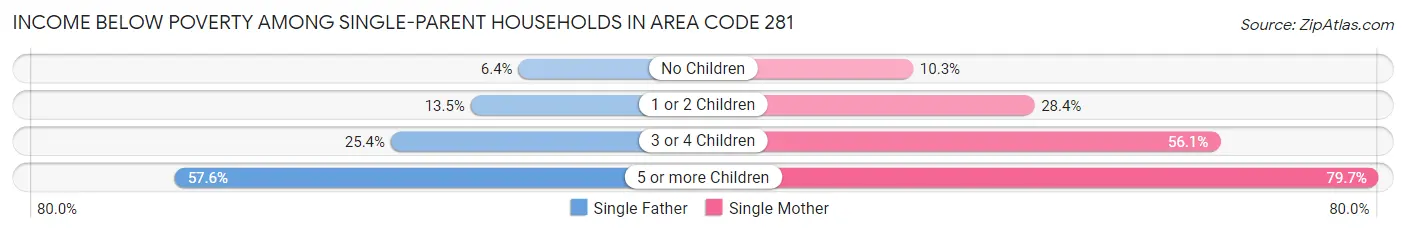
| Children | Single Father | Single Mother |
| No Children | 2,658 (6.4%) | 7,968 (10.3%) |
| 1 or 2 Children | 5,674 (13.5%) | 32,633 (28.4%) |
| 3 or 4 Children | 1,941 (25.4%) | 13,581 (56.1%) |
| 5 or more Children | 506 (57.6%) | 2,325 (79.7%) |
| Total | 10,779 (11.7%) | 56,507 (25.8%) |
Income Below Poverty Among Married-Couple vs Single-Parent Households in Area Code 281
The poverty data for Area Code 281 shows that 46,902 of the married-couple family households (5.7%) and 67,286 of the single-parent households (21.6%) are living below the poverty level. Within the married-couple family households, those with 5 or more children have the highest poverty rate, with 1,781 households (29.0%) falling below the poverty line. Among the single-parent households, those with 5 or more children have the highest poverty rate, with 2,831 household (74.6%) living below poverty.
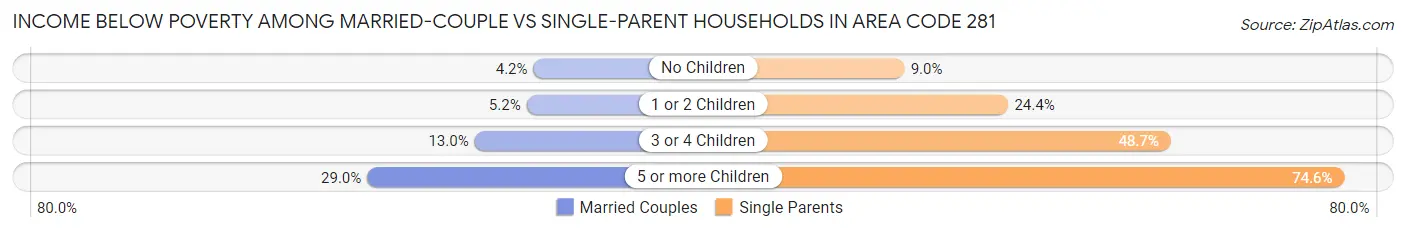
| Children | Married-Couple Families | Single-Parent Households |
| No Children | 16,987 (4.2%) | 10,626 (8.9%) |
| 1 or 2 Children | 17,277 (5.2%) | 38,307 (24.4%) |
| 3 or 4 Children | 10,857 (13.0%) | 15,522 (48.7%) |
| 5 or more Children | 1,781 (29.0%) | 2,831 (74.6%) |
| Total | 46,902 (5.7%) | 67,286 (21.6%) |
Race in Area Code 281
The most populous races in Area Code 281 are White / Caucasian (2,257,223 | 49.3%), Hispanic or Latino (1,703,400 | 37.2%), and Black / African American (798,588 | 17.5%).
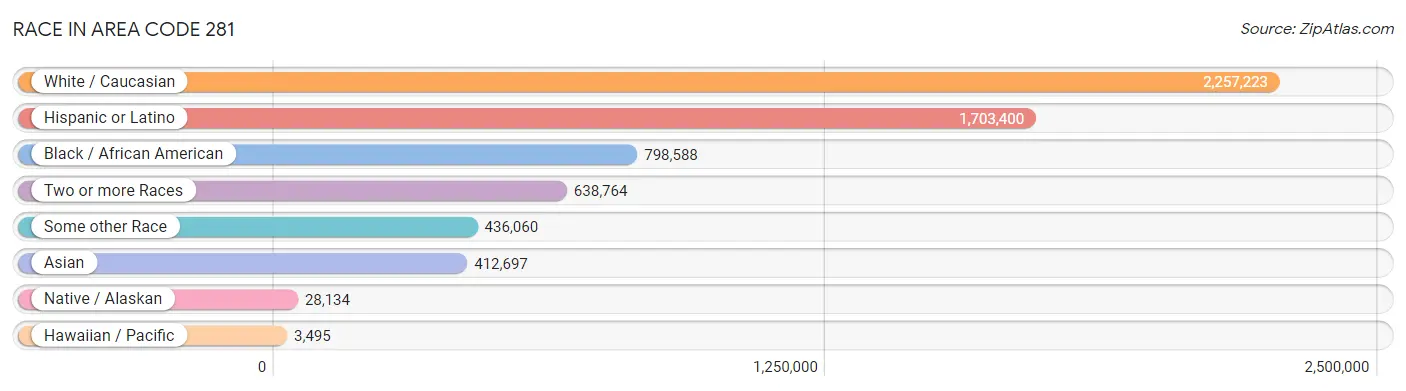
| Race | # Population | % Population |
| Asian | 412,697 | 9.0% |
| Black / African American | 798,588 | 17.5% |
| Hawaiian / Pacific | 3,495 | 0.1% |
| Hispanic or Latino | 1,703,400 | 37.2% |
| Native / Alaskan | 28,134 | 0.6% |
| White / Caucasian | 2,257,223 | 49.3% |
| Two or more Races | 638,764 | 14.0% |
| Some other Race | 436,060 | 9.5% |
| Total | 4,574,961 | 100.0% |
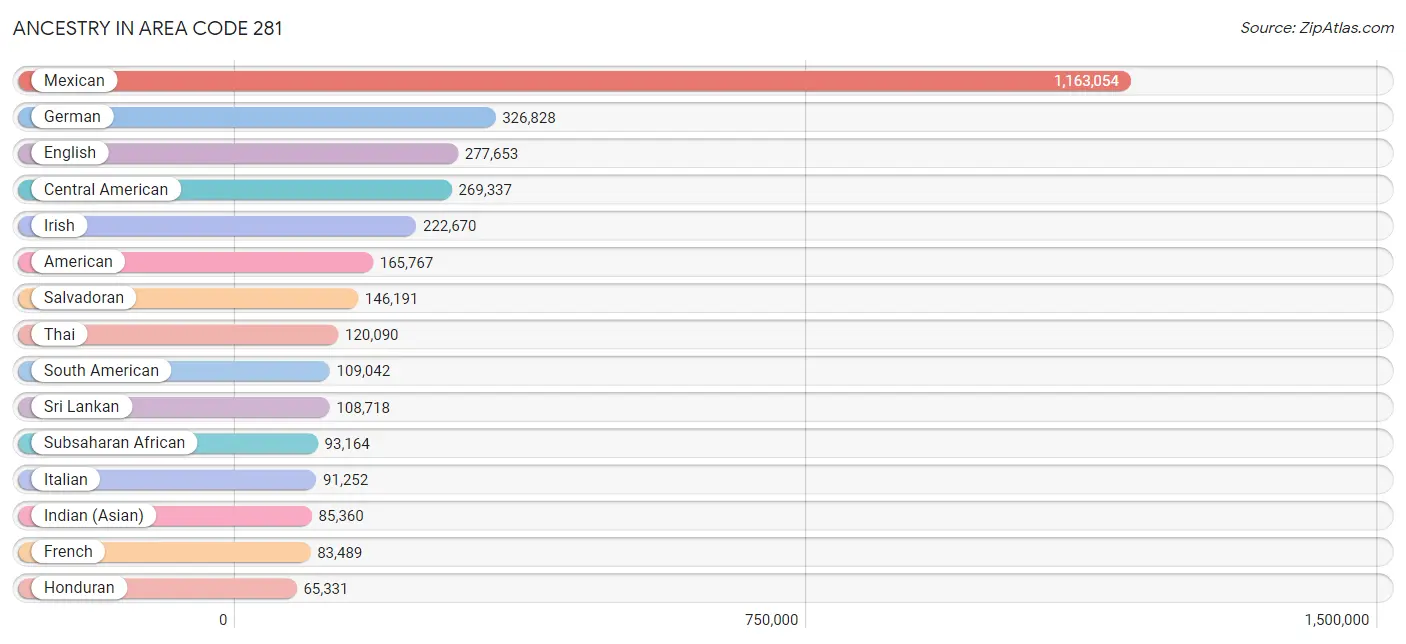
Ancestry in Area Code 281
The most populous ancestries reported in Area Code 281 are Mexican (1,163,054 | 25.4%), German (326,828 | 7.1%), English (277,653 | 6.1%), Central American (269,337 | 5.9%), and Irish (222,670 | 4.9%), together accounting for 49.4% of all Area Code 281 residents.
| Ancestry | # Population | % Population |
| Afghan | 1,986 | 0.0% |
| African | 35,432 | 0.8% |
| Alaska Native | 153 | 0.0% |
| Alaskan Athabascan | 86 | 0.0% |
| Albanian | 678 | 0.0% |
| Aleut | 61 | 0.0% |
| Alsatian | 122 | 0.0% |
| American | 165,767 | 3.6% |
| Apache | 1,079 | 0.0% |
| Arab | 41,701 | 0.9% |
| Argentinean | 6,442 | 0.1% |
| Armenian | 1,627 | 0.0% |
| Assyrian / Chaldean / Syriac | 60 | 0.0% |
| Australian | 812 | 0.0% |
| Austrian | 4,637 | 0.1% |
| Bahamian | 1,607 | 0.0% |
| Bangladeshi | 304 | 0.0% |
| Barbadian | 491 | 0.0% |
| Basque | 430 | 0.0% |
| Belgian | 2,394 | 0.1% |
| Belizean | 1,734 | 0.0% |
| Bermudan | 10 | 0.0% |
| Bhutanese | 11,373 | 0.3% |
| Blackfeet | 1,056 | 0.0% |
| Bolivian | 1,396 | 0.0% |
| Brazilian | 5,751 | 0.1% |
| British | 23,169 | 0.5% |
| British West Indian | 1,947 | 0.0% |
| Bulgarian | 524 | 0.0% |
| Burmese | 19,278 | 0.4% |
| Cajun | 2,999 | 0.1% |
| Cambodian | 62 | 0.0% |
| Canadian | 6,980 | 0.2% |
| Cape Verdean | 60 | 0.0% |
| Celtic | 918 | 0.0% |
| Central American | 269,337 | 5.9% |
| Central American Indian | 6,757 | 0.2% |
| Cherokee | 9,151 | 0.2% |
| Cheyenne | 246 | 0.0% |
| Chickasaw | 439 | 0.0% |
| Chilean | 3,711 | 0.1% |
| Chinese | 30 | 0.0% |
| Chippewa | 456 | 0.0% |
| Choctaw | 3,125 | 0.1% |
| Colombian | 39,181 | 0.9% |
| Comanche | 630 | 0.0% |
| Costa Rican | 2,621 | 0.1% |
| Cree | 28 | 0.0% |
| Creek | 718 | 0.0% |
| Croatian | 2,937 | 0.1% |
| Crow | 90 | 0.0% |
| Cuban | 36,142 | 0.8% |
| Cypriot | 43 | 0.0% |
| Czech | 24,382 | 0.5% |
| Czechoslovakian | 3,076 | 0.1% |
| Danish | 6,868 | 0.2% |
| Delaware | 187 | 0.0% |
| Dominican | 8,477 | 0.2% |
| Dutch | 23,061 | 0.5% |
| Dutch West Indian | 459 | 0.0% |
| Eastern European | 4,752 | 0.1% |
| Ecuadorian | 5,935 | 0.1% |
| Egyptian | 6,261 | 0.1% |
| English | 277,653 | 6.1% |
| Estonian | 105 | 0.0% |
| Ethiopian | 2,774 | 0.1% |
| European | 59,155 | 1.3% |
| Fijian | 35 | 0.0% |
| Filipino | 6,076 | 0.1% |
| Finnish | 2,397 | 0.1% |
| French | 83,489 | 1.8% |
| French American Indian | 427 | 0.0% |
| French Canadian | 11,664 | 0.3% |
| German | 326,828 | 7.1% |
| German Russian | 425 | 0.0% |
| Ghanaian | 2,599 | 0.1% |
| Greek | 9,866 | 0.2% |
| Guamanian / Chamorro | 2,635 | 0.1% |
| Guatemalan | 41,835 | 0.9% |
| Guyanese | 625 | 0.0% |
| Haitian | 3,163 | 0.1% |
| Hmong | 28 | 0.0% |
| Honduran | 65,331 | 1.4% |
| Hopi | 61 | 0.0% |
| Houma | 115 | 0.0% |
| Hungarian | 5,191 | 0.1% |
| Icelander | 487 | 0.0% |
| Indian (Asian) | 85,360 | 1.9% |
| Indonesian | 1,663 | 0.0% |
| Inupiat | 45 | 0.0% |
| Iranian | 10,421 | 0.2% |
| Iraqi | 5,008 | 0.1% |
| Irish | 222,670 | 4.9% |
| Iroquois | 250 | 0.0% |
| Israeli | 1,493 | 0.0% |
| Italian | 91,252 | 2.0% |
| Jamaican | 11,433 | 0.3% |
| Japanese | 7,072 | 0.2% |
| Jordanian | 2,520 | 0.1% |
| Kenyan | 1,881 | 0.0% |
| Kiowa | 15 | 0.0% |
| Korean | 51,893 | 1.1% |
| Laotian | 3,369 | 0.1% |
| Latvian | 298 | 0.0% |
| Lebanese | 7,276 | 0.2% |
| Liberian | 724 | 0.0% |
| Lithuanian | 2,891 | 0.1% |
| Lumbee | 75 | 0.0% |
| Luxembourger | 161 | 0.0% |
| Macedonian | 742 | 0.0% |
| Malaysian | 3,109 | 0.1% |
| Maltese | 180 | 0.0% |
| Menominee | 14 | 0.0% |
| Mexican | 1,163,054 | 25.4% |
| Mexican American Indian | 13,068 | 0.3% |
| Mongolian | 1,497 | 0.0% |
| Moroccan | 2,050 | 0.0% |
| Native Hawaiian | 3,078 | 0.1% |
| Navajo | 1,196 | 0.0% |
| Nepalese | 13 | 0.0% |
| New Zealander | 127 | 0.0% |
| Nicaraguan | 9,073 | 0.2% |
| Nigerian | 37,132 | 0.8% |
| Northern European | 3,415 | 0.1% |
| Norwegian | 19,957 | 0.4% |
| Okinawan | 392 | 0.0% |
| Osage | 634 | 0.0% |
| Ottawa | 40 | 0.0% |
| Pakistani | 4,376 | 0.1% |
| Palestinian | 3,343 | 0.1% |
| Panamanian | 3,803 | 0.1% |
| Paraguayan | 523 | 0.0% |
| Pennsylvania German | 367 | 0.0% |
| Peruvian | 11,396 | 0.3% |
| Pima | 14 | 0.0% |
| Polish | 47,238 | 1.0% |
| Portuguese | 7,795 | 0.2% |
| Potawatomi | 42 | 0.0% |
| Pueblo | 426 | 0.0% |
| Puerto Rican | 37,649 | 0.8% |
| Puget Sound Salish | 21 | 0.0% |
| Romanian | 4,032 | 0.1% |
| Russian | 13,673 | 0.3% |
| Salvadoran | 146,191 | 3.2% |
| Samoan | 1,243 | 0.0% |
| Scandinavian | 7,739 | 0.2% |
| Scotch-Irish | 29,742 | 0.6% |
| Scottish | 48,421 | 1.1% |
| Seminole | 60 | 0.0% |
| Senegalese | 691 | 0.0% |
| Serbian | 1,929 | 0.0% |
| Shoshone | 163 | 0.0% |
| Sierra Leonean | 1,161 | 0.0% |
| Sioux | 529 | 0.0% |
| Slavic | 1,265 | 0.0% |
| Slovak | 2,059 | 0.1% |
| Slovene | 951 | 0.0% |
| Somali | 138 | 0.0% |
| South African | 2,087 | 0.1% |
| South American | 109,042 | 2.4% |
| South American Indian | 303 | 0.0% |
| Soviet Union | 24 | 0.0% |
| Spaniard | 17,848 | 0.4% |
| Spanish | 10,025 | 0.2% |
| Spanish American | 201 | 0.0% |
| Spanish American Indian | 245 | 0.0% |
| Sri Lankan | 108,718 | 2.4% |
| Subsaharan African | 93,164 | 2.0% |
| Sudanese | 1,093 | 0.0% |
| Swedish | 19,318 | 0.4% |
| Swiss | 4,031 | 0.1% |
| Syrian | 3,257 | 0.1% |
| Thai | 120,090 | 2.6% |
| Tlingit-Haida | 33 | 0.0% |
| Tohono O'Odham | 108 | 0.0% |
| Tongan | 73 | 0.0% |
| Trinidadian and Tobagonian | 3,381 | 0.1% |
| Turkish | 4,464 | 0.1% |
| U.S. Virgin Islander | 526 | 0.0% |
| Ugandan | 383 | 0.0% |
| Ukrainian | 6,111 | 0.1% |
| Uruguayan | 1,620 | 0.0% |
| Ute | 91 | 0.0% |
| Venezuelan | 38,669 | 0.9% |
| Vietnamese | 3,766 | 0.1% |
| Welsh | 14,694 | 0.3% |
| West Indian | 4,081 | 0.1% |
| Yakama | 146 | 0.0% |
| Yaqui | 240 | 0.0% |
| Yugoslavian | 1,986 | 0.0% |
| Yup'ik | 27 | 0.0% |
| Zimbabwean | 142 | 0.0% | View All 192 Rows |
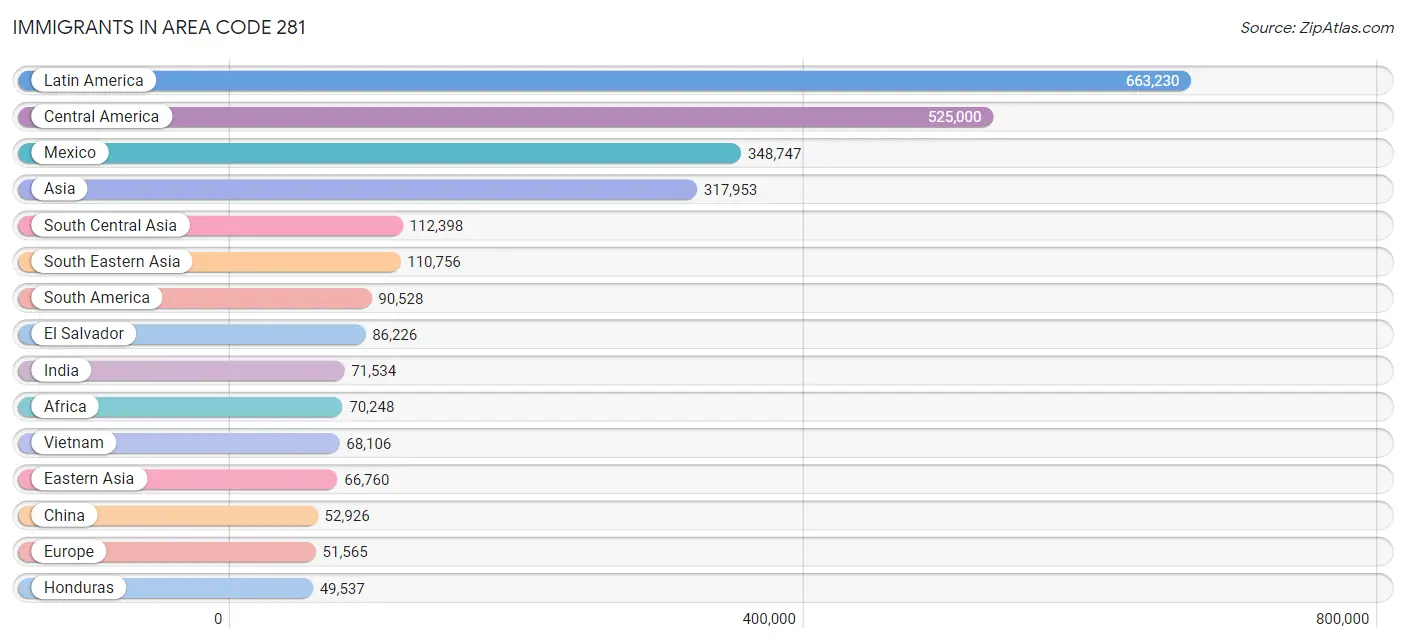
Immigrants in Area Code 281
The most numerous immigrant groups reported in Area Code 281 came from Latin America (663,230 | 14.5%), Central America (525,000 | 11.5%), Mexico (348,747 | 7.6%), Asia (317,953 | 7.0%), and South Central Asia (112,398 | 2.5%), together accounting for 43.0% of all Area Code 281 residents.
| Immigration Origin | # Population | % Population |
| Afghanistan | 1,765 | 0.0% |
| Africa | 70,248 | 1.5% |
| Albania | 381 | 0.0% |
| Argentina | 5,056 | 0.1% |
| Armenia | 324 | 0.0% |
| Asia | 317,953 | 7.0% |
| Australia | 1,559 | 0.0% |
| Austria | 212 | 0.0% |
| Azores | 8 | 0.0% |
| Bahamas | 760 | 0.0% |
| Bangladesh | 3,638 | 0.1% |
| Barbados | 592 | 0.0% |
| Belarus | 287 | 0.0% |
| Belgium | 397 | 0.0% |
| Belize | 1,118 | 0.0% |
| Bolivia | 1,442 | 0.0% |
| Bosnia and Herzegovina | 1,436 | 0.0% |
| Brazil | 6,737 | 0.2% |
| Bulgaria | 386 | 0.0% |
| Cabo Verde | 18 | 0.0% |
| Cambodia | 2,988 | 0.1% |
| Cameroon | 4,270 | 0.1% |
| Canada | 14,152 | 0.3% |
| Caribbean | 47,702 | 1.0% |
| Central America | 525,000 | 11.5% |
| Chile | 2,541 | 0.1% |
| China | 52,926 | 1.2% |
| Colombia | 27,212 | 0.6% |
| Congo | 204 | 0.0% |
| Costa Rica | 1,632 | 0.0% |
| Croatia | 354 | 0.0% |
| Cuba | 24,223 | 0.5% |
| Czechoslovakia | 384 | 0.0% |
| Denmark | 842 | 0.0% |
| Dominica | 1,276 | 0.0% |
| Dominican Republic | 4,207 | 0.1% |
| Eastern Africa | 8,481 | 0.2% |
| Eastern Asia | 66,760 | 1.5% |
| Eastern Europe | 15,765 | 0.3% |
| Ecuador | 4,066 | 0.1% |
| Egypt | 4,475 | 0.1% |
| El Salvador | 86,226 | 1.9% |
| England | 5,105 | 0.1% |
| Eritrea | 661 | 0.0% |
| Ethiopia | 2,184 | 0.1% |
| Europe | 51,565 | 1.1% |
| Fiji | 87 | 0.0% |
| France | 2,675 | 0.1% |
| Germany | 5,375 | 0.1% |
| Ghana | 2,605 | 0.1% |
| Greece | 1,293 | 0.0% |
| Grenada | 194 | 0.0% |
| Guatemala | 30,360 | 0.7% |
| Guyana | 678 | 0.0% |
| Haiti | 1,313 | 0.0% |
| Honduras | 49,537 | 1.1% |
| Hong Kong | 3,211 | 0.1% |
| Hungary | 523 | 0.0% |
| India | 71,534 | 1.6% |
| Indonesia | 2,948 | 0.1% |
| Iran | 8,504 | 0.2% |
| Iraq | 7,391 | 0.2% |
| Ireland | 584 | 0.0% |
| Israel | 588 | 0.0% |
| Italy | 2,325 | 0.1% |
| Jamaica | 7,176 | 0.2% |
| Japan | 4,021 | 0.1% |
| Jordan | 2,391 | 0.1% |
| Kazakhstan | 859 | 0.0% |
| Kenya | 2,667 | 0.1% |
| Korea | 9,728 | 0.2% |
| Kuwait | 915 | 0.0% |
| Laos | 946 | 0.0% |
| Latin America | 663,230 | 14.5% |
| Latvia | 97 | 0.0% |
| Lebanon | 2,992 | 0.1% |
| Liberia | 1,135 | 0.0% |
| Lithuania | 39 | 0.0% |
| Malaysia | 2,478 | 0.1% |
| Mexico | 348,747 | 7.6% |
| Micronesia | 222 | 0.0% |
| Middle Africa | 6,984 | 0.2% |
| Moldova | 146 | 0.0% |
| Morocco | 1,439 | 0.0% |
| Nepal | 2,900 | 0.1% |
| Netherlands | 1,841 | 0.0% |
| Nicaragua | 5,566 | 0.1% |
| Nigeria | 32,197 | 0.7% |
| North Macedonia | 398 | 0.0% |
| Northern Africa | 8,478 | 0.2% |
| Northern Europe | 18,346 | 0.4% |
| Norway | 1,237 | 0.0% |
| Oceania | 2,443 | 0.1% |
| Pakistan | 20,615 | 0.4% |
| Panama | 1,681 | 0.0% |
| Peru | 7,106 | 0.2% |
| Philippines | 27,997 | 0.6% |
| Poland | 1,644 | 0.0% |
| Portugal | 641 | 0.0% |
| Romania | 2,133 | 0.1% |
| Russia | 4,378 | 0.1% |
| Saudi Arabia | 2,247 | 0.1% |
| Scotland | 1,916 | 0.0% |
| Senegal | 1,057 | 0.0% |
| Serbia | 457 | 0.0% |
| Sierra Leone | 1,621 | 0.0% |
| Singapore | 1,102 | 0.0% |
| Somalia | 203 | 0.0% |
| South Africa | 2,939 | 0.1% |
| South America | 90,528 | 2.0% |
| South Central Asia | 112,398 | 2.5% |
| South Eastern Asia | 110,756 | 2.4% |
| Southern Europe | 6,413 | 0.1% |
| Spain | 2,133 | 0.1% |
| Sri Lanka | 1,588 | 0.0% |
| St. Vincent and the Grenadines | 128 | 0.0% |
| Sudan | 959 | 0.0% |
| Sweden | 845 | 0.0% |
| Switzerland | 471 | 0.0% |
| Syria | 2,351 | 0.1% |
| Taiwan | 9,222 | 0.2% |
| Thailand | 2,896 | 0.1% |
| Trinidad and Tobago | 4,629 | 0.1% |
| Turkey | 3,351 | 0.1% |
| Uganda | 863 | 0.0% |
| Ukraine | 1,888 | 0.0% |
| Uruguay | 1,240 | 0.0% |
| Uzbekistan | 380 | 0.0% |
| Venezuela | 33,767 | 0.7% |
| Vietnam | 68,106 | 1.5% |
| West Indies | 569 | 0.0% |
| Western Africa | 41,694 | 0.9% |
| Western Asia | 26,806 | 0.6% |
| Western Europe | 10,998 | 0.2% |
| Yemen | 277 | 0.0% |
| Zaire | 663 | 0.0% |
| Zimbabwe | 427 | 0.0% | View All 137 Rows |
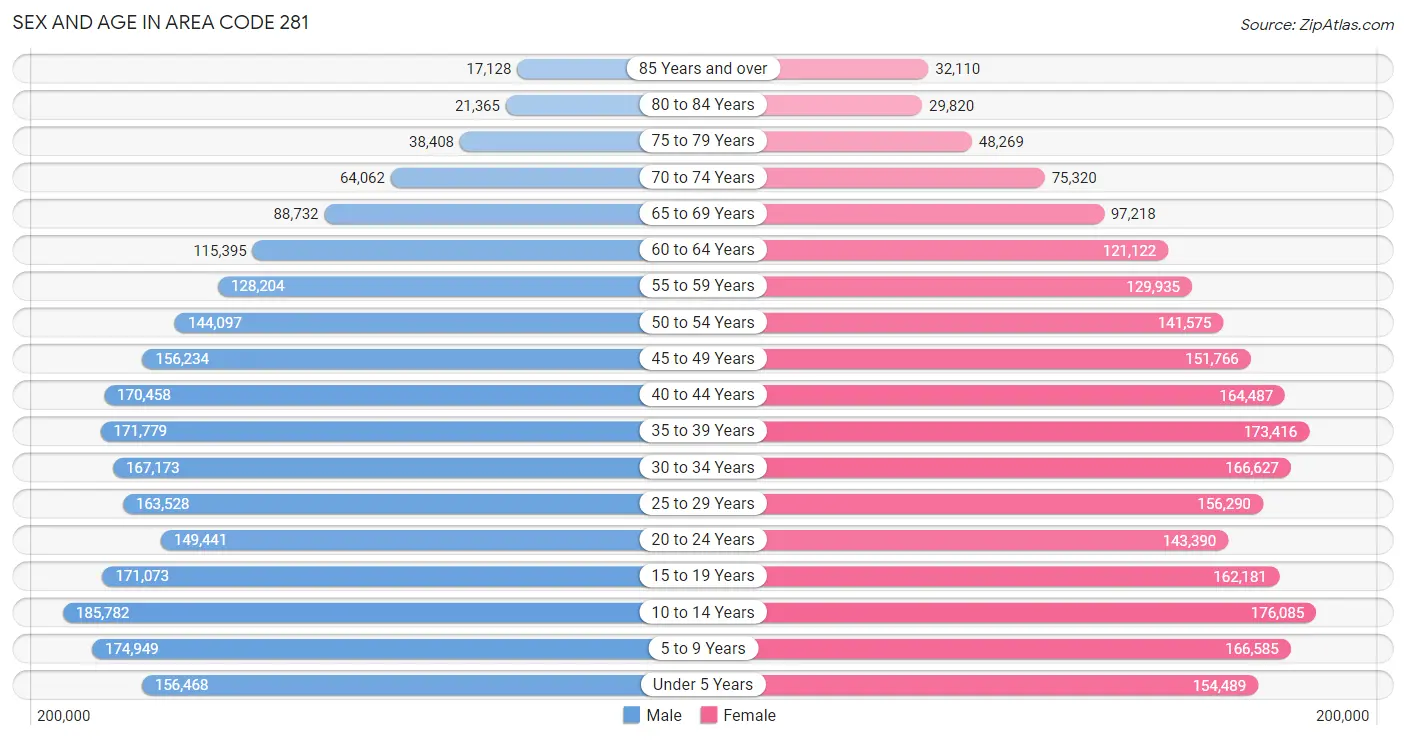
Sex and Age in Area Code 281
Sex and Age in Area Code 281
The most populous age groups in Area Code 281 are 10 to 14 Years (185,782 | 8.1%) for men and 10 to 14 Years (176,085 | 7.7%) for women.
| Age Bracket | Male | Female |
| Under 5 Years | 156,468 (6.9%) | 154,489 (6.7%) |
| 5 to 9 Years | 174,949 (7.7%) | 166,585 (7.3%) |
| 10 to 14 Years | 185,782 (8.1%) | 176,085 (7.7%) |
| 15 to 19 Years | 171,073 (7.5%) | 162,181 (7.1%) |
| 20 to 24 Years | 149,441 (6.5%) | 143,390 (6.3%) |
| 25 to 29 Years | 163,528 (7.2%) | 156,290 (6.8%) |
| 30 to 34 Years | 167,173 (7.3%) | 166,627 (7.3%) |
| 35 to 39 Years | 171,779 (7.5%) | 173,416 (7.6%) |
| 40 to 44 Years | 170,458 (7.5%) | 164,487 (7.2%) |
| 45 to 49 Years | 156,234 (6.8%) | 151,766 (6.6%) |
| 50 to 54 Years | 144,097 (6.3%) | 141,575 (6.2%) |
| 55 to 59 Years | 128,204 (5.6%) | 129,935 (5.7%) |
| 60 to 64 Years | 115,395 (5.1%) | 121,122 (5.3%) |
| 65 to 69 Years | 88,732 (3.9%) | 97,218 (4.2%) |
| 70 to 74 Years | 64,062 (2.8%) | 75,320 (3.3%) |
| 75 to 79 Years | 38,408 (1.7%) | 48,269 (2.1%) |
| 80 to 84 Years | 21,365 (0.9%) | 29,820 (1.3%) |
| 85 Years and over | 17,128 (0.7%) | 32,110 (1.4%) |
| Total | 2,284,276 (100.0%) | 2,290,685 (100.0%) |
Families and Households in Area Code 281
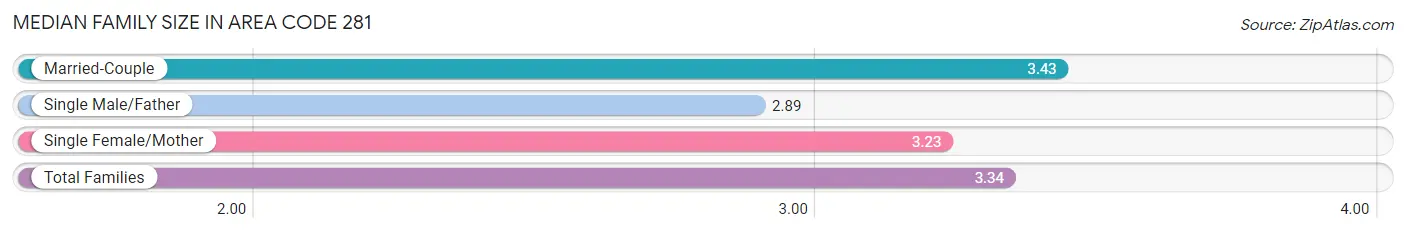
Median Family Size in Area Code 281
The median family size in Area Code 281 is 3.34 persons per family, with married-couple families (826,831 | 72.7%) accounting for the largest median family size of 3.43189 persons per family. On the other hand, single male/father families (91,946 | 8.1%) represent the smallest median family size with 2.89 persons per family.
| Family Type | # Families | Family Size |
| Married-Couple | 826,831 (72.7%) | 3.43 |
| Single Male/Father | 91,946 (8.1%) | 2.89 |
| Single Female/Mother | 219,325 (19.3%) | 3.23 |
| Total Families | 1,138,102 (100.0%) | 3.34 |
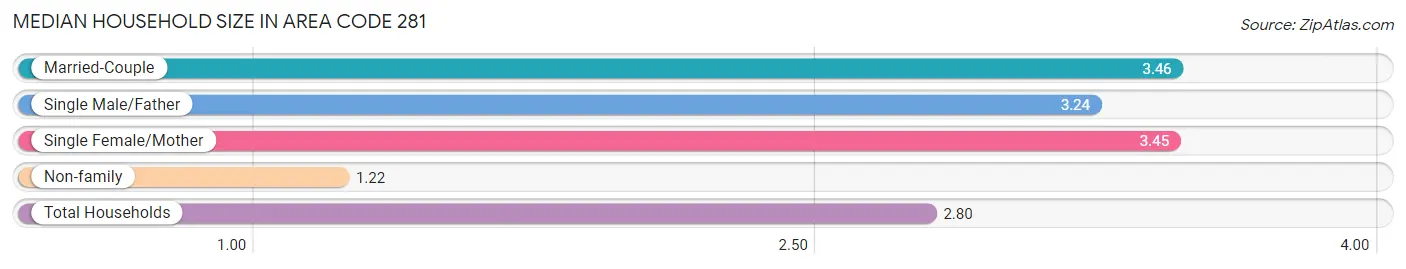
Median Household Size in Area Code 281
The median household size in Area Code 281 is 2.80 persons per household, with married-couple households (826,831 | 51.7%) accounting for the largest median household size of 3.4556 persons per household. non-family households (462,005 | 28.9%) represent the smallest median household size with 1.22 persons per household.
| Household Type | # Households | Household Size |
| Married-Couple | 826,831 (51.7%) | 3.46 |
| Single Male/Father | 91,946 (5.8%) | 3.24 |
| Single Female/Mother | 219,325 (13.7%) | 3.45 |
| Non-family | 462,005 (28.9%) | 1.22 |
| Total Households | 1,600,107 (100.0%) | 2.80 |
Household Size by Marriage Status in Area Code 281
Out of a total of 1,600,107 households in Area Code 281, 1,138,102 (71.1%) are family households, while 462,005 (28.9%) are nonfamily households. The most numerous type of family households are 2-person households, comprising 395,142, and the most common type of nonfamily households are 1-person households, comprising 380,662.
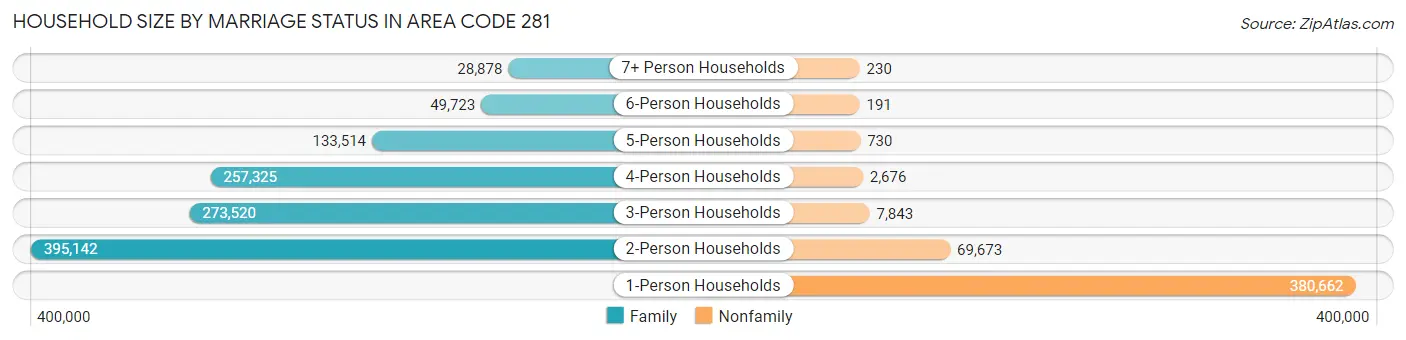
| Household Size | Family Households | Nonfamily Households |
| 1-Person Households | - | 380,662 (23.8%) |
| 2-Person Households | 395,142 (24.7%) | 69,673 (4.3%) |
| 3-Person Households | 273,520 (17.1%) | 7,843 (0.5%) |
| 4-Person Households | 257,325 (16.1%) | 2,676 (0.2%) |
| 5-Person Households | 133,514 (8.3%) | 730 (0.1%) |
| 6-Person Households | 49,723 (3.1%) | 191 (0.0%) |
| 7+ Person Households | 28,878 (1.8%) | 230 (0.0%) |
| Total | 1,138,102 (71.1%) | 462,005 (28.9%) |
Female Fertility in Area Code 281
Fertility by Age in Area Code 281
Average fertility rate in Area Code 281 is 56.4 births per 1,000 women. Women in the age bracket of 20 to 34 years have the highest fertility rate with 95.5 births per 1,000 women. Women in the age bracket of 20 to 34 years acount for 68.4% of all women with births.
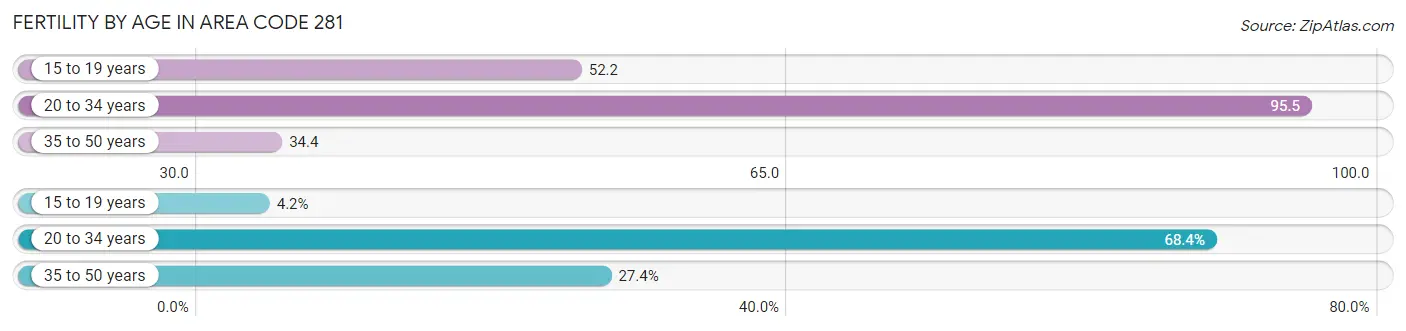
| Age Bracket | Women with Births | Births / 1,000 Women |
| 15 to 19 years | 2,697 (4.2%) | 52.2 |
| 20 to 34 years | 44,104 (68.4%) | 95.5 |
| 35 to 50 years | 17,641 (27.4%) | 34.4 |
| Total | 64,442 (100.0%) | 56.4 |
Fertility by Age by Marriage Status in Area Code 281
68.2% of women with births (64,442) in Area Code 281 are married. The highest percentage of unmarried women with births falls into 15 to 19 years age bracket with 97.0% of them unmarried at the time of birth, while the lowest percentage of unmarried women with births belong to 35 to 50 years age bracket with 30.0% of them unmarried.
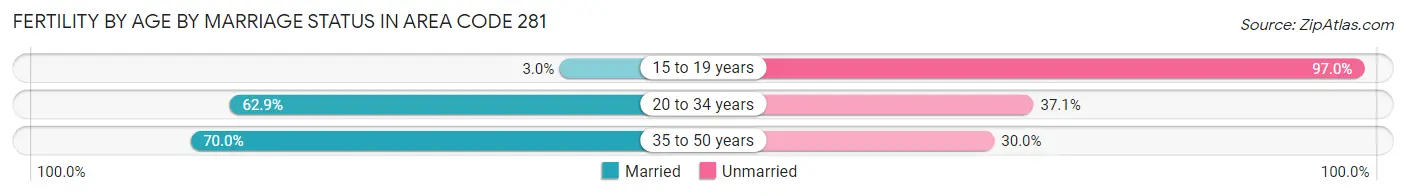
| Age Bracket | Married | Unmarried |
| 15 to 19 years | 80 (3.0%) | 2,617 (97.0%) |
| 20 to 34 years | 27,727 (62.9%) | 16,377 (37.1%) |
| 35 to 50 years | 12,345 (70.0%) | 5,296 (30.0%) |
| Total | 43,953 (68.2%) | 20,489 (31.8%) |
Fertility by Education in Area Code 281
Average fertility rate in Area Code 281 is 56.4 births per 1,000 women. Women with the education attainment of high school diploma have the highest fertility rate of 73.6 births per 1,000 women, while women with the education attainment of less than high school have the lowest fertility at 46.3 births per 1,000 women. Women with the education attainment of college or associate's degree represent 28.3% of all women with births.
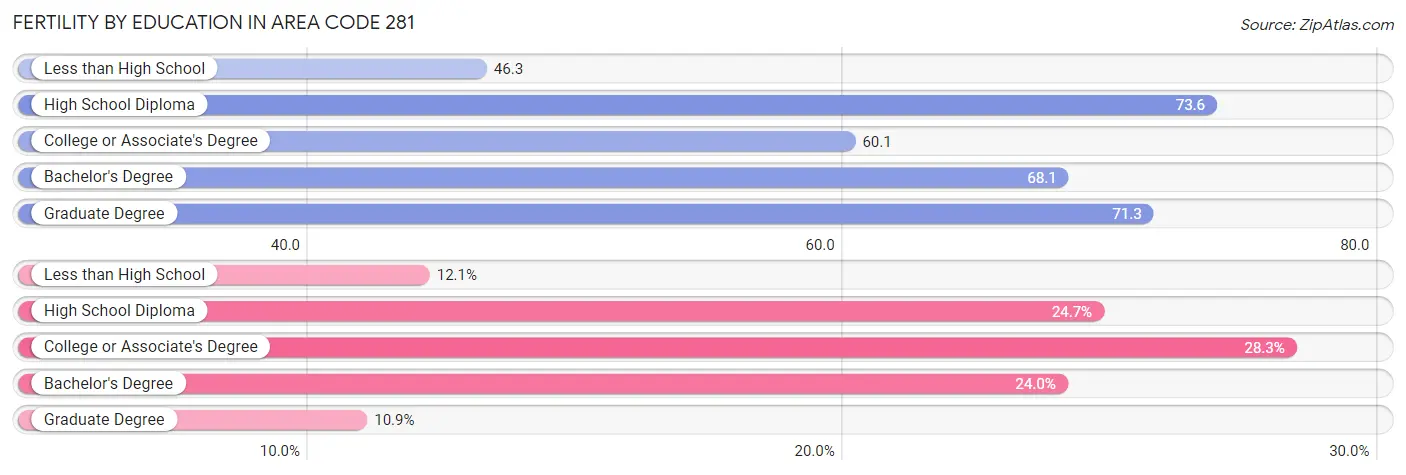
| Educational Attainment | Women with Births | Births / 1,000 Women |
| Less than High School | 7,778 (12.1%) | 46.3 |
| High School Diploma | 15,916 (24.7%) | 73.6 |
| College or Associate's Degree | 18,246 (28.3%) | 60.1 |
| Bachelor's Degree | 15,481 (24.0%) | 68.1 |
| Graduate Degree | 7,021 (10.9%) | 71.3 |
| Total | 64,442 (100.0%) | 56.4 |
Fertility by Education by Marriage Status in Area Code 281
31.8% of women with births in Area Code 281 are unmarried. Women with the educational attainment of graduate degree are most likely to be married with 66.9% of them married at childbirth, while women with the educational attainment of less than high school are least likely to be married with 63.9% of them unmarried at childbirth.
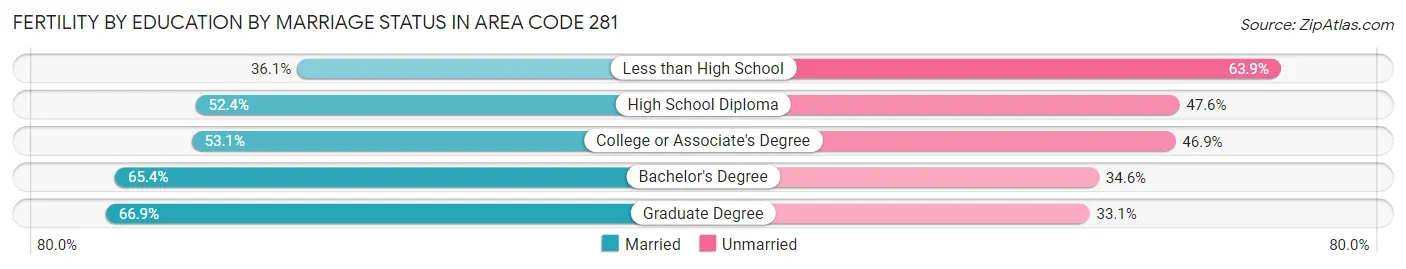
| Educational Attainment | Married | Unmarried |
| Less than High School | 2,807 (36.1%) | 4,971 (63.9%) |
| High School Diploma | 8,344 (52.4%) | 7,572 (47.6%) |
| College or Associate's Degree | 9,683 (53.1%) | 8,563 (46.9%) |
| Bachelor's Degree | 10,125 (65.4%) | 5,356 (34.6%) |
| Graduate Degree | 4,697 (66.9%) | 2,324 (33.1%) |
| Total | 43,953 (68.2%) | 20,489 (31.8%) |
Employment Characteristics in Area Code 281
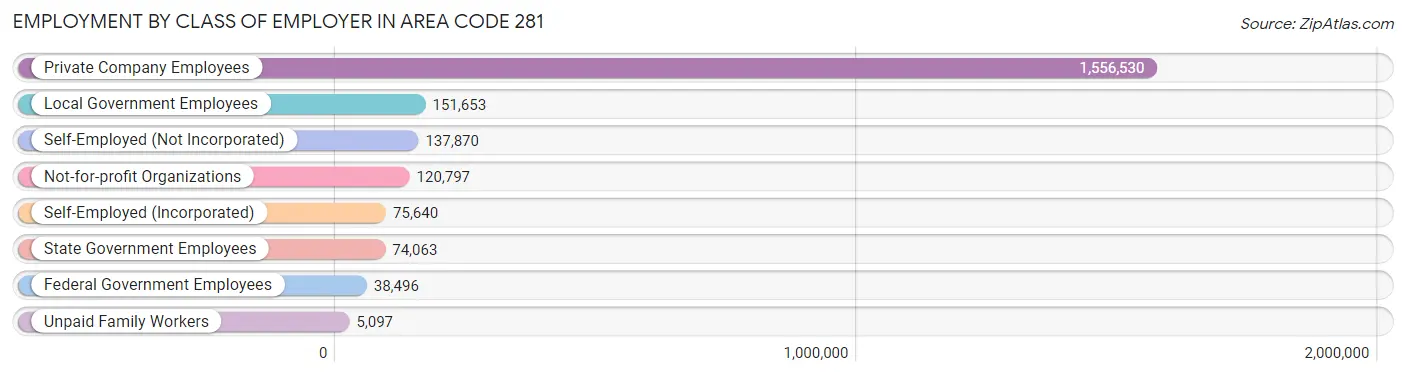
Employment by Class of Employer in Area Code 281
Among the 2,160,146 employed individuals in Area Code 281, private company employees (1,556,530 | 72.1%), local government employees (151,653 | 7.0%), and self-employed (not incorporated) (137,870 | 6.4%) make up the most common classes of employment.
| Employer Class | # Employees | % Employees |
| Private Company Employees | 1,556,530 | 72.1% |
| Self-Employed (Incorporated) | 75,640 | 3.5% |
| Self-Employed (Not Incorporated) | 137,870 | 6.4% |
| Not-for-profit Organizations | 120,797 | 5.6% |
| Local Government Employees | 151,653 | 7.0% |
| State Government Employees | 74,063 | 3.4% |
| Federal Government Employees | 38,496 | 1.8% |
| Unpaid Family Workers | 5,097 | 0.2% |
| Total | 2,160,146 | 100.0% |
Employment Status by Age in Area Code 281
According to the labor force statistics for Area Code 281, out of the total population over 16 years of age (3,490,434), 66.4% or 2,317,299 individuals are in the labor force, with 6.0% or 139,270 of them unemployed. The age group with the highest labor force participation rate is 30 to 34 years, with 82.0% or 273,850 individuals in the labor force. Within the labor force, the 16 to 19 years age range has the highest percentage of unemployed individuals, with 1,811.0% or 1,563,690 of them being unemployed.
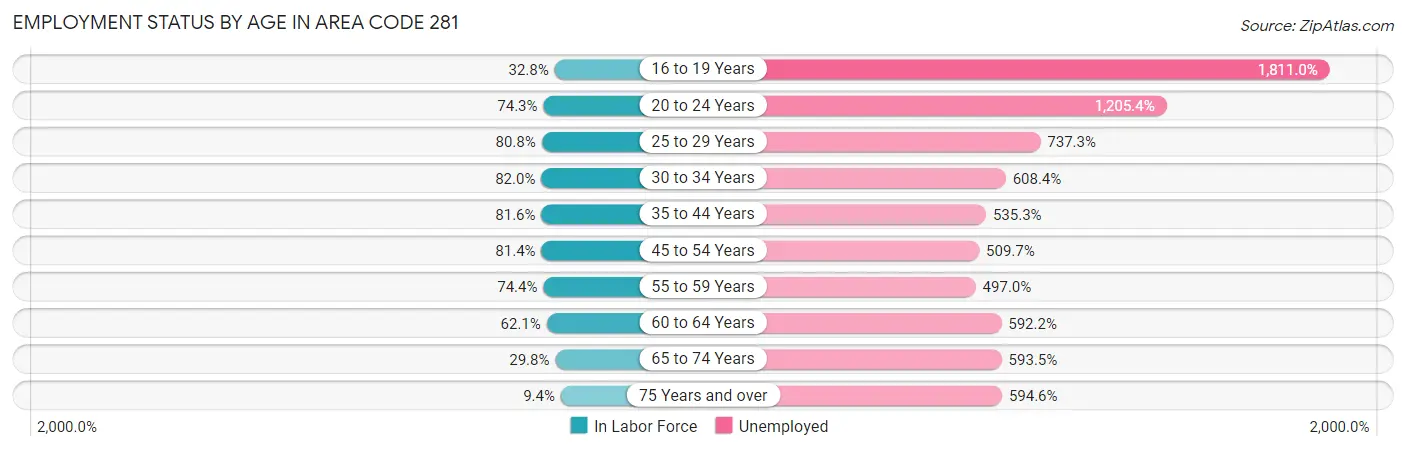
| Age Bracket | In Labor Force | Unemployed |
| 16 to 19 Years | 86,348 (32.8%) | 1,563,690 (1,811.0%) |
| 20 to 24 Years | 217,445 (74.3%) | 2,621,215 (1,205.4%) |
| 25 to 29 Years | 258,377 (80.8%) | 1,905,043 (737.3%) |
| 30 to 34 Years | 273,866 (82.0%) | 1,666,103 (608.4%) |
| 35 to 44 Years | 555,141 (81.6%) | 2,971,611 (535.3%) |
| 45 to 54 Years | 483,310 (81.4%) | 2,463,421 (509.7%) |
| 55 to 59 Years | 191,966 (74.4%) | 954,131 (497.0%) |
| 60 to 64 Years | 146,893 (62.1%) | 869,948 (592.2%) |
| 65 to 74 Years | 97,069 (29.8%) | 576,164 (593.5%) |
| 75 Years and over | 17,580 (9.4%) | 104,572 (594.6%) |
| Total | 2,317,166 (66.4%) | 139,183 (6.0%) |
Employment Status by Educational Attainment in Area Code 281
According to labor force statistics for Area Code 281, 78.7% of individuals (1,906,182) out of the total population between 25 and 64 years of age (2,422,086) are in the labor force, with 565.5% or 10,779,459 of them being unemployed. The group with the highest labor force participation rate are those with the educational attainment of bachelor's degree or higher, with 86.2% or 769,344 individuals in the labor force. Within the labor force, individuals with less than high school education have the highest percentage of unemployment, with 768.0% or 1,749,281 of them being unemployed.
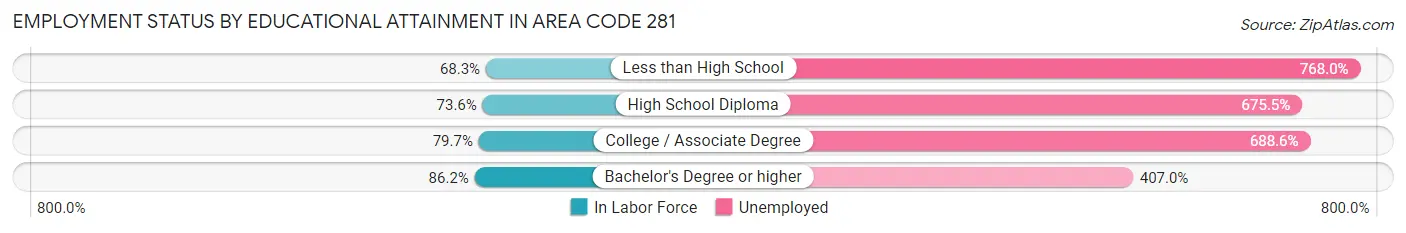
| Educational Attainment | In Labor Force | Unemployed |
| Less than High School | 227,776 (68.3%) | 2,562,301 (768.0%) |
| High School Diploma | 380,665 (73.6%) | 3,495,989 (675.5%) |
| College / Associate Degree | 540,450 (79.7%) | 4,669,335 (688.6%) |
| Bachelor's Degree or higher | 769,358 (86.2%) | 3,633,781 (407.0%) |
| Total | 1,906,140 (78.7%) | 13,696,896 (565.5%) |
Employment Occupations by Sex in Area Code 281
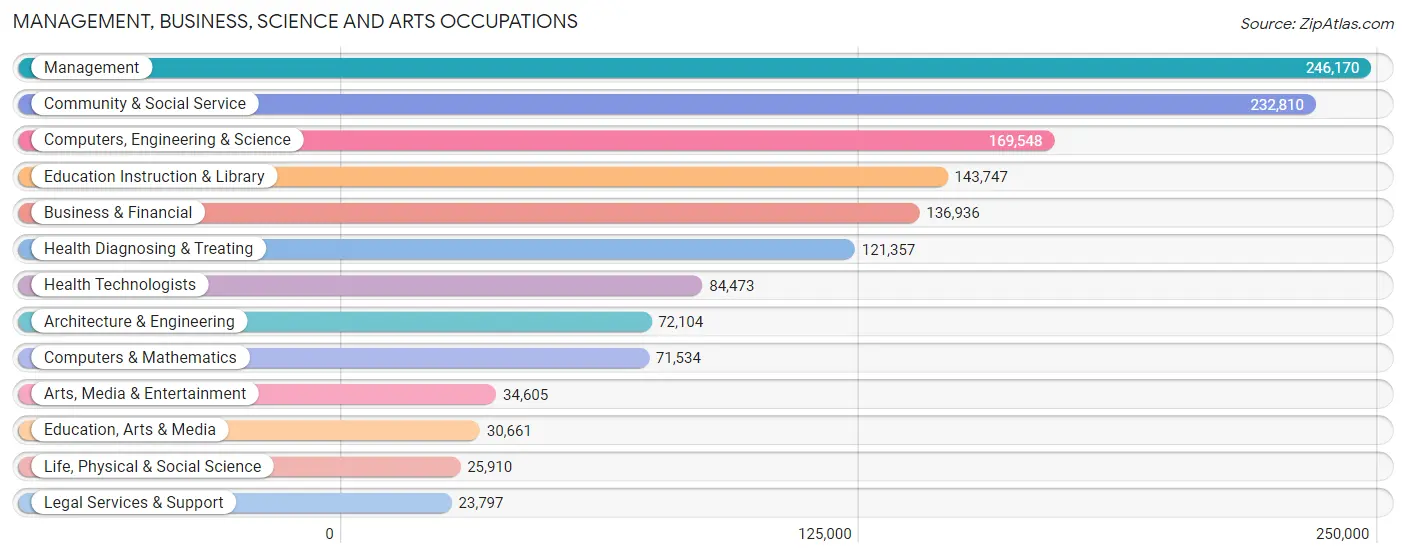
Management, Business, Science and Arts Occupations
The most common Management, Business, Science and Arts occupations in Area Code 281 are Management (246,170 | 11.2%), Community & Social Service (232,810 | 10.6%), Computers, Engineering & Science (169,548 | 7.7%), Education Instruction & Library (143,747 | 6.5%), and Business & Financial (136,936 | 6.2%).
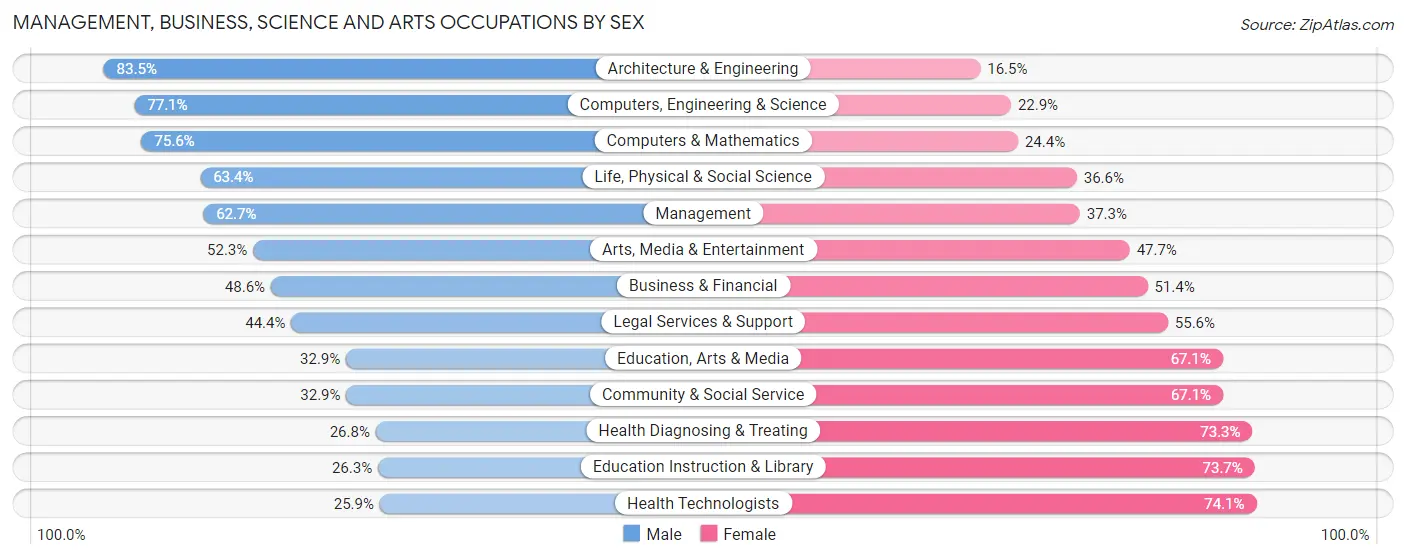
Management, Business, Science and Arts Occupations by Sex
Within the Management, Business, Science and Arts occupations in Area Code 281, the most male-oriented occupations are Architecture & Engineering (83.5%), Computers, Engineering & Science (77.1%), and Computers & Mathematics (75.6%), while the most female-oriented occupations are Health Technologists (74.1%), Education Instruction & Library (73.7%), and Health Diagnosing & Treating (73.3%).
| Occupation | Male | Female |
| Management | 154,452 (62.7%) | 91,718 (37.3%) |
| Business & Financial | 66,578 (48.6%) | 70,358 (51.4%) |
| Computers, Engineering & Science | 130,723 (77.1%) | 38,825 (22.9%) |
| Computers & Mathematics | 54,100 (75.6%) | 17,434 (24.4%) |
| Architecture & Engineering | 60,207 (83.5%) | 11,897 (16.5%) |
| Life, Physical & Social Science | 16,416 (63.4%) | 9,494 (36.6%) |
| Community & Social Service | 76,542 (32.9%) | 156,268 (67.1%) |
| Education, Arts & Media | 10,096 (32.9%) | 20,565 (67.1%) |
| Legal Services & Support | 10,559 (44.4%) | 13,238 (55.6%) |
| Education Instruction & Library | 37,778 (26.3%) | 105,969 (73.7%) |
| Arts, Media & Entertainment | 18,109 (52.3%) | 16,496 (47.7%) |
| Health Diagnosing & Treating | 32,458 (26.8%) | 88,899 (73.3%) |
| Health Technologists | 21,887 (25.9%) | 62,586 (74.1%) |
| Total (Category) | 460,753 (50.8%) | 446,068 (49.2%) |
| Total (Overall) | 1,220,161 (55.4%) | 982,904 (44.6%) |
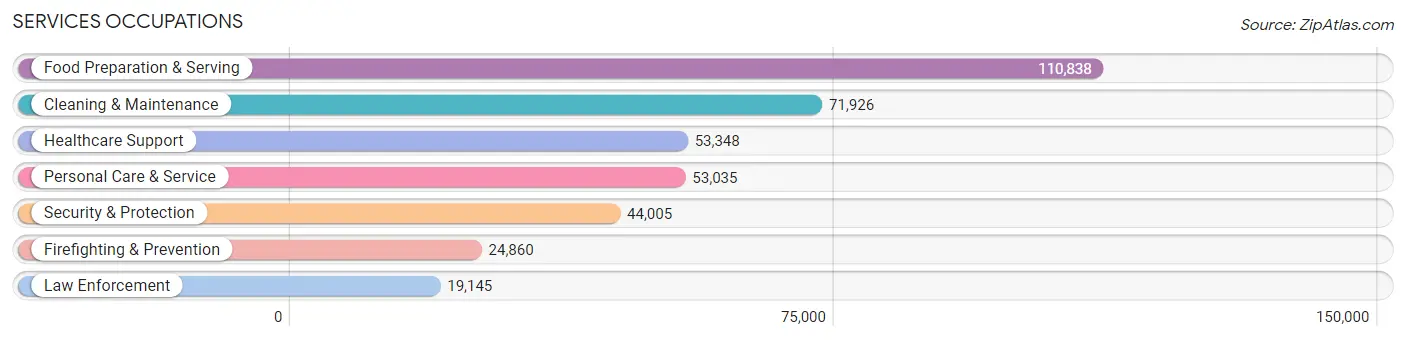
Services Occupations
The most common Services occupations in Area Code 281 are Food Preparation & Serving (110,838 | 5.0%), Cleaning & Maintenance (71,926 | 3.3%), Healthcare Support (53,348 | 2.4%), Personal Care & Service (53,035 | 2.4%), and Security & Protection (44,005 | 2.0%).
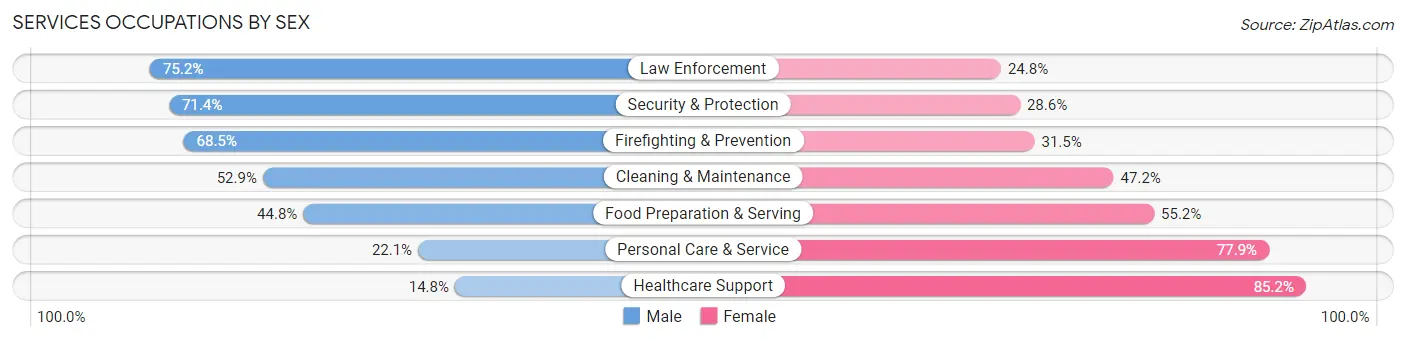
Services Occupations by Sex
Within the Services occupations in Area Code 281, the most male-oriented occupations are Law Enforcement (75.2%), Security & Protection (71.4%), and Firefighting & Prevention (68.5%), while the most female-oriented occupations are Healthcare Support (85.2%), Personal Care & Service (77.9%), and Food Preparation & Serving (55.2%).
| Occupation | Male | Female |
| Healthcare Support | 7,907 (14.8%) | 45,441 (85.2%) |
| Security & Protection | 31,420 (71.4%) | 12,585 (28.6%) |
| Firefighting & Prevention | 17,031 (68.5%) | 7,829 (31.5%) |
| Law Enforcement | 14,389 (75.2%) | 4,756 (24.8%) |
| Food Preparation & Serving | 49,699 (44.8%) | 61,139 (55.2%) |
| Cleaning & Maintenance | 38,014 (52.8%) | 33,912 (47.1%) |
| Personal Care & Service | 11,728 (22.1%) | 41,307 (77.9%) |
| Total (Category) | 138,768 (41.6%) | 194,384 (58.4%) |
| Total (Overall) | 1,220,161 (55.4%) | 982,904 (44.6%) |
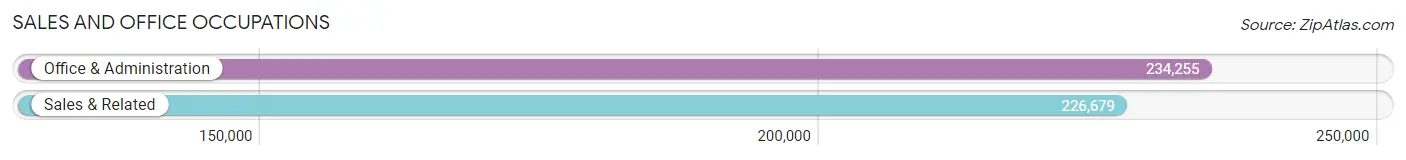
Sales and Office Occupations
The most common Sales and Office occupations in Area Code 281 are Office & Administration (234,255 | 10.6%), and Sales & Related (226,679 | 10.3%).
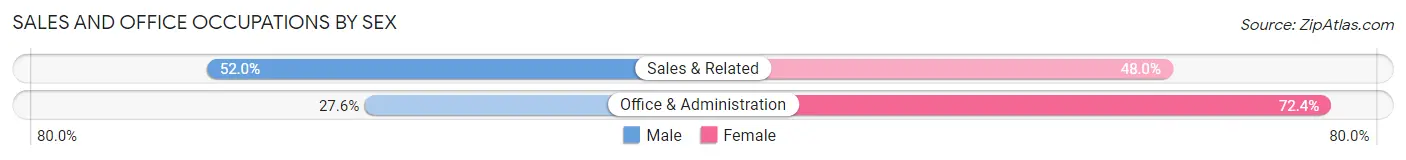
Sales and Office Occupations by Sex
| Occupation | Male | Female |
| Sales & Related | 117,796 (52.0%) | 108,883 (48.0%) |
| Office & Administration | 64,729 (27.6%) | 169,526 (72.4%) |
| Total (Category) | 182,525 (39.6%) | 278,409 (60.4%) |
| Total (Overall) | 1,220,161 (55.4%) | 982,904 (44.6%) |
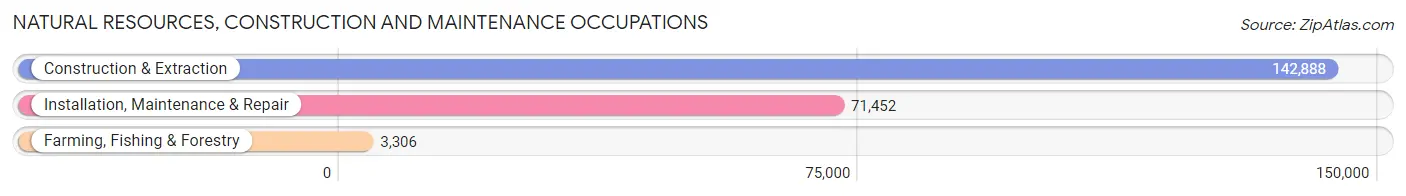
Natural Resources, Construction and Maintenance Occupations
The most common Natural Resources, Construction and Maintenance occupations in Area Code 281 are Construction & Extraction (142,888 | 6.5%), Installation, Maintenance & Repair (71,452 | 3.2%), and Farming, Fishing & Forestry (3,306 | 0.2%).
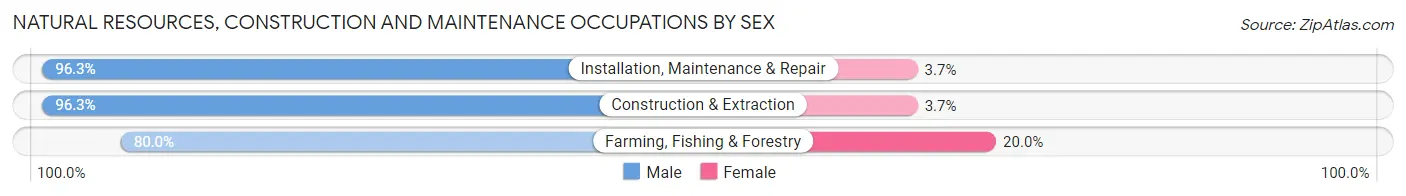
Natural Resources, Construction and Maintenance Occupations by Sex
| Occupation | Male | Female |
| Farming, Fishing & Forestry | 2,644 (80.0%) | 662 (20.0%) |
| Construction & Extraction | 137,595 (96.3%) | 5,293 (3.7%) |
| Installation, Maintenance & Repair | 68,818 (96.3%) | 2,634 (3.7%) |
| Total (Category) | 209,057 (96.1%) | 8,589 (4.0%) |
| Total (Overall) | 1,220,161 (55.4%) | 982,904 (44.6%) |
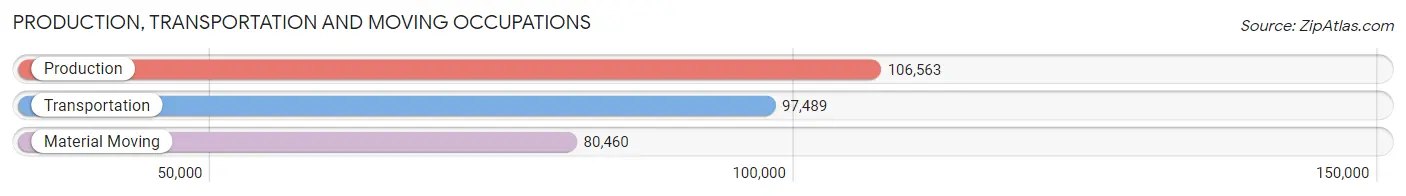
Production, Transportation and Moving Occupations
The most common Production, Transportation and Moving occupations in Area Code 281 are Production (106,563 | 4.8%), Transportation (97,489 | 4.4%), and Material Moving (80,460 | 3.6%).
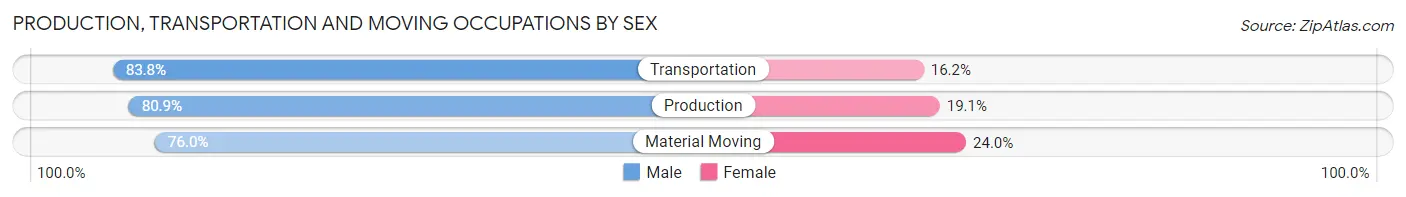
Production, Transportation and Moving Occupations by Sex
| Occupation | Male | Female |
| Production | 86,173 (80.9%) | 20,390 (19.1%) |
| Transportation | 81,707 (83.8%) | 15,782 (16.2%) |
| Material Moving | 61,178 (76.0%) | 19,282 (24.0%) |
| Total (Category) | 229,058 (80.5%) | 55,454 (19.5%) |
| Total (Overall) | 1,220,161 (55.4%) | 982,904 (44.6%) |
Employment Industries by Sex in Area Code 281
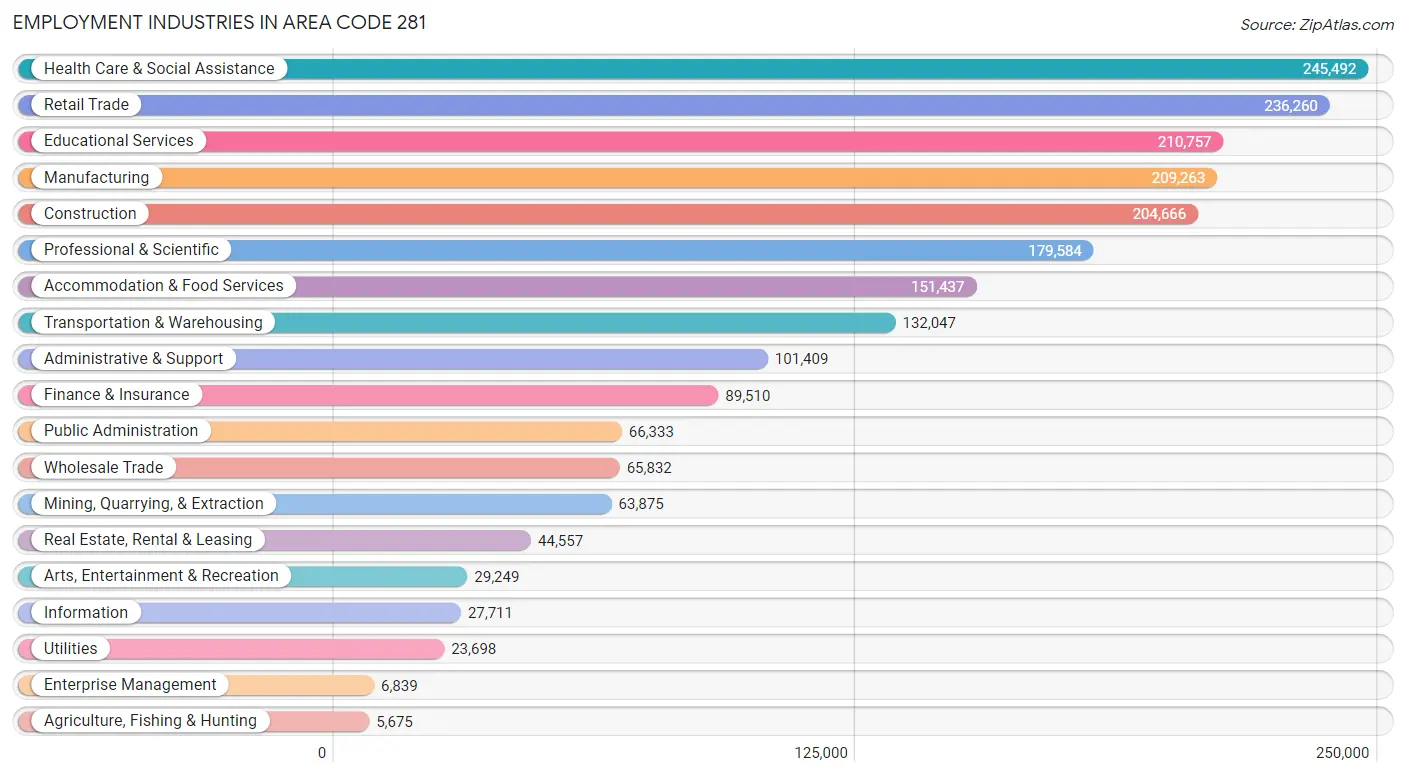
Employment Industries in Area Code 281
The major employment industries in Area Code 281 include Health Care & Social Assistance (245,492 | 11.1%), Retail Trade (236,260 | 10.7%), Educational Services (210,757 | 9.6%), Manufacturing (209,263 | 9.5%), and Construction (204,666 | 9.3%).
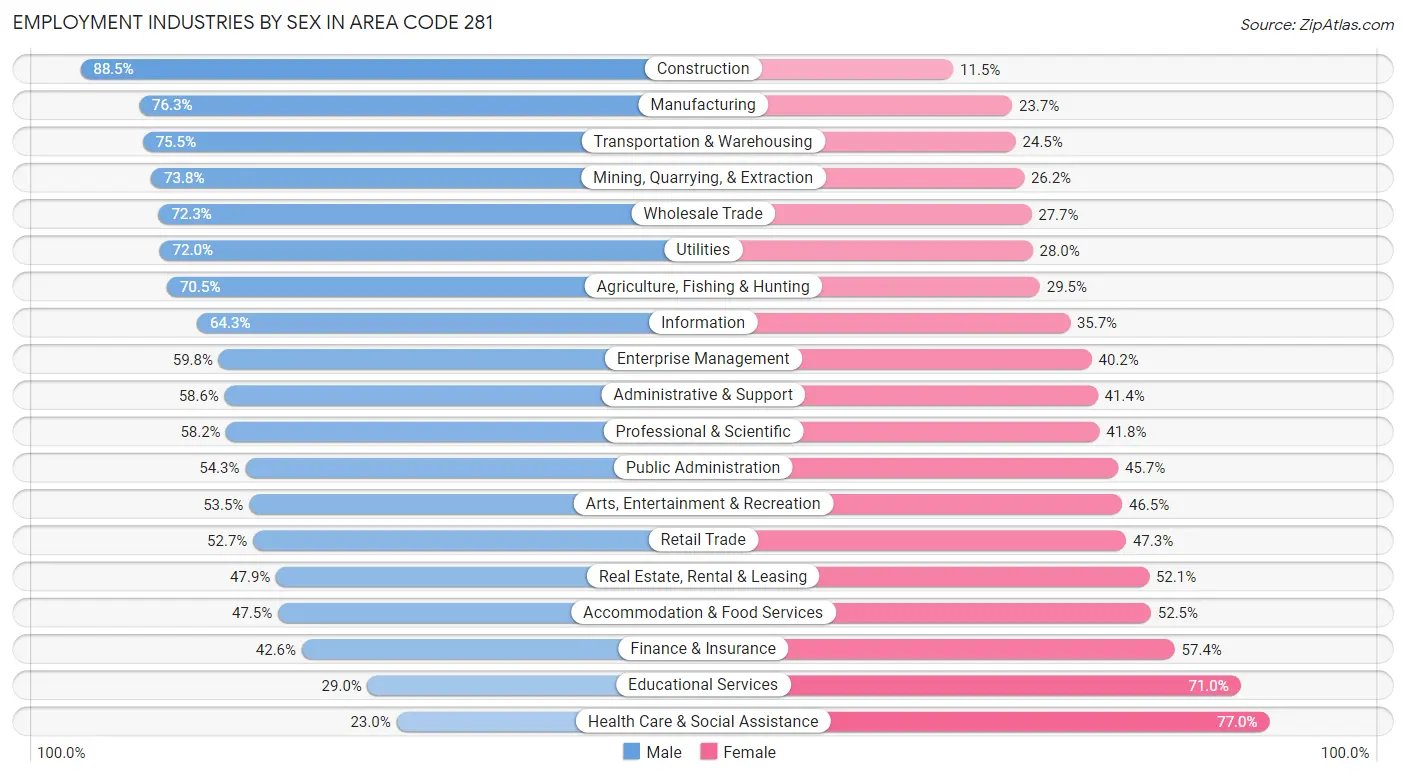
Employment Industries by Sex in Area Code 281
The Area Code 281 industries that see more men than women are Construction (88.5%), Manufacturing (76.3%), and Transportation & Warehousing (75.5%), whereas the industries that tend to have a higher number of women are Health Care & Social Assistance (77.0%), Educational Services (71.0%), and Finance & Insurance (57.4%).
| Industry | Male | Female |
| Agriculture, Fishing & Hunting | 4,002 (70.5%) | 1,673 (29.5%) |
| Mining, Quarrying, & Extraction | 47,143 (73.8%) | 16,732 (26.2%) |
| Construction | 181,039 (88.5%) | 23,627 (11.5%) |
| Manufacturing | 159,630 (76.3%) | 49,633 (23.7%) |
| Wholesale Trade | 47,591 (72.3%) | 18,241 (27.7%) |
| Retail Trade | 124,476 (52.7%) | 111,784 (47.3%) |
| Transportation & Warehousing | 99,750 (75.5%) | 32,297 (24.5%) |
| Utilities | 17,071 (72.0%) | 6,627 (28.0%) |
| Information | 17,816 (64.3%) | 9,895 (35.7%) |
| Finance & Insurance | 38,138 (42.6%) | 51,372 (57.4%) |
| Real Estate, Rental & Leasing | 21,355 (47.9%) | 23,202 (52.1%) |
| Professional & Scientific | 104,556 (58.2%) | 75,028 (41.8%) |
| Enterprise Management | 4,090 (59.8%) | 2,749 (40.2%) |
| Administrative & Support | 59,401 (58.6%) | 42,008 (41.4%) |
| Educational Services | 61,088 (29.0%) | 149,669 (71.0%) |
| Health Care & Social Assistance | 56,536 (23.0%) | 188,956 (77.0%) |
| Arts, Entertainment & Recreation | 15,651 (53.5%) | 13,598 (46.5%) |
| Accommodation & Food Services | 71,996 (47.5%) | 79,441 (52.5%) |
| Public Administration | 36,035 (54.3%) | 30,298 (45.7%) |
| Total | 1,220,161 (55.4%) | 982,904 (44.6%) |
Education in Area Code 281
School Enrollment in Area Code 281
The most common levels of schooling among the 1,270,353 students in Area Code 281 are high school (286,917 | 22.6%), middle school (284,447 | 22.4%), and elementary school (275,987 | 21.7%).
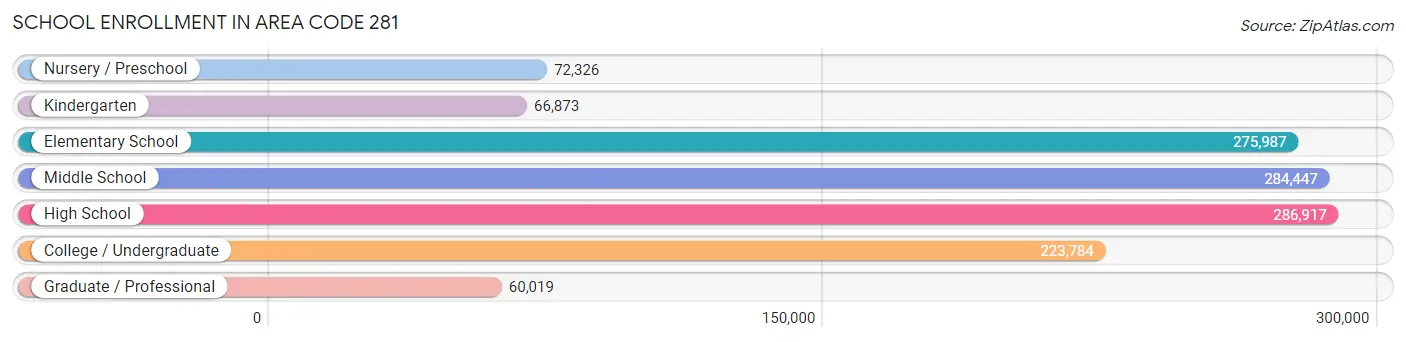
| School Level | # Students | % Students |
| Nursery / Preschool | 72,326 | 5.7% |
| Kindergarten | 66,873 | 5.3% |
| Elementary School | 275,987 | 21.7% |
| Middle School | 284,447 | 22.4% |
| High School | 286,917 | 22.6% |
| College / Undergraduate | 223,784 | 17.6% |
| Graduate / Professional | 60,019 | 4.7% |
| Total | 1,270,353 | 100.0% |
School Enrollment by Age by Funding Source in Area Code 281
Out of a total of 1,270,353 students who are enrolled in schools in Area Code 281, 159,043 (12.5%) attend a private institution, while the remaining 1,111,310 (87.5%) are enrolled in public schools. The age group of 3 to 4 year olds has the highest likelihood of being enrolled in private schools, with 25,859 (46.4% in the age bracket) enrolled. Conversely, the age group of 10 to 14 year olds has the lowest likelihood of being enrolled in a private school, with 328,066 (92.5% in the age bracket) attending a public institution.
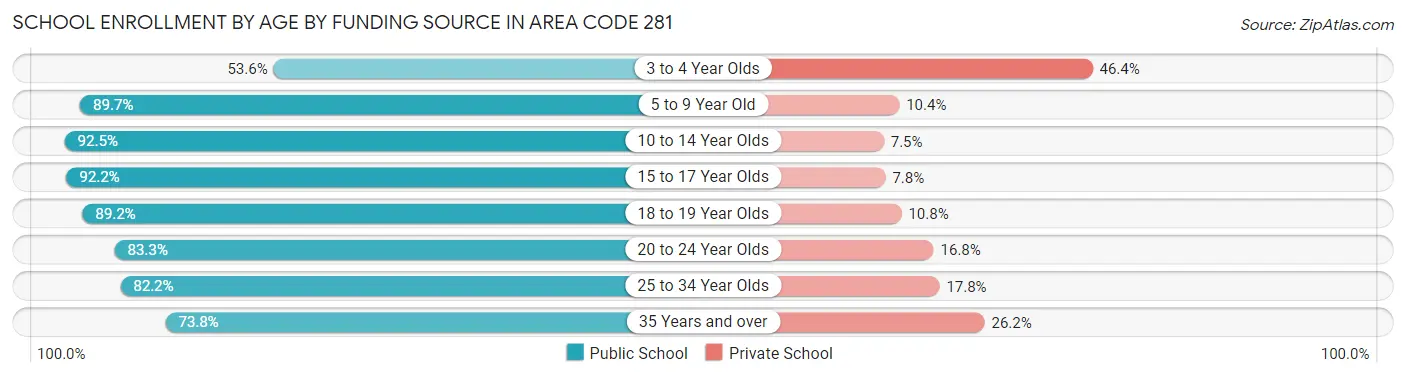
| Age Bracket | Public School | Private School |
| 3 to 4 Year Olds | 29,920 (53.6%) | 25,859 (46.4%) |
| 5 to 9 Year Old | 288,571 (89.6%) | 33,300 (10.3%) |
| 10 to 14 Year Olds | 328,066 (92.5%) | 26,477 (7.5%) |
| 15 to 17 Year Olds | 188,553 (92.2%) | 15,924 (7.8%) |
| 18 to 19 Year Olds | 78,070 (89.2%) | 9,427 (10.8%) |
| 20 to 24 Year Olds | 90,390 (83.3%) | 18,190 (16.8%) |
| 25 to 34 Year Olds | 60,407 (82.2%) | 13,120 (17.8%) |
| 35 Years and over | 47,266 (73.8%) | 16,813 (26.2%) |
| Total | 1,111,310 (87.5%) | 159,043 (12.5%) |
Educational Attainment by Field of Study in Area Code 281
Business (270,916 | 23.9%), engineering (155,176 | 13.7%), science & technology (105,073 | 9.3%), education (102,097 | 9.0%), and social sciences (69,453 | 6.1%) are the most common fields of study among 1,132,015 individuals in Area Code 281 who have obtained a bachelor's degree or higher.
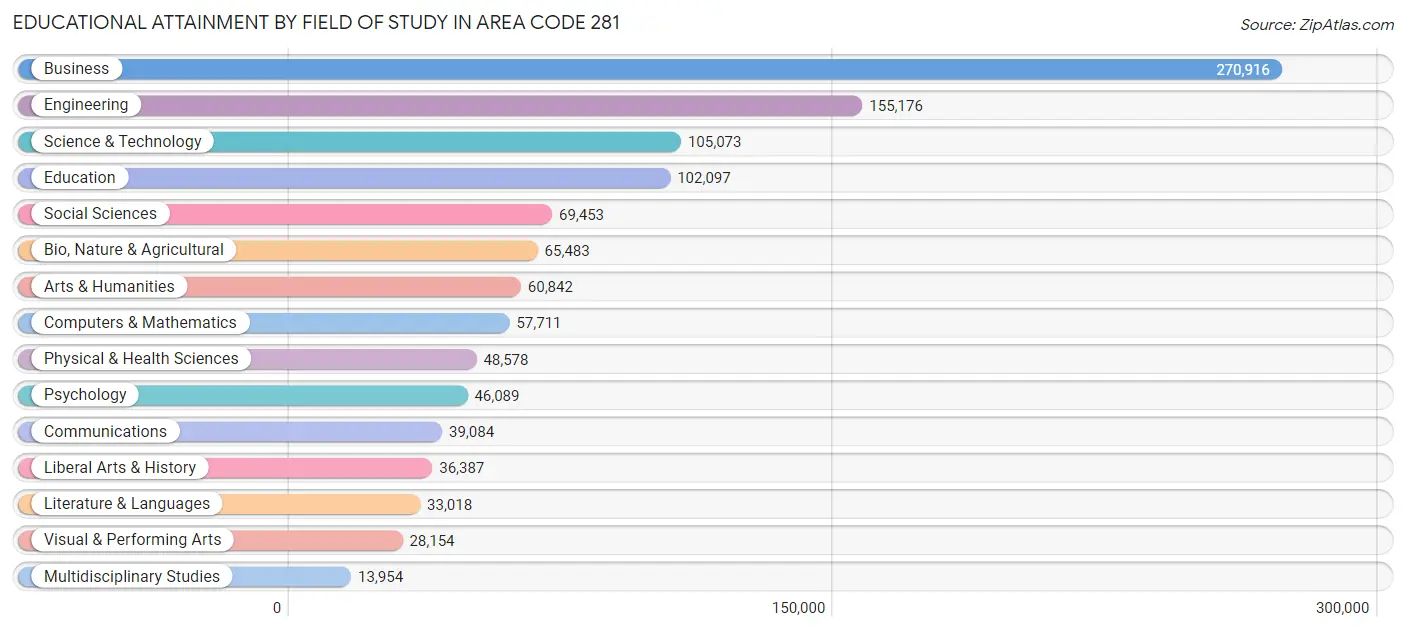
| Field of Study | # Graduates | % Graduates |
| Computers & Mathematics | 57,711 | 5.1% |
| Bio, Nature & Agricultural | 65,483 | 5.8% |
| Physical & Health Sciences | 48,578 | 4.3% |
| Psychology | 46,089 | 4.1% |
| Social Sciences | 69,453 | 6.1% |
| Engineering | 155,176 | 13.7% |
| Multidisciplinary Studies | 13,954 | 1.2% |
| Science & Technology | 105,073 | 9.3% |
| Business | 270,916 | 23.9% |
| Education | 102,097 | 9.0% |
| Literature & Languages | 33,018 | 2.9% |
| Liberal Arts & History | 36,387 | 3.2% |
| Visual & Performing Arts | 28,154 | 2.5% |
| Communications | 39,084 | 3.5% |
| Arts & Humanities | 60,842 | 5.4% |
| Total | 1,132,015 | 100.0% |
Transportation & Commute in Area Code 281
Vehicle Availability by Sex in Area Code 281
The most prevalent vehicle ownership categories in Area Code 281 are males with 2 vehicles (533,877, accounting for 44.5%) and females with 2 vehicles (403,218, making up 55.7%).
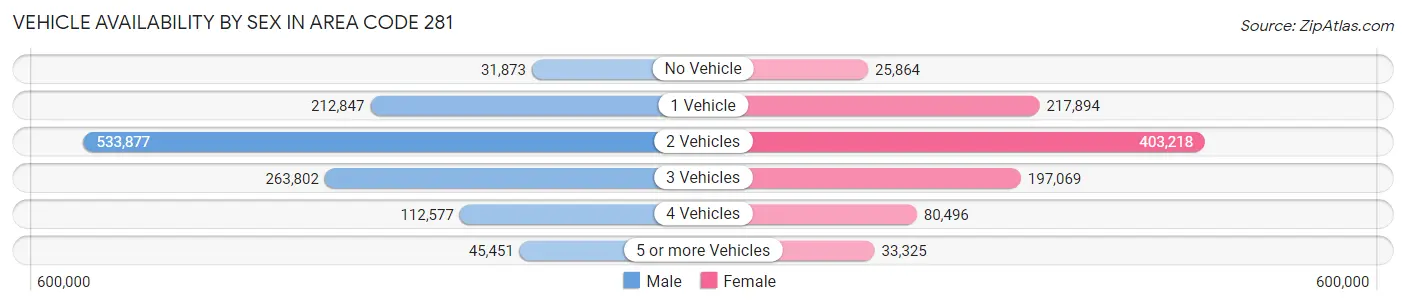
| Vehicles Available | Male | Female |
| No Vehicle | 31,873 (2.7%) | 25,864 (2.7%) |
| 1 Vehicle | 212,847 (17.7%) | 217,894 (22.8%) |
| 2 Vehicles | 533,877 (44.5%) | 403,218 (42.1%) |
| 3 Vehicles | 263,802 (22.0%) | 197,069 (20.6%) |
| 4 Vehicles | 112,577 (9.4%) | 80,496 (8.4%) |
| 5 or more Vehicles | 45,451 (3.8%) | 33,325 (3.5%) |
| Total | 1,200,427 (100.0%) | 957,866 (100.0%) |
Commute Time in Area Code 281
The most frequently occuring commute durations in Area Code 281 are 30 to 34 minutes (345,832 commuters, 17.9%), 20 to 24 minutes (263,152 commuters, 13.6%), and 15 to 19 minutes (250,261 commuters, 13.0%).
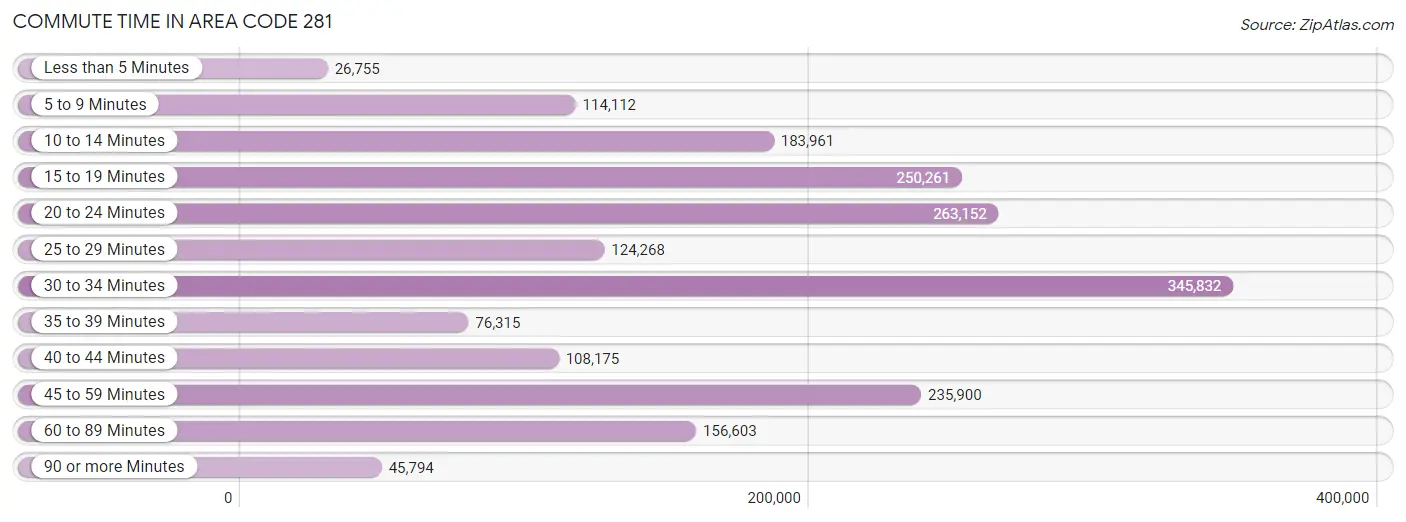
| Commute Time | # Commuters | % Commuters |
| Less than 5 Minutes | 26,755 | 1.4% |
| 5 to 9 Minutes | 114,112 | 5.9% |
| 10 to 14 Minutes | 183,961 | 9.5% |
| 15 to 19 Minutes | 250,261 | 13.0% |
| 20 to 24 Minutes | 263,152 | 13.6% |
| 25 to 29 Minutes | 124,268 | 6.4% |
| 30 to 34 Minutes | 345,832 | 17.9% |
| 35 to 39 Minutes | 76,315 | 4.0% |
| 40 to 44 Minutes | 108,175 | 5.6% |
| 45 to 59 Minutes | 235,900 | 12.2% |
| 60 to 89 Minutes | 156,603 | 8.1% |
| 90 or more Minutes | 45,794 | 2.4% |
Commute Time by Sex in Area Code 281
The most common commute times in Area Code 281 are 30 to 34 minutes (206,612 commuters, 19.0%) for males and 30 to 34 minutes (139,220 commuters, 16.5%) for females.
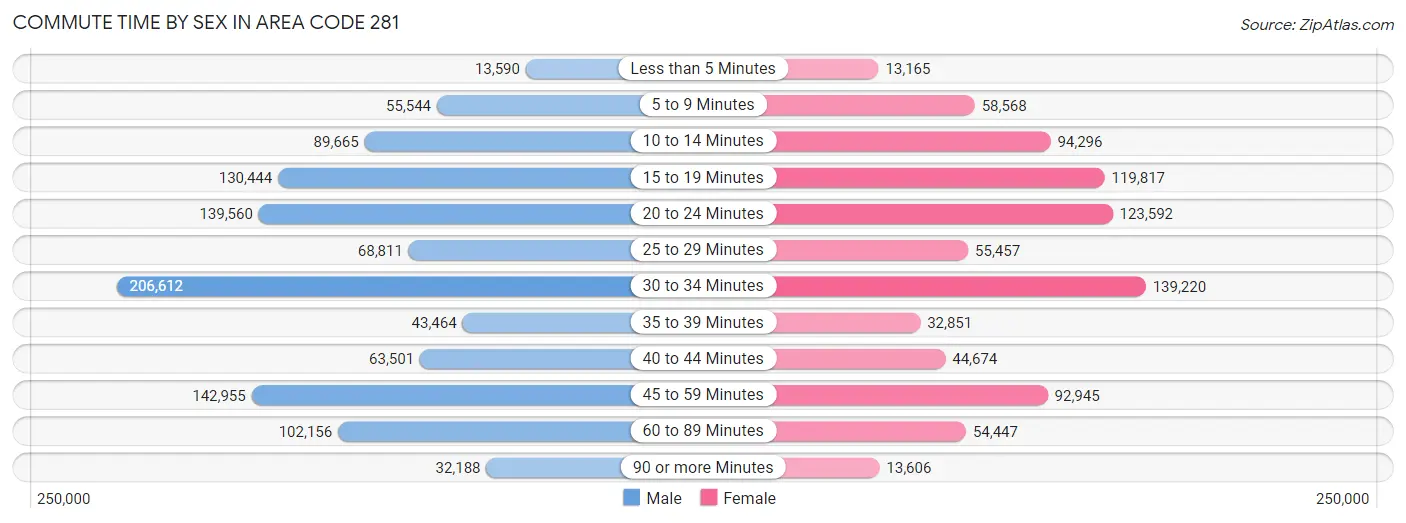
| Commute Time | Male | Female |
| Less than 5 Minutes | 13,590 (1.3%) | 13,165 (1.6%) |
| 5 to 9 Minutes | 55,544 (5.1%) | 58,568 (7.0%) |
| 10 to 14 Minutes | 89,665 (8.2%) | 94,296 (11.2%) |
| 15 to 19 Minutes | 130,444 (12.0%) | 119,817 (14.2%) |
| 20 to 24 Minutes | 139,560 (12.8%) | 123,592 (14.7%) |
| 25 to 29 Minutes | 68,811 (6.3%) | 55,457 (6.6%) |
| 30 to 34 Minutes | 206,612 (19.0%) | 139,220 (16.5%) |
| 35 to 39 Minutes | 43,464 (4.0%) | 32,851 (3.9%) |
| 40 to 44 Minutes | 63,501 (5.8%) | 44,674 (5.3%) |
| 45 to 59 Minutes | 142,955 (13.1%) | 92,945 (11.0%) |
| 60 to 89 Minutes | 102,156 (9.4%) | 54,447 (6.5%) |
| 90 or more Minutes | 32,188 (3.0%) | 13,606 (1.6%) |
Time of Departure to Work by Sex in Area Code 281
The most frequent times of departure to work in Area Code 281 are 7:00 AM to 7:29 AM (159,668, 14.7%) for males and 7:00 AM to 7:29 AM (137,463, 16.3%) for females.
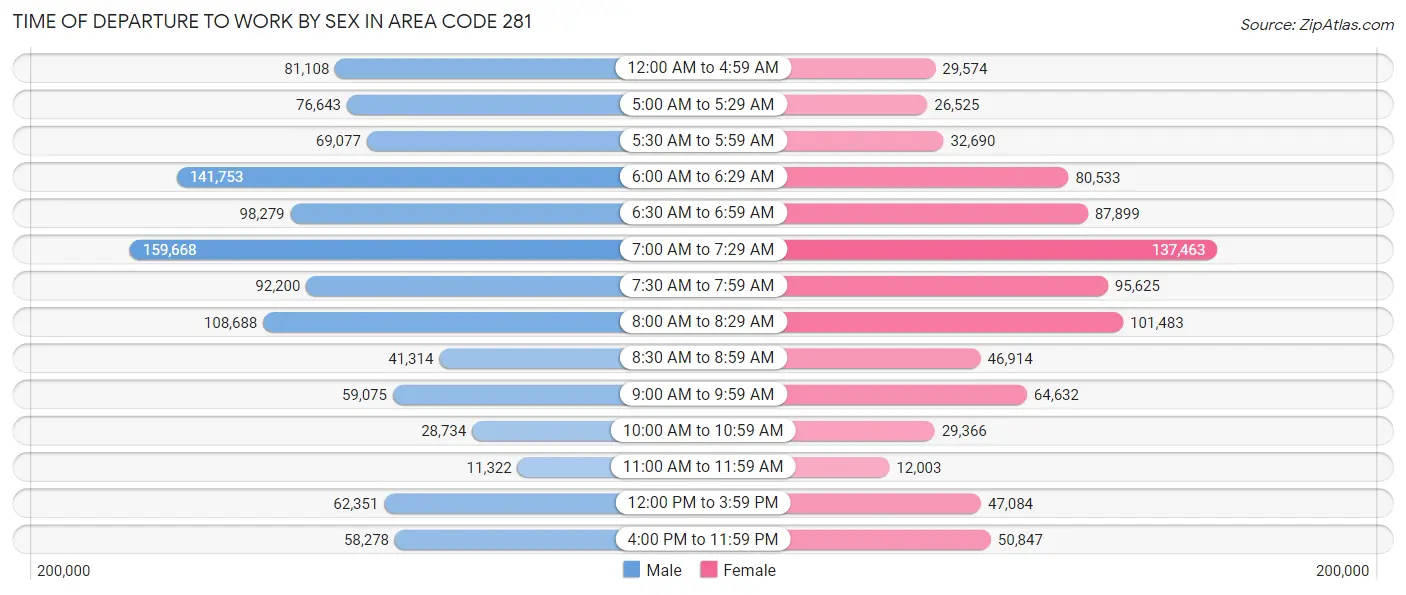
| Time of Departure | Male | Female |
| 12:00 AM to 4:59 AM | 81,108 (7.4%) | 29,574 (3.5%) |
| 5:00 AM to 5:29 AM | 76,643 (7.0%) | 26,525 (3.2%) |
| 5:30 AM to 5:59 AM | 69,077 (6.4%) | 32,690 (3.9%) |
| 6:00 AM to 6:29 AM | 141,753 (13.0%) | 80,533 (9.6%) |
| 6:30 AM to 6:59 AM | 98,279 (9.0%) | 87,899 (10.4%) |
| 7:00 AM to 7:29 AM | 159,668 (14.7%) | 137,463 (16.3%) |
| 7:30 AM to 7:59 AM | 92,200 (8.5%) | 95,625 (11.4%) |
| 8:00 AM to 8:29 AM | 108,688 (10.0%) | 101,483 (12.0%) |
| 8:30 AM to 8:59 AM | 41,314 (3.8%) | 46,914 (5.6%) |
| 9:00 AM to 9:59 AM | 59,075 (5.4%) | 64,632 (7.7%) |
| 10:00 AM to 10:59 AM | 28,734 (2.6%) | 29,366 (3.5%) |
| 11:00 AM to 11:59 AM | 11,322 (1.0%) | 12,003 (1.4%) |
| 12:00 PM to 3:59 PM | 62,351 (5.7%) | 47,084 (5.6%) |
| 4:00 PM to 11:59 PM | 58,278 (5.3%) | 50,847 (6.0%) |
| Total | 1,088,490 (100.0%) | 842,638 (100.0%) |
Housing Occupancy in Area Code 281
Occupancy by Ownership in Area Code 281
Of the total 1,600,107 dwellings in Area Code 281, owner-occupied units account for 984,885 (61.6%), while renter-occupied units make up 615,222 (38.5%).
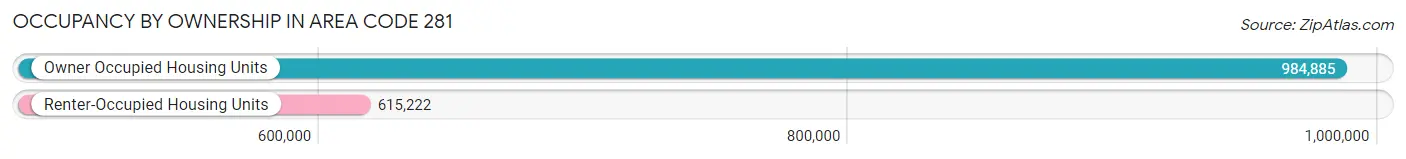
| Occupancy | # Housing Units | % Housing Units |
| Owner Occupied Housing Units | 984,885 | 61.6% |
| Renter-Occupied Housing Units | 615,222 | 38.5% |
| Total Occupied Housing Units | 1,600,107 | 100.0% |
Occupancy by Household Size in Area Code 281
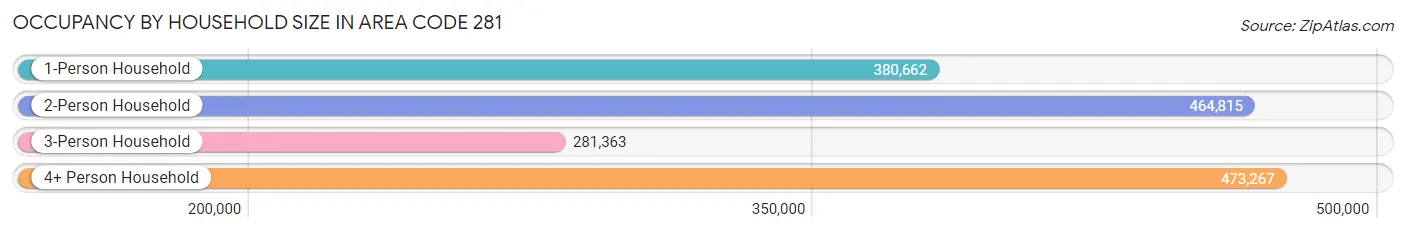
| Household Size | # Housing Units | % Housing Units |
| 1-Person Household | 380,662 | 23.8% |
| 2-Person Household | 464,815 | 29.0% |
| 3-Person Household | 281,363 | 17.6% |
| 4+ Person Household | 473,267 | 29.6% |
| Total Housing Units | 1,600,107 | 100.0% |
Occupancy by Ownership by Household Size in Area Code 281
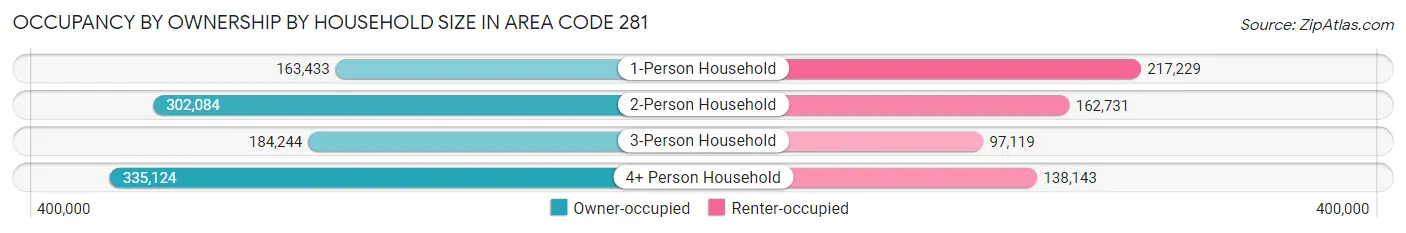
| Household Size | Owner-occupied | Renter-occupied |
| 1-Person Household | 163,433 (42.9%) | 217,229 (57.1%) |
| 2-Person Household | 302,084 (65.0%) | 162,731 (35.0%) |
| 3-Person Household | 184,244 (65.5%) | 97,119 (34.5%) |
| 4+ Person Household | 335,124 (70.8%) | 138,143 (29.2%) |
| Total Housing Units | 984,885 (61.6%) | 615,222 (38.5%) |
Occupancy by Educational Attainment in Area Code 281
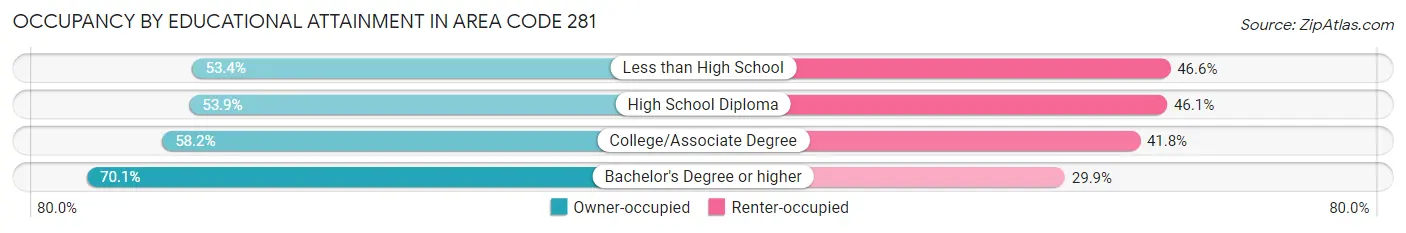
| Household Size | Owner-occupied | Renter-occupied |
| Less than High School | 101,926 (53.4%) | 89,107 (46.6%) |
| High School Diploma | 162,238 (53.9%) | 138,908 (46.1%) |
| College/Associate Degree | 271,645 (58.2%) | 195,395 (41.8%) |
| Bachelor's Degree or higher | 449,076 (70.1%) | 191,812 (29.9%) |
Occupancy by Age of Householder in Area Code 281
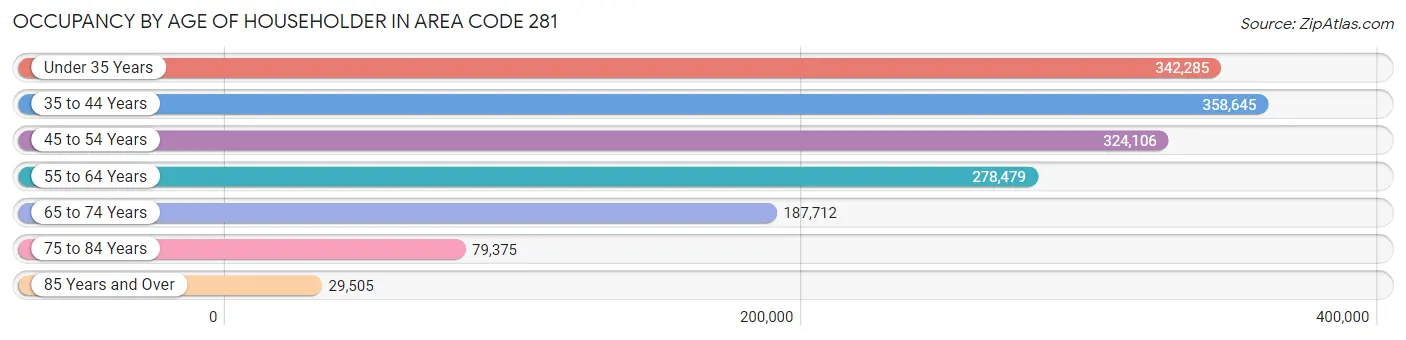
| Age Bracket | # Households | % Households |
| Under 35 Years | 342,285 | 21.4% |
| 35 to 44 Years | 358,645 | 22.4% |
| 45 to 54 Years | 324,106 | 20.3% |
| 55 to 64 Years | 278,479 | 17.4% |
| 65 to 74 Years | 187,712 | 11.7% |
| 75 to 84 Years | 79,375 | 5.0% |
| 85 Years and Over | 29,505 | 1.8% |
| Total | 1,600,107 | 100.0% |
Housing Finances in Area Code 281
Median Income by Occupancy in Area Code 281
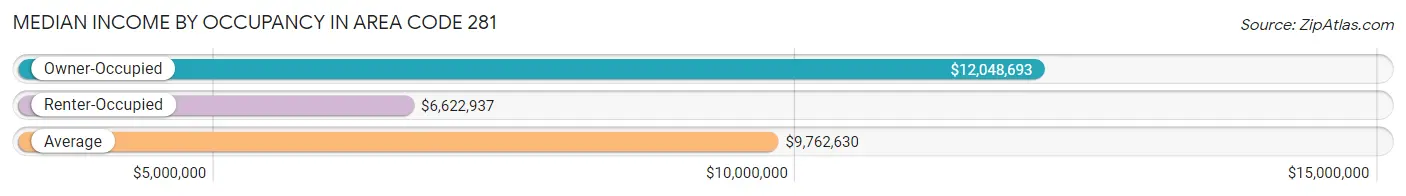
| Occupancy Type | # Households | Median Income |
| Owner-Occupied | 984,885 (61.6%) | $12,048,693 |
| Renter-Occupied | 615,222 (38.5%) | $6,622,937 |
| Average | 1,600,107 (100.0%) | $9,762,630 |
Occupancy by Householder Income Bracket in Area Code 281
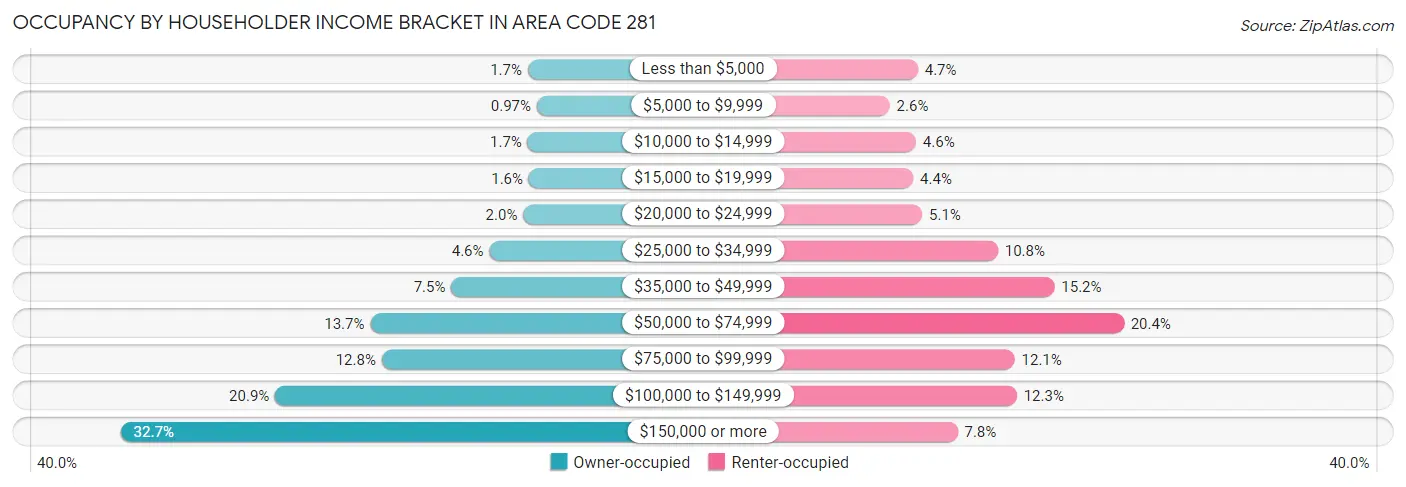
| Income Bracket | Owner-occupied | Renter-occupied |
| Less than $5,000 | 16,303 (1.7%) | 29,180 (4.7%) |
| $5,000 to $9,999 | 9,578 (1.0%) | 16,021 (2.6%) |
| $10,000 to $14,999 | 16,478 (1.7%) | 28,284 (4.6%) |
| $15,000 to $19,999 | 15,538 (1.6%) | 27,030 (4.4%) |
| $20,000 to $24,999 | 19,766 (2.0%) | 31,180 (5.1%) |
| $25,000 to $34,999 | 45,177 (4.6%) | 66,681 (10.8%) |
| $35,000 to $49,999 | 73,808 (7.5%) | 93,224 (15.1%) |
| $50,000 to $74,999 | 134,561 (13.7%) | 125,701 (20.4%) |
| $75,000 to $99,999 | 125,942 (12.8%) | 74,593 (12.1%) |
| $100,000 to $149,999 | 205,895 (20.9%) | 75,535 (12.3%) |
| $150,000 or more | 321,839 (32.7%) | 47,793 (7.8%) |
| Total | 984,885 (100.0%) | 615,222 (100.0%) |
Monthly Housing Cost Tiers in Area Code 281
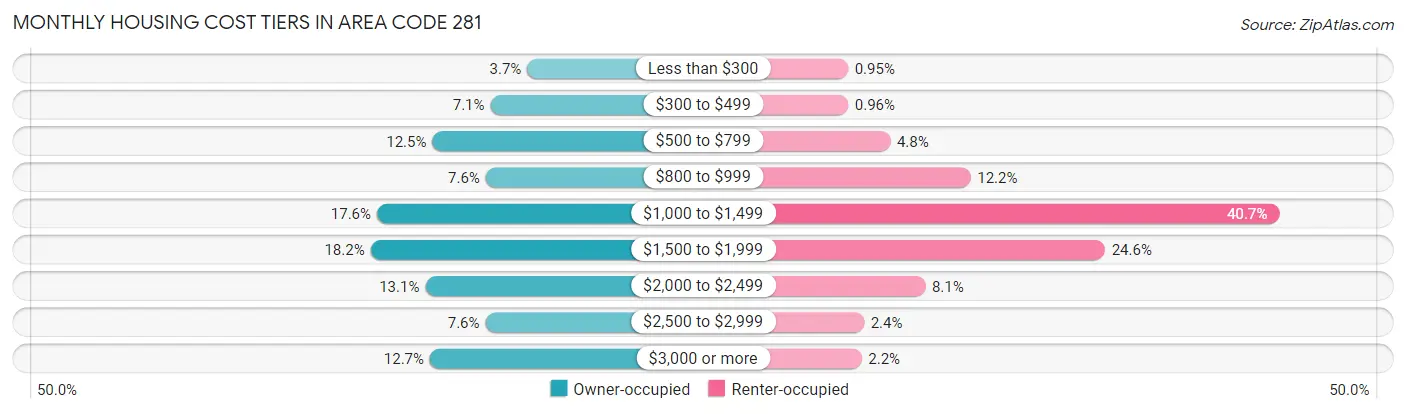
| Monthly Cost | Owner-occupied | Renter-occupied |
| Less than $300 | 36,748 (3.7%) | 5,830 (0.9%) |
| $300 to $499 | 70,151 (7.1%) | 5,910 (1.0%) |
| $500 to $799 | 122,847 (12.5%) | 29,795 (4.8%) |
| $800 to $999 | 74,378 (7.5%) | 75,226 (12.2%) |
| $1,000 to $1,499 | 173,026 (17.6%) | 250,232 (40.7%) |
| $1,500 to $1,999 | 178,849 (18.2%) | 151,414 (24.6%) |
| $2,000 to $2,499 | 129,176 (13.1%) | 49,559 (8.1%) |
| $2,500 to $2,999 | 74,684 (7.6%) | 14,879 (2.4%) |
| $3,000 or more | 125,026 (12.7%) | 13,563 (2.2%) |
| Total | 984,885 (100.0%) | 615,222 (100.0%) |
Physical Housing Characteristics in Area Code 281
Housing Structures in Area Code 281
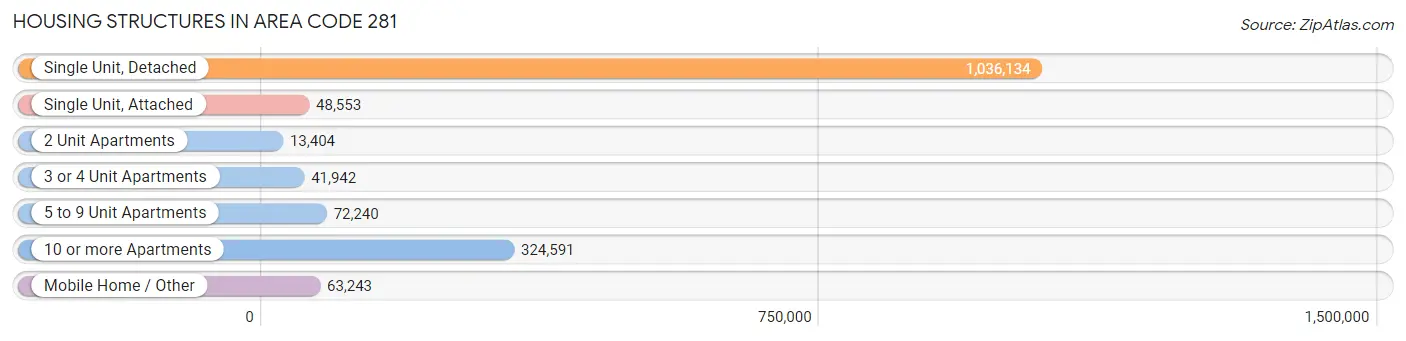
| Structure Type | # Housing Units | % Housing Units |
| Single Unit, Detached | 1,036,134 | 64.7% |
| Single Unit, Attached | 48,553 | 3.0% |
| 2 Unit Apartments | 13,404 | 0.8% |
| 3 or 4 Unit Apartments | 41,942 | 2.6% |
| 5 to 9 Unit Apartments | 72,240 | 4.5% |
| 10 or more Apartments | 324,591 | 20.3% |
| Mobile Home / Other | 63,243 | 4.0% |
| Total | 1,600,107 | 100.0% |
Housing Structures by Occupancy in Area Code 281
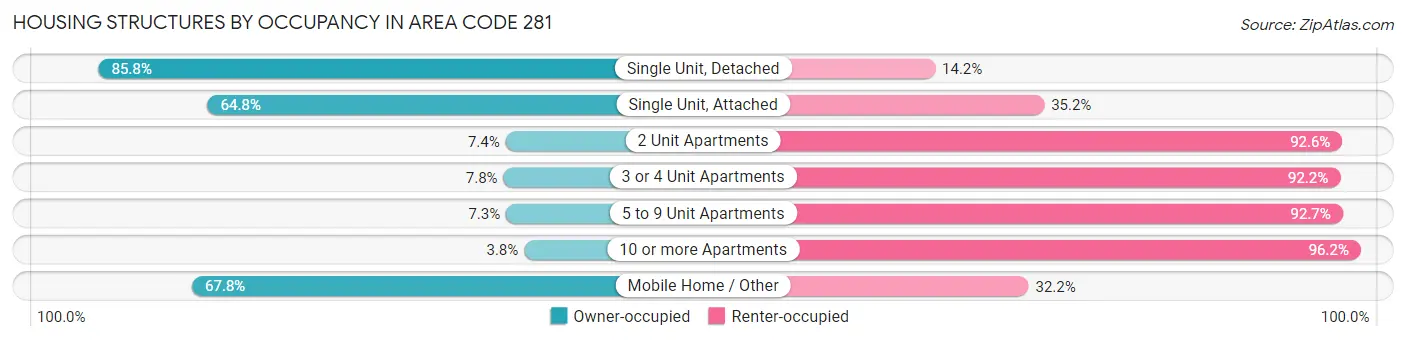
| Structure Type | Owner-occupied | Renter-occupied |
| Single Unit, Detached | 888,650 (85.8%) | 147,484 (14.2%) |
| Single Unit, Attached | 31,442 (64.8%) | 17,111 (35.2%) |
| 2 Unit Apartments | 990 (7.4%) | 12,414 (92.6%) |
| 3 or 4 Unit Apartments | 3,272 (7.8%) | 38,670 (92.2%) |
| 5 to 9 Unit Apartments | 5,280 (7.3%) | 66,960 (92.7%) |
| 10 or more Apartments | 12,389 (3.8%) | 312,202 (96.2%) |
| Mobile Home / Other | 42,862 (67.8%) | 20,381 (32.2%) |
| Total | 984,885 (61.6%) | 615,222 (38.5%) |
Housing Structures by Number of Rooms in Area Code 281
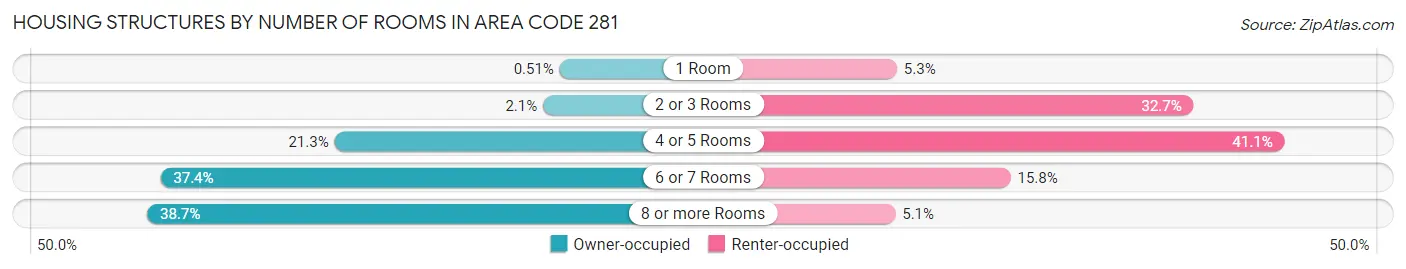
| Number of Rooms | Owner-occupied | Renter-occupied |
| 1 Room | 5,026 (0.5%) | 32,450 (5.3%) |
| 2 or 3 Rooms | 20,166 (2.1%) | 201,150 (32.7%) |
| 4 or 5 Rooms | 210,170 (21.3%) | 253,062 (41.1%) |
| 6 or 7 Rooms | 368,712 (37.4%) | 97,086 (15.8%) |
| 8 or more Rooms | 380,811 (38.7%) | 31,474 (5.1%) |
| Total | 984,885 (100.0%) | 615,222 (100.0%) |
Housing Structure by Heating Type in Area Code 281
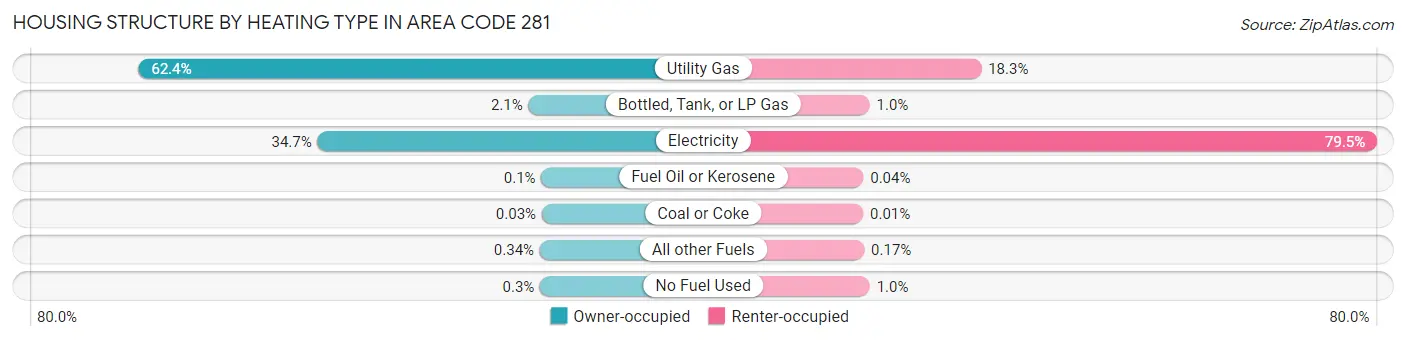
| Heating Type | Owner-occupied | Renter-occupied |
| Utility Gas | 614,782 (62.4%) | 112,386 (18.3%) |
| Bottled, Tank, or LP Gas | 20,653 (2.1%) | 6,199 (1.0%) |
| Electricity | 341,835 (34.7%) | 488,879 (79.5%) |
| Fuel Oil or Kerosene | 1,030 (0.1%) | 273 (0.0%) |
| Coal or Coke | 319 (0.0%) | 83 (0.0%) |
| All other Fuels | 3,318 (0.3%) | 1,052 (0.2%) |
| No Fuel Used | 2,948 (0.3%) | 6,350 (1.0%) |
| Total | 984,885 (100.0%) | 615,222 (100.0%) |
Household Vehicle Usage in Area Code 281
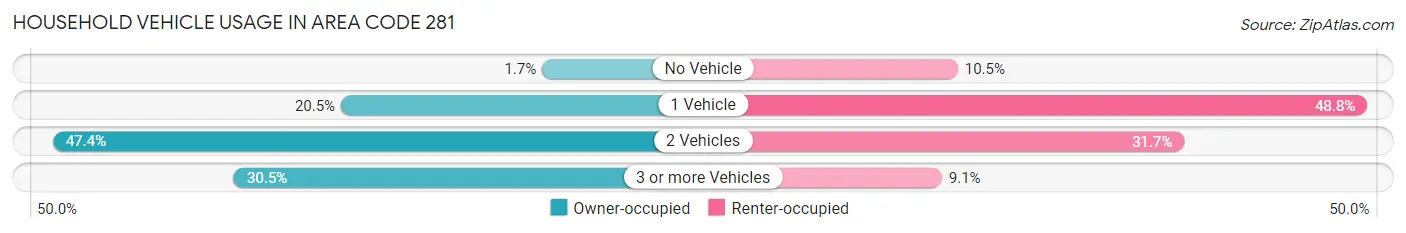
| Vehicles per Household | Owner-occupied | Renter-occupied |
| No Vehicle | 16,750 (1.7%) | 64,829 (10.5%) |
| 1 Vehicle | 201,629 (20.5%) | 299,890 (48.7%) |
| 2 Vehicles | 466,507 (47.4%) | 194,853 (31.7%) |
| 3 or more Vehicles | 299,999 (30.5%) | 55,650 (9.0%) |
| Total | 984,885 (100.0%) | 615,222 (100.0%) |
Real Estate & Mortgages in Area Code 281
Real Estate and Mortgage Overview in Area Code 281
| Characteristic | Without Mortgage | With Mortgage |
| Housing Units | 382,373 | 602,512 |
| Median Property Value | $28,588,300 | $33,525,800 |
| Median Household Income | $9,480,325 | $228,745 |
| Monthly Housing Costs | $86,134 | $118,211 |
| Real Estate Taxes | $428,528 | $24,145 |
Property Value by Mortgage Status in Area Code 281
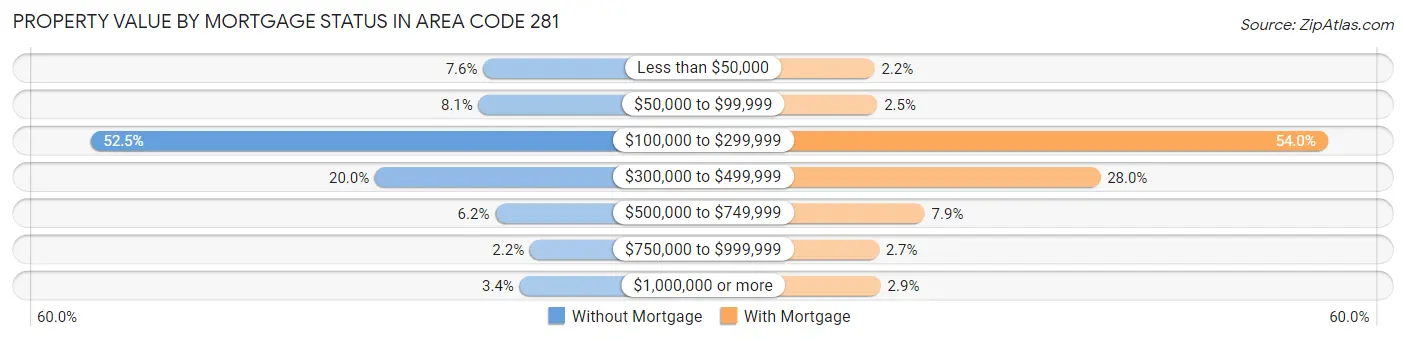
| Property Value | Without Mortgage | With Mortgage |
| Less than $50,000 | 28,970 (7.6%) | 13,044 (2.2%) |
| $50,000 to $99,999 | 31,012 (8.1%) | 14,947 (2.5%) |
| $100,000 to $299,999 | 200,681 (52.5%) | 325,172 (54.0%) |
| $300,000 to $499,999 | 76,286 (20.0%) | 168,465 (28.0%) |
| $500,000 to $749,999 | 23,758 (6.2%) | 47,593 (7.9%) |
| $750,000 to $999,999 | 8,574 (2.2%) | 15,990 (2.6%) |
| $1,000,000 or more | 13,092 (3.4%) | 17,301 (2.9%) |
| Total | 382,373 (100.0%) | 602,512 (100.0%) |
Household Income by Mortgage Status in Area Code 281
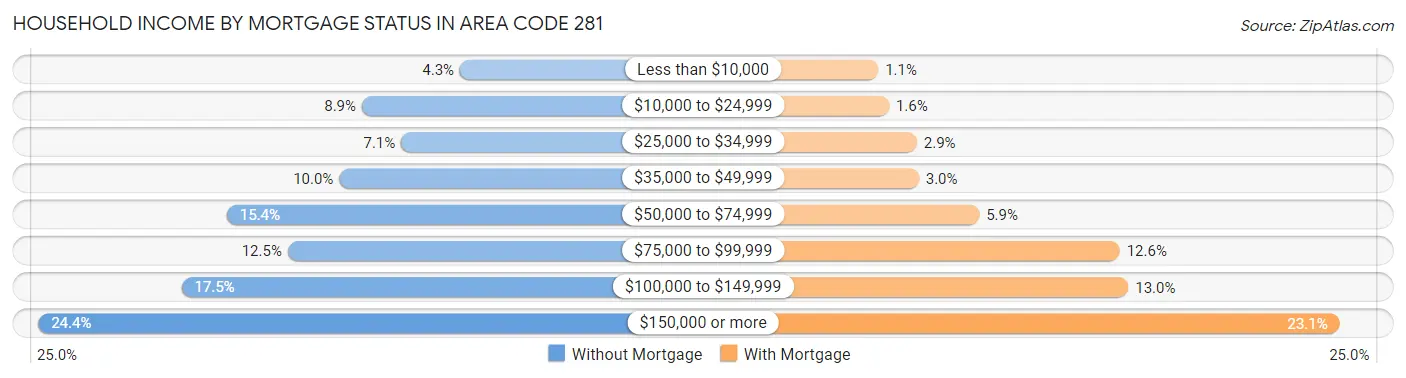
| Household Income | Without Mortgage | With Mortgage |
| Less than $10,000 | 16,316 (4.3%) | 6,480 (1.1%) |
| $10,000 to $24,999 | 34,175 (8.9%) | 9,565 (1.6%) |
| $25,000 to $34,999 | 27,043 (7.1%) | 17,607 (2.9%) |
| $35,000 to $49,999 | 38,304 (10.0%) | 18,134 (3.0%) |
| $50,000 to $74,999 | 58,759 (15.4%) | 35,504 (5.9%) |
| $75,000 to $99,999 | 47,669 (12.5%) | 75,802 (12.6%) |
| $100,000 to $149,999 | 67,013 (17.5%) | 78,273 (13.0%) |
| $150,000 or more | 93,094 (24.3%) | 138,882 (23.1%) |
| Total | 382,373 (100.0%) | 602,512 (100.0%) |
Property Value to Household Income Ratio in Area Code 281
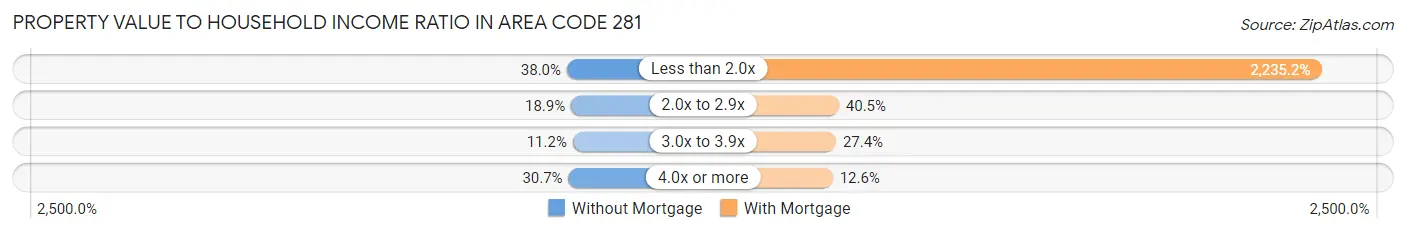
| Value-to-Income Ratio | Without Mortgage | With Mortgage |
| Less than 2.0x | 145,353 (38.0%) | 13,467,052 (2,235.2%) |
| 2.0x to 2.9x | 72,192 (18.9%) | 243,907 (40.5%) |
| 3.0x to 3.9x | 42,804 (11.2%) | 164,775 (27.4%) |
| 4.0x or more | 117,485 (30.7%) | 76,056 (12.6%) |
| Total | 382,373 (100.0%) | 602,512 (100.0%) |
Real Estate Taxes by Mortgage Status in Area Code 281
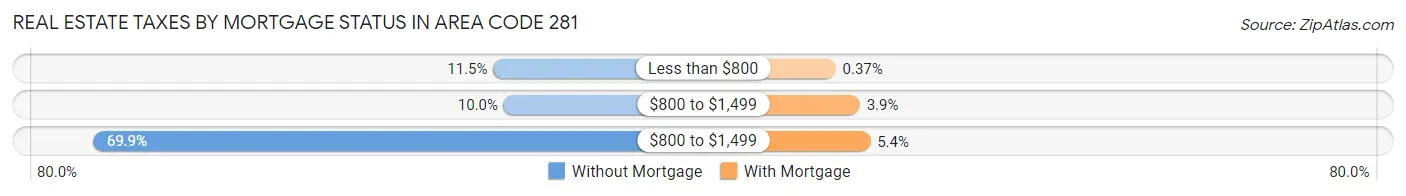
| Property Taxes | Without Mortgage | With Mortgage |
| Less than $800 | 44,014 (11.5%) | 2,213 (0.4%) |
| $800 to $1,499 | 38,163 (10.0%) | 23,512 (3.9%) |
| $800 to $1,499 | 267,198 (69.9%) | 32,733 (5.4%) |
| Total | 382,373 (100.0%) | 602,512 (100.0%) |
Health & Disability in Area Code 281
Health Insurance Coverage by Age in Area Code 281
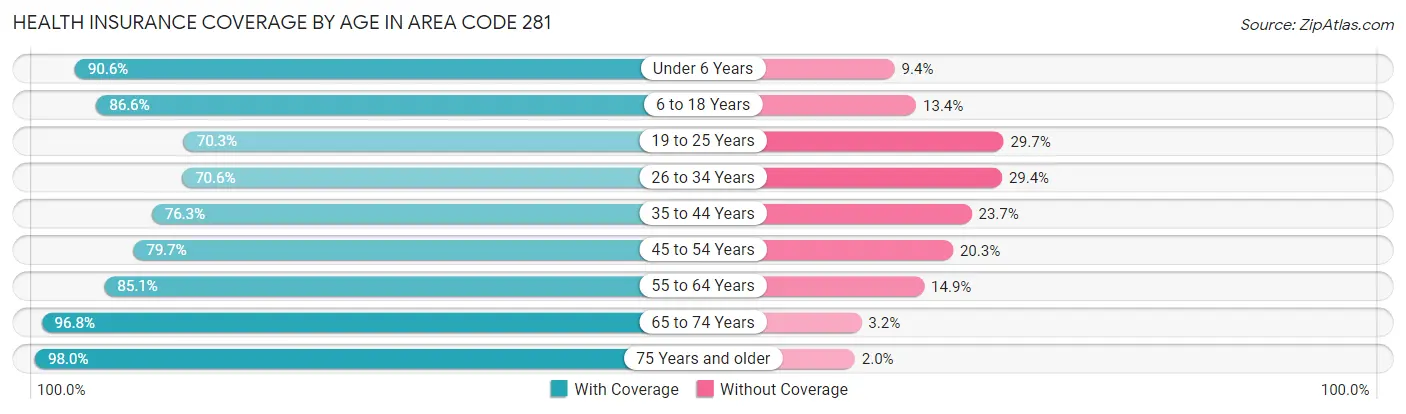
| Age Bracket | With Coverage | Without Coverage |
| Under 6 Years | 343,530 (90.6%) | 35,607 (9.4%) |
| 6 to 18 Years | 788,474 (86.6%) | 121,946 (13.4%) |
| 19 to 25 Years | 286,986 (70.3%) | 121,190 (29.7%) |
| 26 to 34 Years | 413,109 (70.6%) | 172,064 (29.4%) |
| 35 to 44 Years | 513,306 (76.3%) | 159,684 (23.7%) |
| 45 to 54 Years | 469,658 (79.7%) | 119,376 (20.3%) |
| 55 to 64 Years | 418,502 (85.1%) | 73,233 (14.9%) |
| 65 to 74 Years | 312,374 (96.8%) | 10,301 (3.2%) |
| 75 Years and older | 178,703 (98.0%) | 3,567 (2.0%) |
| Total | 3,724,642 (82.0%) | 816,968 (18.0%) |
Health Insurance Coverage by Citizenship Status in Area Code 281
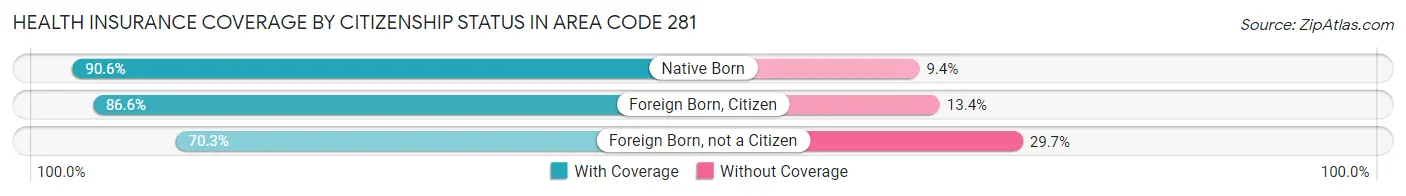
| Citizenship Status | With Coverage | Without Coverage |
| Native Born | 343,530 (90.6%) | 35,607 (9.4%) |
| Foreign Born, Citizen | 788,474 (86.6%) | 121,946 (13.4%) |
| Foreign Born, not a Citizen | 286,986 (70.3%) | 121,190 (29.7%) |
Health Insurance Coverage by Household Income in Area Code 281
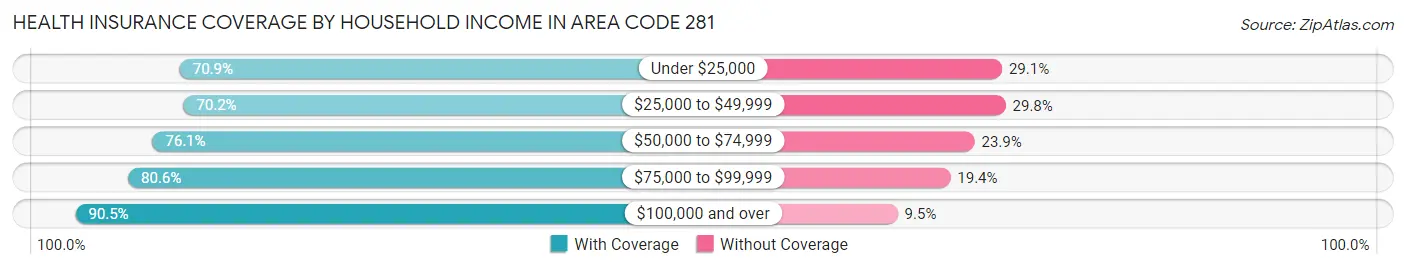
| Household Income | With Coverage | Without Coverage |
| Under $25,000 | 310,150 (70.9%) | 127,175 (29.1%) |
| $25,000 to $49,999 | 489,547 (70.2%) | 207,457 (29.8%) |
| $50,000 to $74,999 | 522,009 (76.1%) | 164,320 (23.9%) |
| $75,000 to $99,999 | 470,843 (80.6%) | 113,352 (19.4%) |
| $100,000 and over | 1,924,160 (90.5%) | 202,800 (9.5%) |
Public vs Private Health Insurance Coverage by Age in Area Code 281
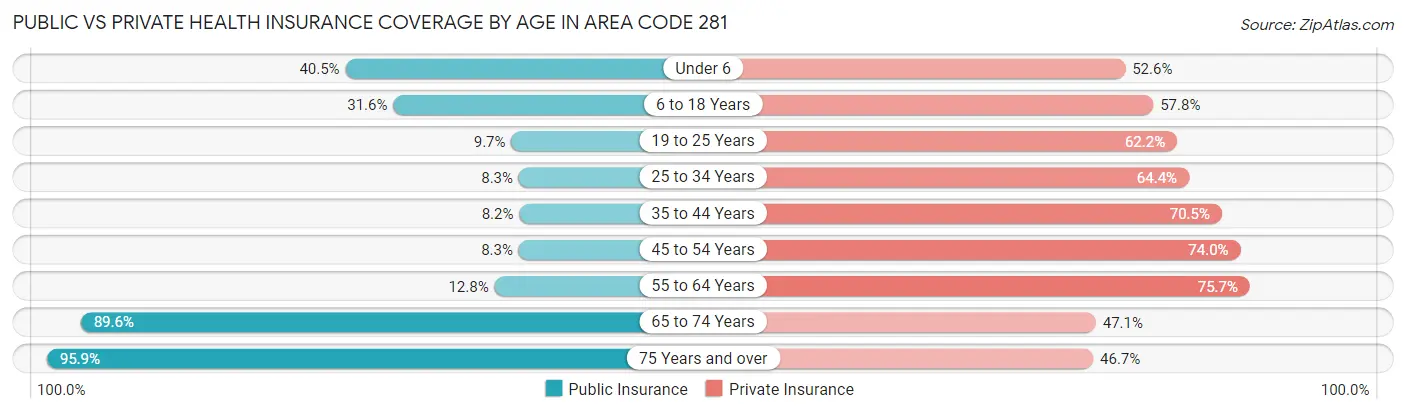
| Age Bracket | Public Insurance | Private Insurance |
| Under 6 | 153,358 (40.5%) | 199,450 (52.6%) |
| 6 to 18 Years | 287,338 (31.6%) | 526,340 (57.8%) |
| 19 to 25 Years | 39,387 (9.7%) | 253,941 (62.2%) |
| 25 to 34 Years | 48,358 (8.3%) | 376,987 (64.4%) |
| 35 to 44 Years | 55,083 (8.2%) | 474,568 (70.5%) |
| 45 to 54 Years | 48,723 (8.3%) | 435,777 (74.0%) |
| 55 to 64 Years | 62,866 (12.8%) | 372,369 (75.7%) |
| 65 to 74 Years | 289,063 (89.6%) | 152,105 (47.1%) |
| 75 Years and over | 174,738 (95.9%) | 85,031 (46.7%) |
| Total | 1,158,914 (25.5%) | 2,876,568 (63.3%) |
Disability Status by Sex by Age in Area Code 281
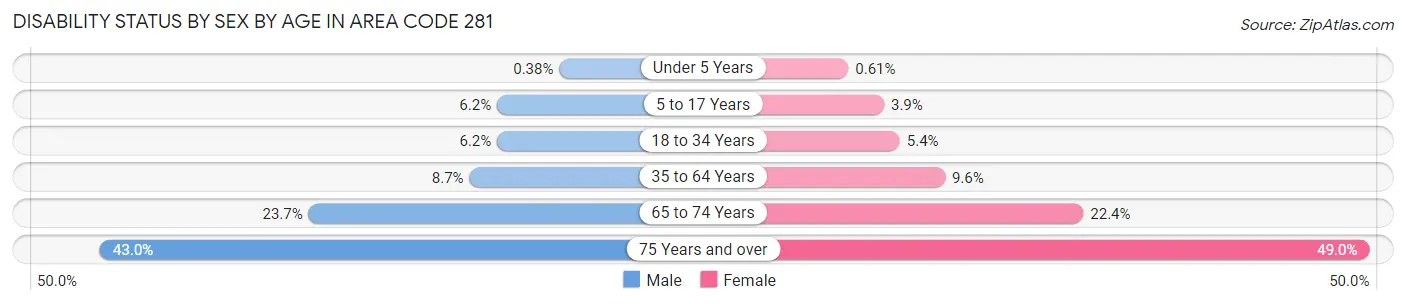
| Age Bracket | Male | Female |
| Under 5 Years | 597 (0.4%) | 938 (0.6%) |
| 5 to 17 Years | 28,797 (6.2%) | 17,505 (3.9%) |
| 18 to 34 Years | 32,866 (6.1%) | 28,191 (5.4%) |
| 35 to 64 Years | 76,152 (8.7%) | 84,319 (9.6%) |
| 65 to 74 Years | 35,789 (23.6%) | 38,428 (22.4%) |
| 75 Years and over | 32,413 (43.0%) | 52,330 (48.9%) |
Disability Class by Sex by Age in Area Code 281
Disability Class: Hearing Difficulty
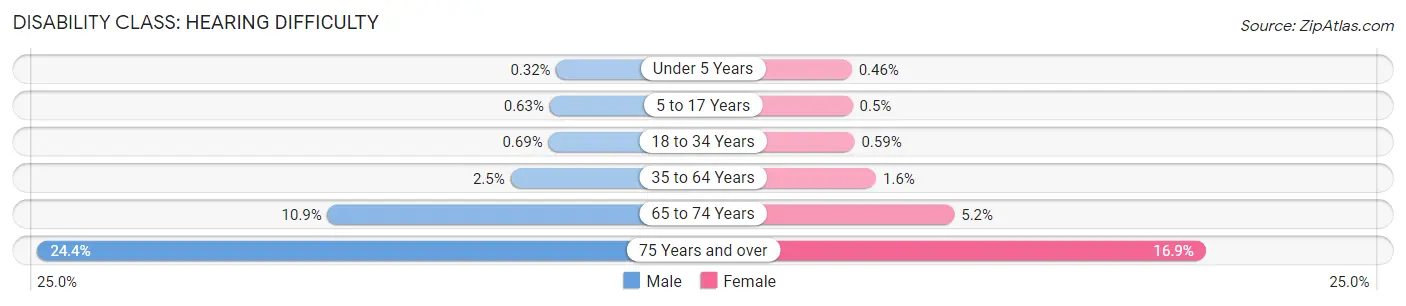
| Age Bracket | Male | Female |
| Under 5 Years | 498 (0.3%) | 715 (0.5%) |
| 5 to 17 Years | 2,952 (0.6%) | 2,252 (0.5%) |
| 18 to 34 Years | 3,703 (0.7%) | 3,076 (0.6%) |
| 35 to 64 Years | 21,354 (2.5%) | 13,956 (1.6%) |
| 65 to 74 Years | 16,551 (10.9%) | 8,941 (5.2%) |
| 75 Years and over | 18,400 (24.4%) | 18,050 (16.9%) |
Disability Class: Vision Difficulty
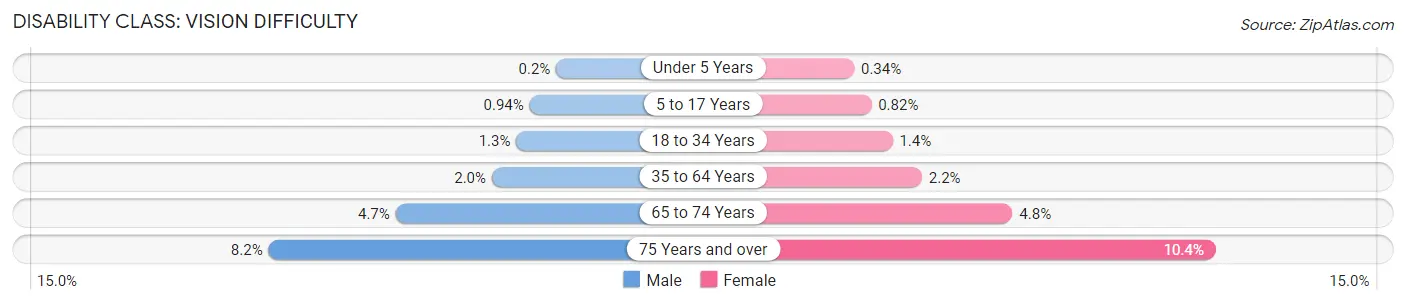
| Age Bracket | Male | Female |
| Under 5 Years | 316 (0.2%) | 527 (0.3%) |
| 5 to 17 Years | 4,399 (0.9%) | 3,643 (0.8%) |
| 18 to 34 Years | 7,006 (1.3%) | 7,382 (1.4%) |
| 35 to 64 Years | 17,363 (2.0%) | 19,649 (2.2%) |
| 65 to 74 Years | 7,059 (4.7%) | 8,135 (4.8%) |
| 75 Years and over | 6,186 (8.2%) | 11,124 (10.4%) |
Disability Class: Cognitive Difficulty
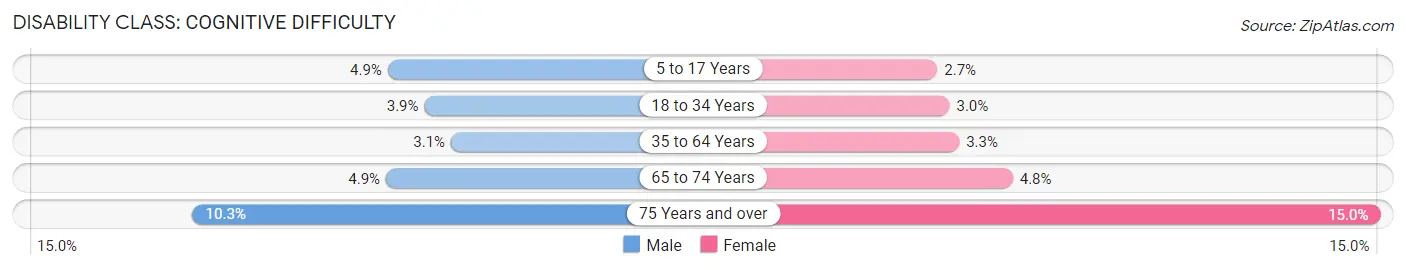
| Age Bracket | Male | Female |
| 5 to 17 Years | 22,843 (4.9%) | 11,866 (2.7%) |
| 18 to 34 Years | 20,703 (3.9%) | 15,687 (3.0%) |
| 35 to 64 Years | 27,308 (3.1%) | 28,777 (3.3%) |
| 65 to 74 Years | 7,470 (4.9%) | 8,159 (4.8%) |
| 75 Years and over | 7,777 (10.3%) | 16,027 (15.0%) |
Disability Class: Ambulatory Difficulty
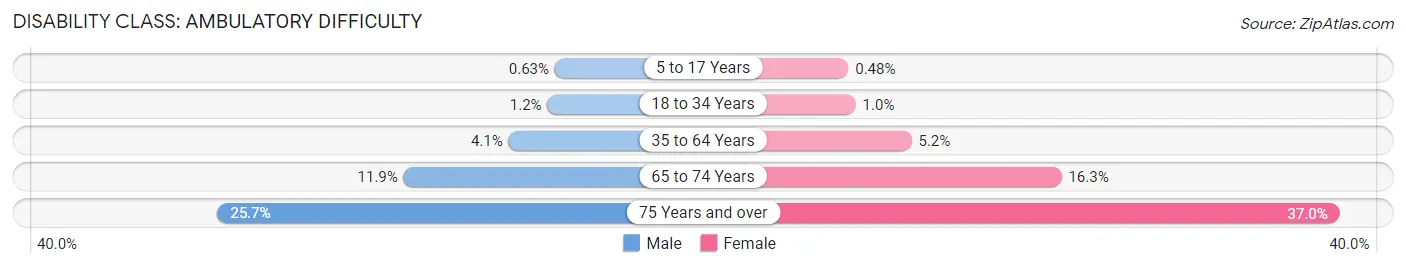
| Age Bracket | Male | Female |
| 5 to 17 Years | 2,936 (0.6%) | 2,127 (0.5%) |
| 18 to 34 Years | 6,303 (1.2%) | 5,366 (1.0%) |
| 35 to 64 Years | 35,565 (4.1%) | 45,515 (5.2%) |
| 65 to 74 Years | 17,948 (11.9%) | 27,949 (16.3%) |
| 75 Years and over | 19,365 (25.7%) | 39,515 (37.0%) |
Disability Class: Self-Care Difficulty
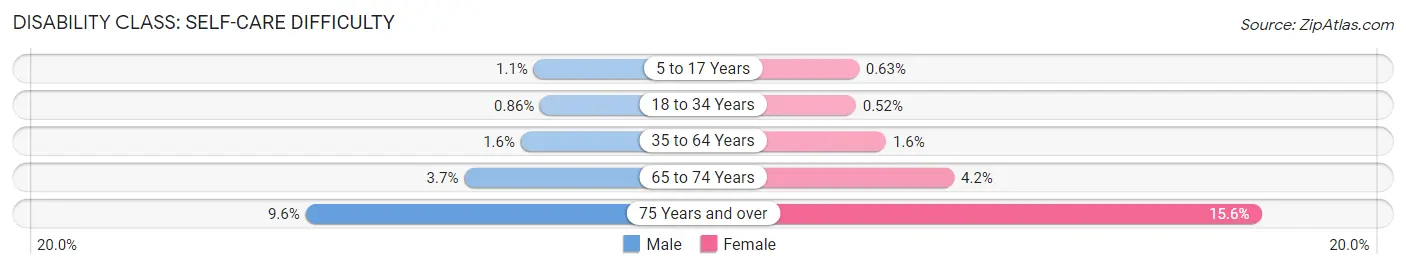
| Age Bracket | Male | Female |
| 5 to 17 Years | 5,145 (1.1%) | 2,829 (0.6%) |
| 18 to 34 Years | 4,575 (0.9%) | 2,743 (0.5%) |
| 35 to 64 Years | 13,770 (1.6%) | 14,399 (1.6%) |
| 65 to 74 Years | 5,573 (3.7%) | 7,151 (4.2%) |
| 75 Years and over | 7,216 (9.6%) | 16,642 (15.6%) |
Technology Access in Area Code 281
Computing Device Access in Area Code 281
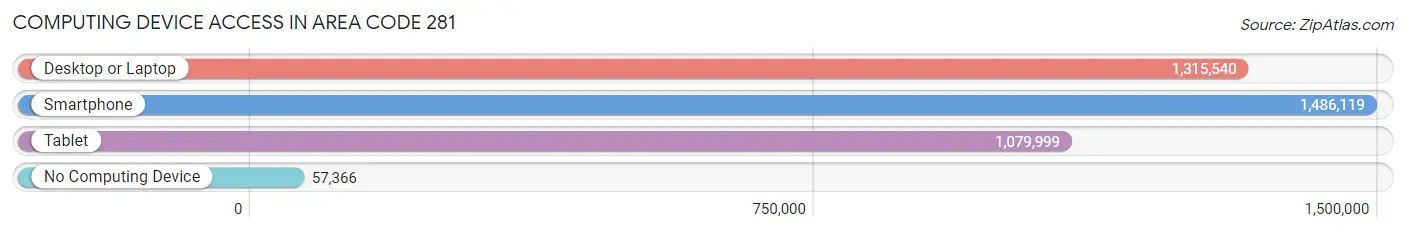
| Device Type | # Households | % Households |
| Desktop or Laptop | 1,315,540 | 82.2% |
| Smartphone | 1,486,119 | 92.9% |
| Tablet | 1,079,999 | 67.5% |
| No Computing Device | 57,366 | 3.6% |
| Total | 1,600,107 | 100.0% |
Internet Access in Area Code 281
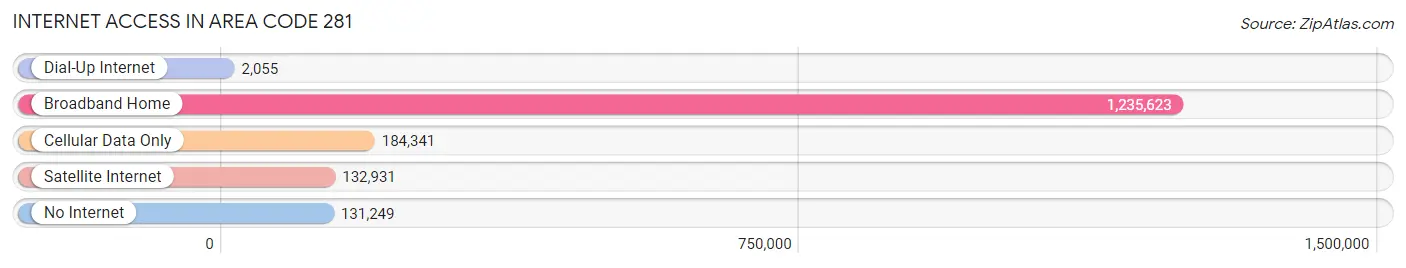
| Internet Type | # Households | % Households |
| Dial-Up Internet | 2,055 | 0.1% |
| Broadband Home | 1,235,623 | 77.2% |
| Cellular Data Only | 184,341 | 11.5% |
| Satellite Internet | 132,931 | 8.3% |
| No Internet | 131,249 | 8.2% |
| Total | 1,600,107 | 100.0% |
Area Code 281 Summary
Geography
Area code 281 is a telephone area code in the North American Numbering Plan (NANP) for the U.S. state of Texas. It was created on June 13, 1997, in a split from area code 713. It covers the Houston metropolitan area, including the cities of Houston, Baytown, Sugar Land, and The Woodlands.
Social
Area code 281 is a vibrant and diverse area, with a wide range of cultural and recreational activities. The area is home to many professional sports teams, including the Houston Astros, Houston Rockets, and Houston Texans. The area is also home to many museums, galleries, and other attractions, such as the Houston Museum of Natural Science, the Houston Zoo, and the Houston Space Center.
Economics
Area code 281 is an economically prosperous area, with a strong job market and a high median household income. The area is home to many major corporations, including ExxonMobil, Chevron, and Halliburton. The area is also home to many small businesses, including restaurants, retail stores, and service providers.
Demographics
Area code 281 is home to a diverse population, with a wide range of ethnicities and backgrounds. The area is home to a large Hispanic population, as well as a significant African American population. The area is also home to a large number of immigrants from around the world. The median age in the area is 33.5, and the median household income is $63,845.
Common Questions
What is Per Capita Income in Area Code 281?
Per Capita income in Area Code 281 is $42,543.
What is the Median Family Income in Area Code 281?
Median Family Income in Area Code 281 is $97,886.
What is the Median Household income in Area Code 281?
Median Household Income in Area Code 281 is $84,892.
What is Income or Wage Gap in Area Code 281?
Income or Wage Gap in Area Code 281 is 31.4%.
Women in Area Code 281 earn 68.6 cents for every dollar earned by a man.
What is Family Income Deficit in Area Code 281?
Family Income Deficit in Area Code 281 is $11,285.
Families that are below poverty line in Area Code 281 earn $11,285 less on average than the poverty threshold level.
What is Inequality or Gini Index in Area Code 281?
Inequality or Gini Index in Area Code 281 is 50.63.
What is the Total Population of Area Code 281?
Total Population of Area Code 281 is 4,574,961.
What is the Total Male Population of Area Code 281?
Total Male Population of Area Code 281 is 2,284,276.
What is the Total Female Population of Area Code 281?
Total Female Population of Area Code 281 is 2,290,685.
What is the Ratio of Males per 100 Females in Area Code 281?
There are 99.72 Males per 100 Females in Area Code 281.
What is the Ratio of Females per 100 Males in Area Code 281?
There are 100.28 Females per 100 Males in Area Code 281.
What is the Median Population Age in Area Code 281?
Median Population Age in Area Code 281 is 35.8 Years.
What is the Average Family Size in Area Code 281
Average Family Size in Area Code 281 is 3.3 People.
What is the Average Household Size in Area Code 281
Average Household Size in Area Code 281 is 2.8 People.
How Large is the Labor Force in Area Code 281?
There are 2,317,166 People in the Labor Forcein in Area Code 281.
What is the Percentage of People in the Labor Force in Area Code 281?
66.4% of People are in the Labor Force in Area Code 281.
What is the Unemployment Rate in Area Code 281?
Unemployment Rate in Area Code 281 is 6.0%.