Area Code 719 Map & Demographics
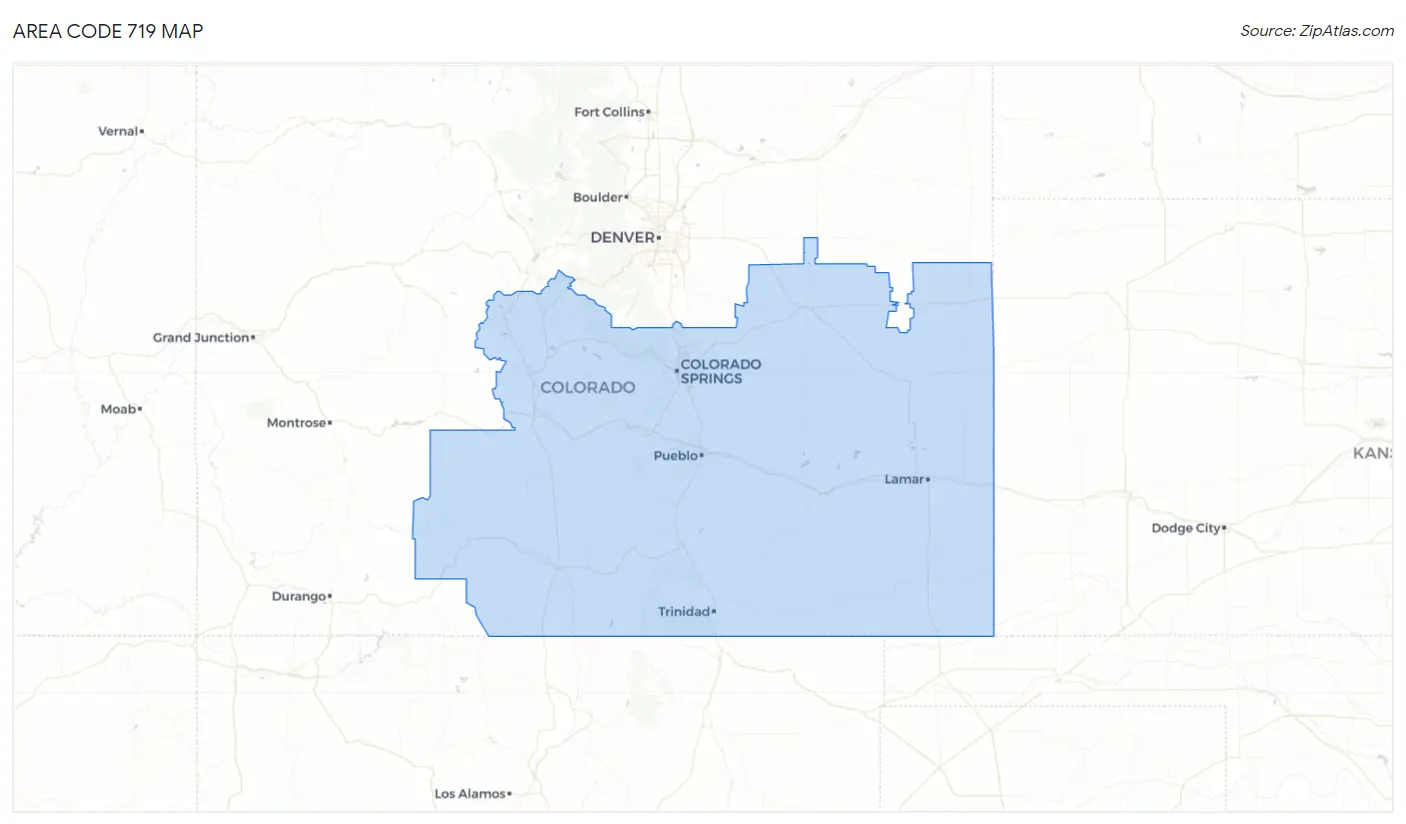
Area Code 719 Map
Area Code 719 Overview
$35,788
PER CAPITA INCOME
$80,128
AVG FAMILY INCOME
$64,755
AVG HOUSEHOLD INCOME
29.7%
WAGE / INCOME GAP [ % ]
70.3¢/ $1
WAGE / INCOME GAP [ $ ]
$10,861
FAMILY INCOME DEFICIT
68.17
INEQUALITY / GINI INDEX
1,170,409
TOTAL POPULATION
599,929
MALE POPULATION
570,480
FEMALE POPULATION
105.16
MALES / 100 FEMALES
95.09
FEMALES / 100 MALES
44.8
MEDIAN AGE
2.9
AVG FAMILY SIZE
2.4
AVG HOUSEHOLD SIZE
539,260
LABOR FORCE [ PEOPLE ]
57.5%
PERCENT IN LABOR FORCE
6.2%
UNEMPLOYMENT RATE
Income in Area Code 719
Income Overview in Area Code 719
Per Capita Income in Area Code 719 is $35,788, while median incomes of families and households are $80,128 and $64,755 respectively.
| Characteristic | Number | Measure |
| Per Capita Income | 1,170,409 | $35,788 |
| Median Family Income | 297,622 | $80,128 |
| Mean Family Income | 297,622 | $15,675,083 |
| Median Household Income | 452,799 | $64,755 |
| Mean Household Income | 452,799 | $13,497,912 |
| Income Deficit | 297,622 | $10,861 |
| Wage / Income Gap (%) | 1,170,409 | 29.71% |
| Wage / Income Gap ($) | 1,170,409 | 70.29¢ per $1 |
| Gini / Inequality Index | 1,170,409 | 68.17 |
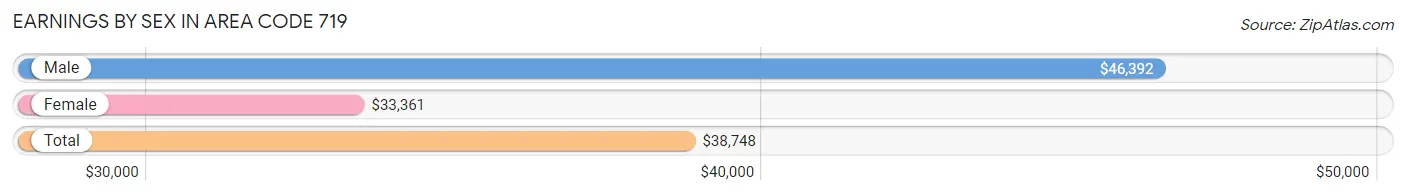
Earnings by Sex in Area Code 719
Average Earnings in Area Code 719 are $38,748, $46,392 for men and $33,361 for women, a difference of 28.1%.
| Sex | Number | Average Earnings |
| Male | 340,214 (54.9%) | $46,392 |
| Female | 279,520 (45.1%) | $33,361 |
| Total | 619,734 (100.0%) | $38,748 |
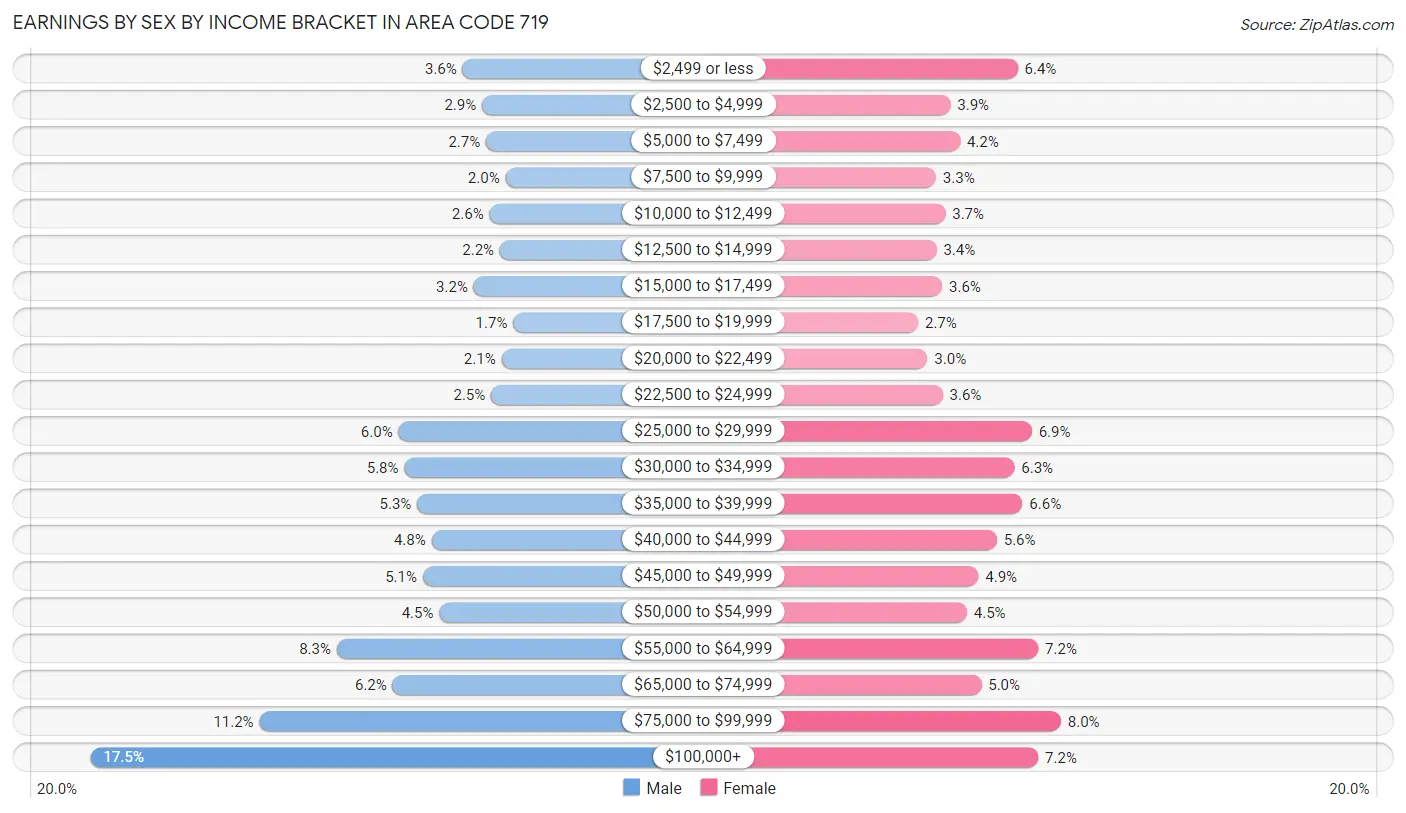
Earnings by Sex by Income Bracket in Area Code 719
The most common earnings brackets in Area Code 719 are $100,000+ for men (59,632 | 17.5%) and $75,000 to $99,999 for women (22,412 | 8.0%).
| Income | Male | Female |
| $2,499 or less | 12,211 (3.6%) | 17,891 (6.4%) |
| $2,500 to $4,999 | 9,729 (2.9%) | 10,852 (3.9%) |
| $5,000 to $7,499 | 9,218 (2.7%) | 11,841 (4.2%) |
| $7,500 to $9,999 | 6,740 (2.0%) | 9,342 (3.3%) |
| $10,000 to $12,499 | 8,781 (2.6%) | 10,316 (3.7%) |
| $12,500 to $14,999 | 7,449 (2.2%) | 9,378 (3.4%) |
| $15,000 to $17,499 | 10,801 (3.2%) | 9,989 (3.6%) |
| $17,500 to $19,999 | 5,753 (1.7%) | 7,461 (2.7%) |
| $20,000 to $22,499 | 7,239 (2.1%) | 8,433 (3.0%) |
| $22,500 to $24,999 | 8,558 (2.5%) | 10,044 (3.6%) |
| $25,000 to $29,999 | 20,391 (6.0%) | 19,365 (6.9%) |
| $30,000 to $34,999 | 19,620 (5.8%) | 17,559 (6.3%) |
| $35,000 to $39,999 | 17,989 (5.3%) | 18,406 (6.6%) |
| $40,000 to $44,999 | 16,169 (4.8%) | 15,709 (5.6%) |
| $45,000 to $49,999 | 17,284 (5.1%) | 13,768 (4.9%) |
| $50,000 to $54,999 | 15,166 (4.5%) | 12,576 (4.5%) |
| $55,000 to $64,999 | 28,248 (8.3%) | 20,054 (7.2%) |
| $65,000 to $74,999 | 21,142 (6.2%) | 14,081 (5.0%) |
| $75,000 to $99,999 | 38,094 (11.2%) | 22,412 (8.0%) |
| $100,000+ | 59,632 (17.5%) | 20,043 (7.2%) |
| Total | 340,214 (100.0%) | 279,520 (100.0%) |
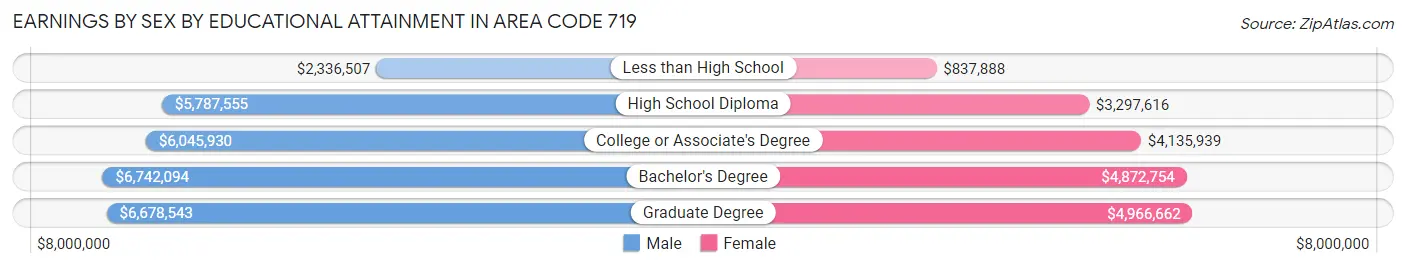
Earnings by Sex by Educational Attainment in Area Code 719
Average earnings in Area Code 719 are $7,540,987 for men and $5,448,648 for women, a difference of 27.8%. Men with an educational attainment of bachelor's degree enjoy the highest average annual earnings of $6,742,094, while those with less than high school education earn the least with $2,336,507. Women with an educational attainment of graduate degree earn the most with the average annual earnings of $4,966,662, while those with less than high school education have the smallest earnings of $837,888.
| Educational Attainment | Male Income | Female Income |
| Less than High School | $2,336,507 | $837,888 |
| High School Diploma | $5,787,555 | $3,297,616 |
| College or Associate's Degree | $6,045,930 | $4,135,939 |
| Bachelor's Degree | $6,742,094 | $4,872,754 |
| Graduate Degree | $6,678,543 | $4,966,662 |
| Total | $7,540,987 | $5,448,648 |
Family Income in Area Code 719
Family Income Brackets in Area Code 719
According to the Area Code 719 family income data, there are 9,278,663 families falling into the $100,000 to $149,999 income range, which is the most common income bracket and makes up 3,117.6% of all families. Conversely, the $10,000 to $14,999 income bracket is the least frequent group with only 1,159,535 families (389.6%) belonging to this category.
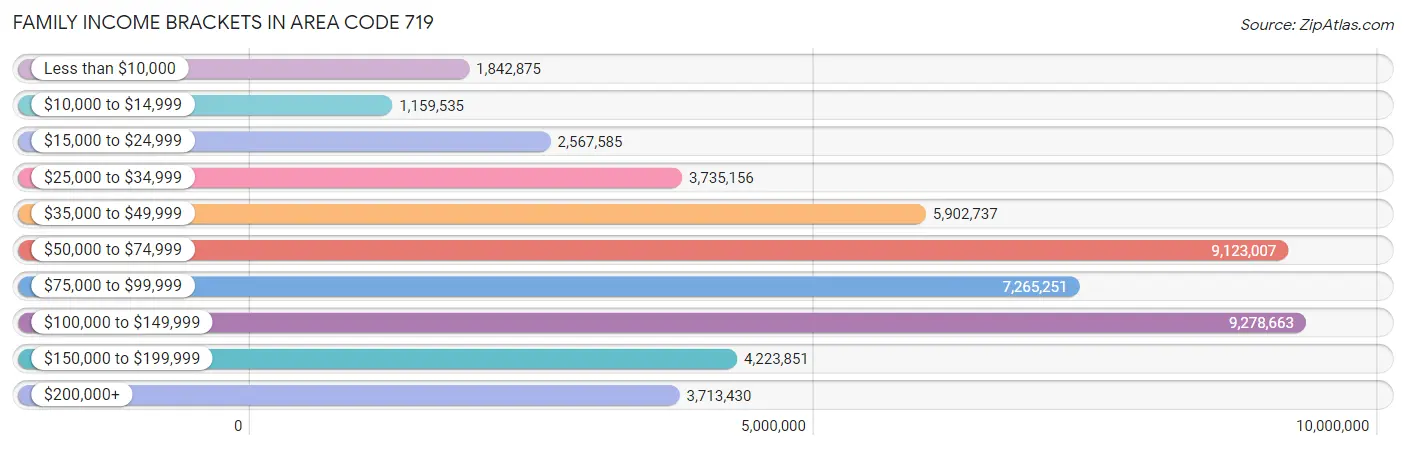
| Income Bracket | # Families | % Families |
| Less than $10,000 | 1,842,875 | 619.2% |
| $10,000 to $14,999 | 1,159,535 | 389.6% |
| $15,000 to $24,999 | 2,567,585 | 862.7% |
| $25,000 to $34,999 | 3,735,156 | 1,255.0% |
| $35,000 to $49,999 | 5,902,737 | 1,983.3% |
| $50,000 to $74,999 | 9,123,007 | 3,065.3% |
| $75,000 to $99,999 | 7,265,251 | 2,441.1% |
| $100,000 to $149,999 | 9,278,663 | 3,117.6% |
| $150,000 to $199,999 | 4,223,851 | 1,419.2% |
| $200,000+ | 3,713,430 | 1,247.7% |
Family Income by Famaliy Size in Area Code 719
7+ person families (5,160 | 1.7%) account for the highest median family income in Area Code 719 with $117,947 per family, while 2-person families (147,284 | 49.5%) have the highest median income of $37,277 per family member.
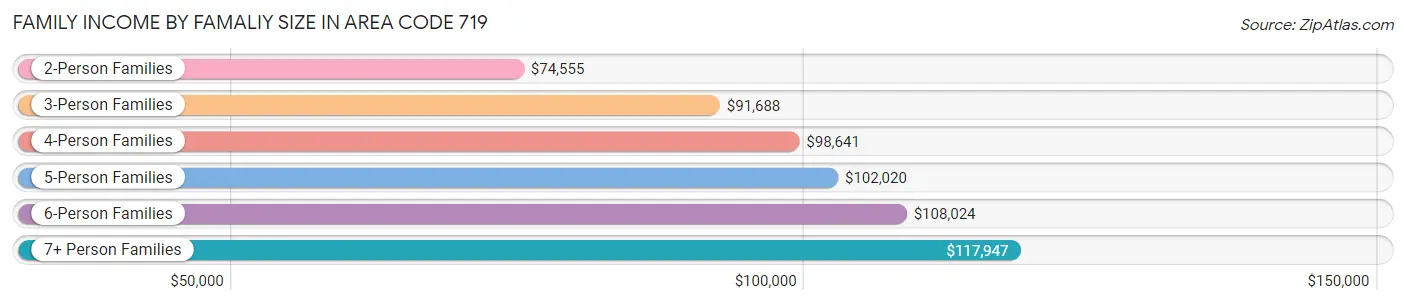
| Income Bracket | # Families | Median Income |
| 2-Person Families | 147,284 (49.5%) | $74,555 |
| 3-Person Families | 62,821 (21.1%) | $91,688 |
| 4-Person Families | 50,002 (16.8%) | $98,641 |
| 5-Person Families | 23,967 (8.1%) | $102,020 |
| 6-Person Families | 8,388 (2.8%) | $108,024 |
| 7+ Person Families | 5,160 (1.7%) | $117,947 |
| Total | 297,622 (100.0%) | $80,128 |
Family Income by Number of Earners in Area Code 719
The median family income in Area Code 719 is $80,128, with families comprising 3+ earners (30,005) having the highest median family income of $140,466, while families with no earners (45,488) have the lowest median family income of $53,571, accounting for 10.1% and 15.3% of families, respectively.
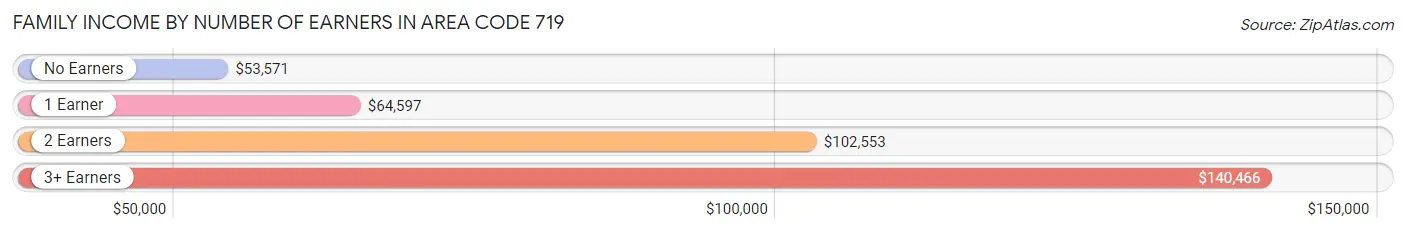
| Number of Earners | # Families | Median Income |
| No Earners | 45,488 (15.3%) | $53,571 |
| 1 Earner | 95,710 (32.2%) | $64,597 |
| 2 Earners | 126,419 (42.5%) | $102,553 |
| 3+ Earners | 30,005 (10.1%) | $140,466 |
| Total | 297,622 (100.0%) | $80,128 |
Household Income in Area Code 719
Household Income Brackets in Area Code 719
With 13,113,512 households falling in the category, the $50,000 to $74,999 income range is the most frequent in Area Code 719, accounting for 2,896.1% of all households. In contrast, only 4,064,324 households (897.6%) fall into the less than $10,000 income bracket, making it the least populous group.
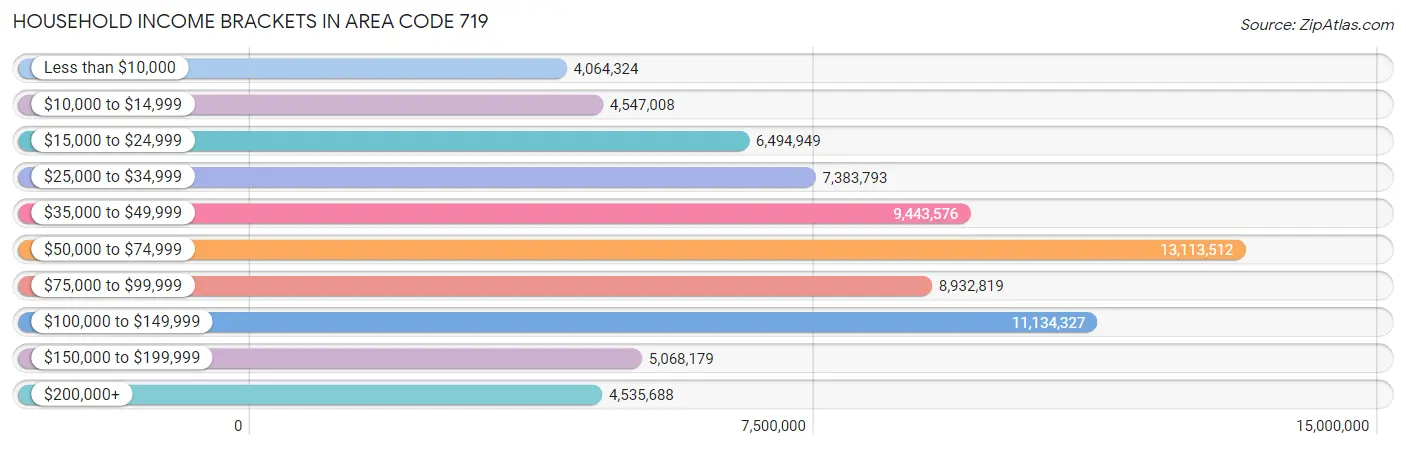
| Income Bracket | # Households | % Households |
| Less than $10,000 | 4,064,324 | 897.6% |
| $10,000 to $14,999 | 4,547,008 | 1,004.2% |
| $15,000 to $24,999 | 6,494,949 | 1,434.4% |
| $25,000 to $34,999 | 7,383,793 | 1,630.7% |
| $35,000 to $49,999 | 9,443,576 | 2,085.6% |
| $50,000 to $74,999 | 13,113,512 | 2,896.1% |
| $75,000 to $99,999 | 8,932,819 | 1,972.8% |
| $100,000 to $149,999 | 11,134,327 | 2,459.0% |
| $150,000 to $199,999 | 5,068,179 | 1,119.3% |
| $200,000+ | 4,535,688 | 1,001.7% |
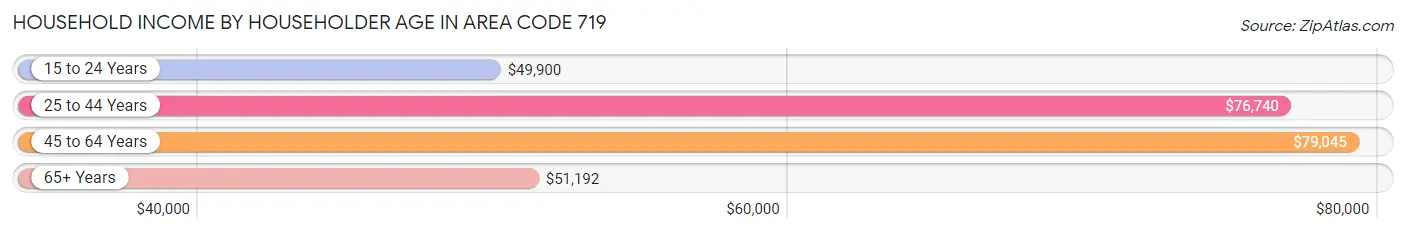
Household Income by Householder Age in Area Code 719
The median household income in Area Code 719 is $64,755, with the highest median household income of $79,045 found in the 45 to 64 years age bracket for the primary householder. A total of 159,840 households (35.3%) fall into this category. Meanwhile, the 15 to 24 years age bracket for the primary householder has the lowest median household income of $49,900, with 22,882 households (5.1%) in this group.
| Income Bracket | # Households | Median Income |
| 15 to 24 Years | 22,882 (5.1%) | $49,900 |
| 25 to 44 Years | 153,255 (33.9%) | $76,740 |
| 45 to 64 Years | 159,840 (35.3%) | $79,045 |
| 65+ Years | 116,822 (25.8%) | $51,192 |
| Total | 452,799 (100.0%) | $64,755 |
Poverty in Area Code 719
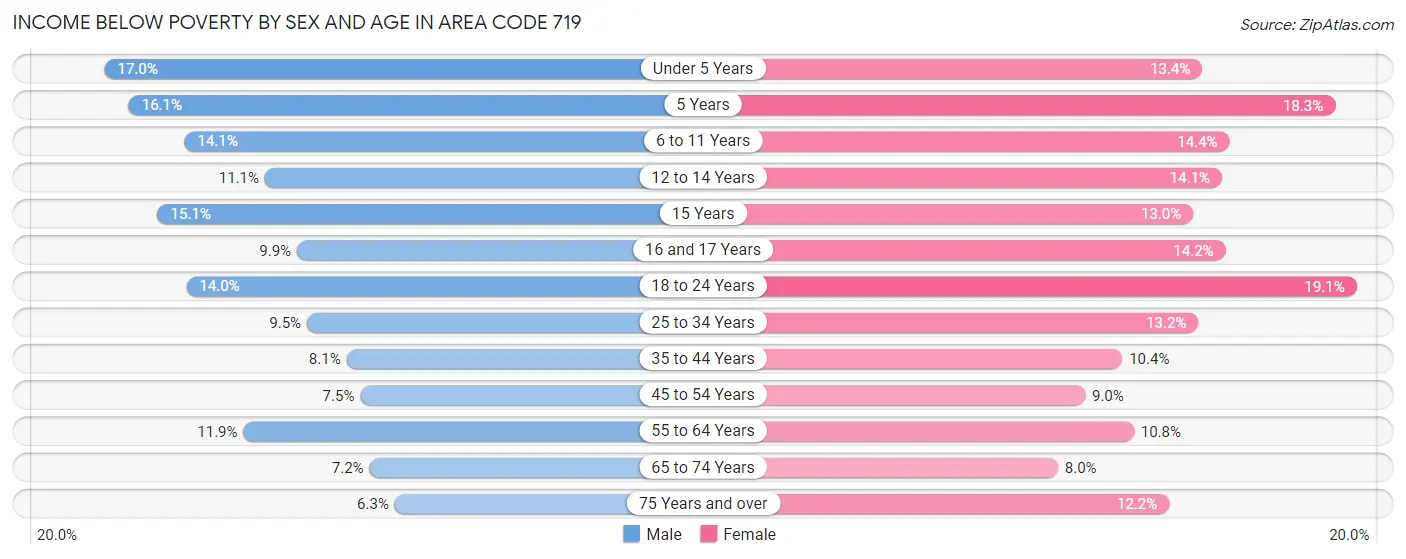
Income Below Poverty by Sex and Age in Area Code 719
With 10.4% poverty level for males and 12.1% for females among the residents of Area Code 719, under 5 year old males and 18 to 24 year old females are the most vulnerable to poverty, with 5,867 males (17.0%) and 8,819 females (19.1%) in their respective age groups living below the poverty level.
| Age Bracket | Male | Female |
| Under 5 Years | 5,867 (17.0%) | 4,344 (13.4%) |
| 5 Years | 1,055 (16.1%) | 1,252 (18.3%) |
| 6 to 11 Years | 6,320 (14.1%) | 6,191 (14.4%) |
| 12 to 14 Years | 2,486 (11.1%) | 3,008 (14.1%) |
| 15 Years | 1,221 (15.1%) | 1,075 (13.0%) |
| 16 and 17 Years | 1,509 (9.9%) | 1,953 (14.2%) |
| 18 to 24 Years | 7,320 (14.0%) | 8,819 (19.1%) |
| 25 to 34 Years | 8,206 (9.5%) | 10,369 (13.2%) |
| 35 to 44 Years | 6,075 (8.1%) | 7,471 (10.4%) |
| 45 to 54 Years | 4,993 (7.5%) | 5,876 (9.0%) |
| 55 to 64 Years | 8,399 (11.9%) | 8,195 (10.8%) |
| 65 to 74 Years | 3,958 (7.2%) | 4,741 (8.0%) |
| 75 Years and over | 1,861 (6.3%) | 4,700 (12.1%) |
| Total | 59,270 (10.4%) | 67,994 (12.1%) |
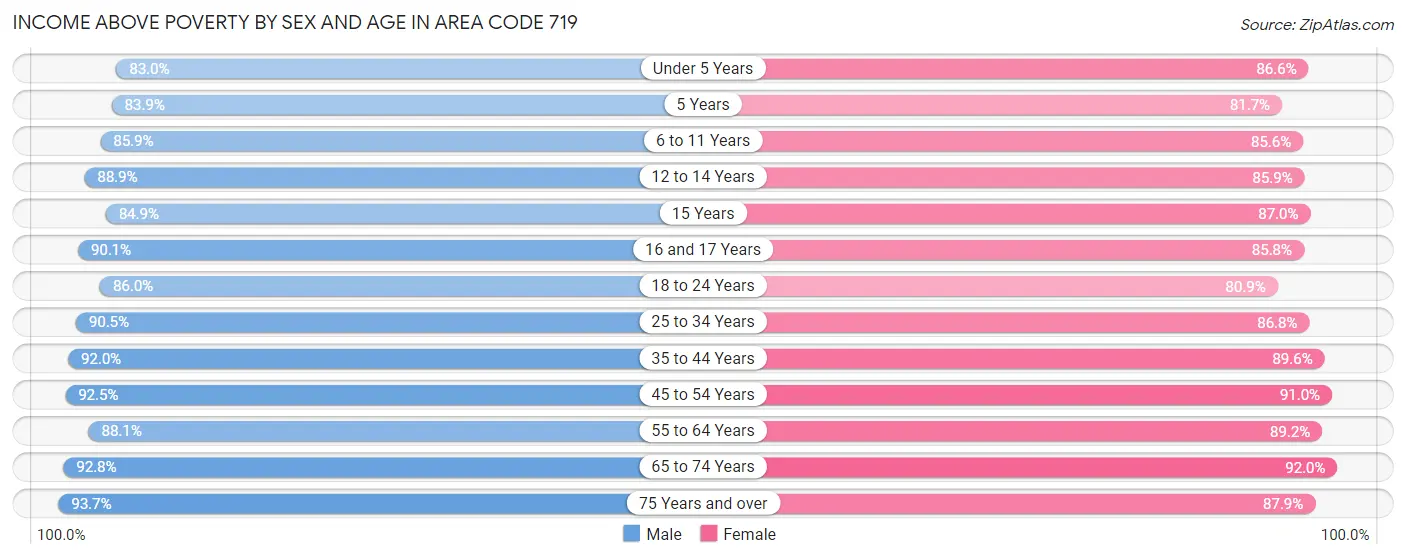
Income Above Poverty by Sex and Age in Area Code 719
According to the poverty statistics in Area Code 719, males aged 75 years and over and females aged 65 to 74 years are the age groups that are most secure financially, with 93.7% of males and 92.0% of females in these age groups living above the poverty line.
| Age Bracket | Male | Female |
| Under 5 Years | 28,590 (83.0%) | 28,119 (86.6%) |
| 5 Years | 5,484 (83.9%) | 5,587 (81.7%) |
| 6 to 11 Years | 38,623 (85.9%) | 36,818 (85.6%) |
| 12 to 14 Years | 19,959 (88.9%) | 18,308 (85.9%) |
| 15 Years | 6,885 (84.9%) | 7,170 (87.0%) |
| 16 and 17 Years | 13,755 (90.1%) | 11,763 (85.8%) |
| 18 to 24 Years | 45,015 (86.0%) | 37,326 (80.9%) |
| 25 to 34 Years | 78,013 (90.5%) | 67,988 (86.8%) |
| 35 to 44 Years | 69,349 (91.9%) | 64,301 (89.6%) |
| 45 to 54 Years | 61,257 (92.5%) | 59,231 (91.0%) |
| 55 to 64 Years | 62,274 (88.1%) | 67,379 (89.2%) |
| 65 to 74 Years | 51,006 (92.8%) | 54,375 (92.0%) |
| 75 Years and over | 27,860 (93.7%) | 33,992 (87.8%) |
| Total | 508,070 (89.5%) | 492,357 (87.9%) |
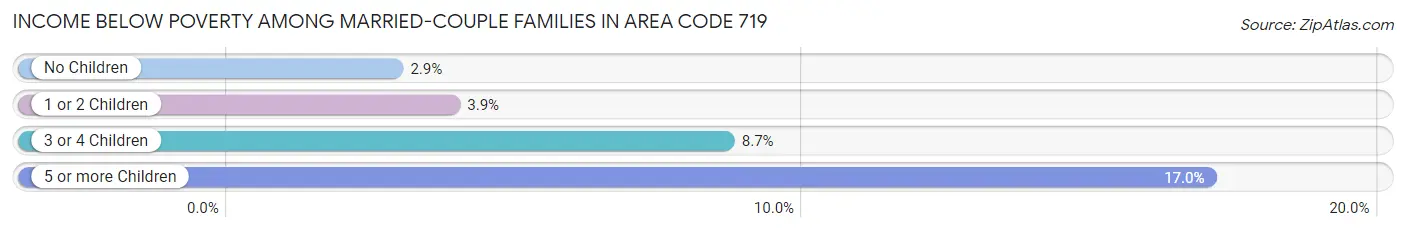
Income Below Poverty Among Married-Couple Families in Area Code 719
The poverty statistics for married-couple families in Area Code 719 show that 3.8% or 8,759 of the total 229,725 families live below the poverty line. Families with 5 or more children have the highest poverty rate of 17.0%, comprising of 378 families. On the other hand, families with no children have the lowest poverty rate of 2.9%, which includes 3,928 families.
| Children | Above Poverty | Below Poverty |
| No Children | 132,628 (97.1%) | 3,928 (2.9%) |
| 1 or 2 Children | 68,682 (96.1%) | 2,766 (3.9%) |
| 3 or 4 Children | 17,814 (91.3%) | 1,687 (8.6%) |
| 5 or more Children | 1,842 (83.0%) | 378 (17.0%) |
| Total | 220,966 (96.2%) | 8,759 (3.8%) |
Income Below Poverty Among Single-Parent Households in Area Code 719
According to the poverty data in Area Code 719, 12.5% or 2,817 single-father households and 24.3% or 11,019 single-mother households are living below the poverty line. Among single-father households, those with 5 or more children have the highest poverty rate, with 13 households (31.7%) experiencing poverty. Likewise, among single-mother households, those with 5 or more children have the highest poverty rate, with 348 households (59.1%) falling below the poverty line.
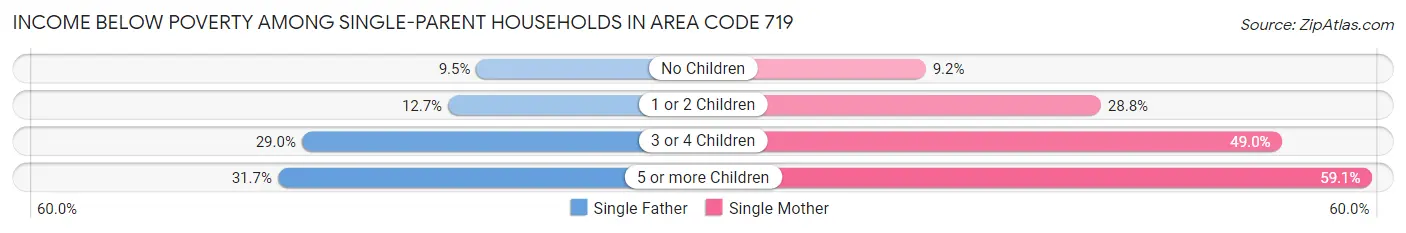
| Children | Single Father | Single Mother |
| No Children | 955 (9.5%) | 1,520 (9.2%) |
| 1 or 2 Children | 1,377 (12.7%) | 6,610 (28.7%) |
| 3 or 4 Children | 472 (29.0%) | 2,541 (49.0%) |
| 5 or more Children | 13 (31.7%) | 348 (59.1%) |
| Total | 2,817 (12.5%) | 11,019 (24.3%) |
Income Below Poverty Among Married-Couple vs Single-Parent Households in Area Code 719
The poverty data for Area Code 719 shows that 8,759 of the married-couple family households (3.8%) and 13,836 of the single-parent households (20.4%) are living below the poverty level. Within the married-couple family households, those with 5 or more children have the highest poverty rate, with 378 households (17.0%) falling below the poverty line. Among the single-parent households, those with 5 or more children have the highest poverty rate, with 361 household (57.3%) living below poverty.
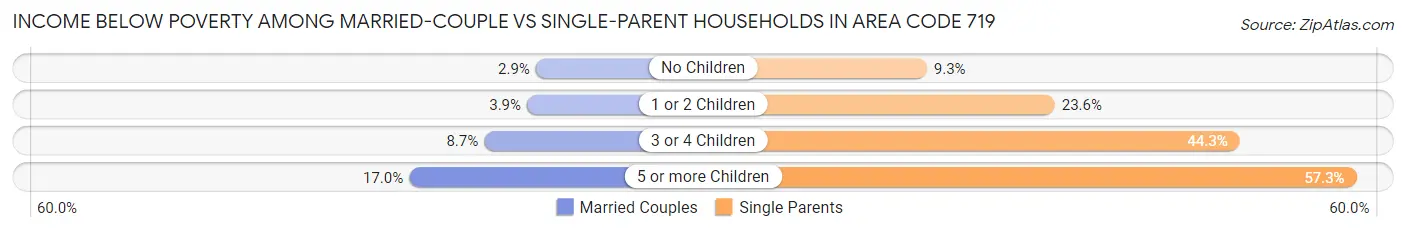
| Children | Married-Couple Families | Single-Parent Households |
| No Children | 3,928 (2.9%) | 2,475 (9.3%) |
| 1 or 2 Children | 2,766 (3.9%) | 7,987 (23.6%) |
| 3 or 4 Children | 1,687 (8.6%) | 3,013 (44.3%) |
| 5 or more Children | 378 (17.0%) | 361 (57.3%) |
| Total | 8,759 (3.8%) | 13,836 (20.4%) |
Race in Area Code 719
The most populous races in Area Code 719 are White / Caucasian (894,533 | 76.4%), Hispanic or Latino (271,097 | 23.2%), and Two or more Races (129,905 | 11.1%).
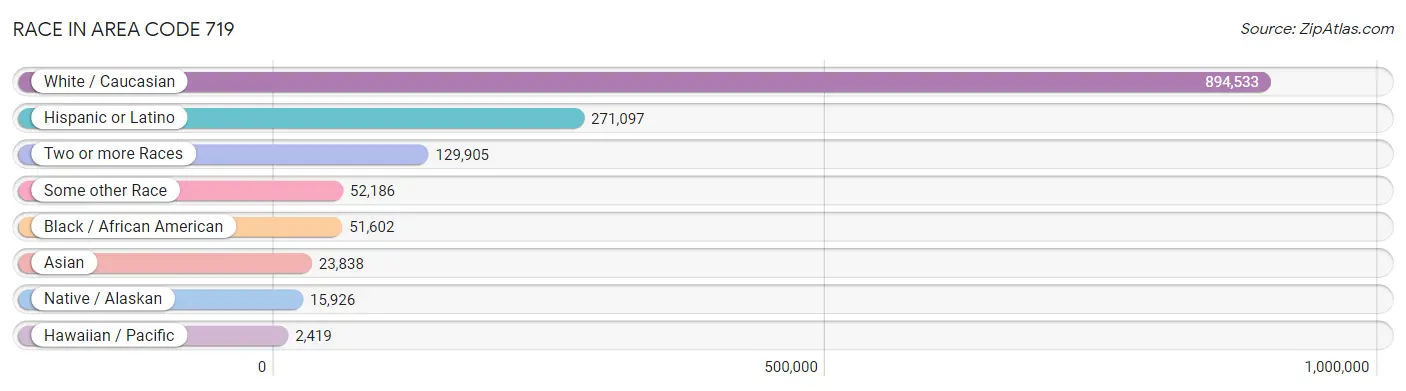
| Race | # Population | % Population |
| Asian | 23,838 | 2.0% |
| Black / African American | 51,602 | 4.4% |
| Hawaiian / Pacific | 2,419 | 0.2% |
| Hispanic or Latino | 271,097 | 23.2% |
| Native / Alaskan | 15,926 | 1.4% |
| White / Caucasian | 894,533 | 76.4% |
| Two or more Races | 129,905 | 11.1% |
| Some other Race | 52,186 | 4.5% |
| Total | 1,170,409 | 100.0% |
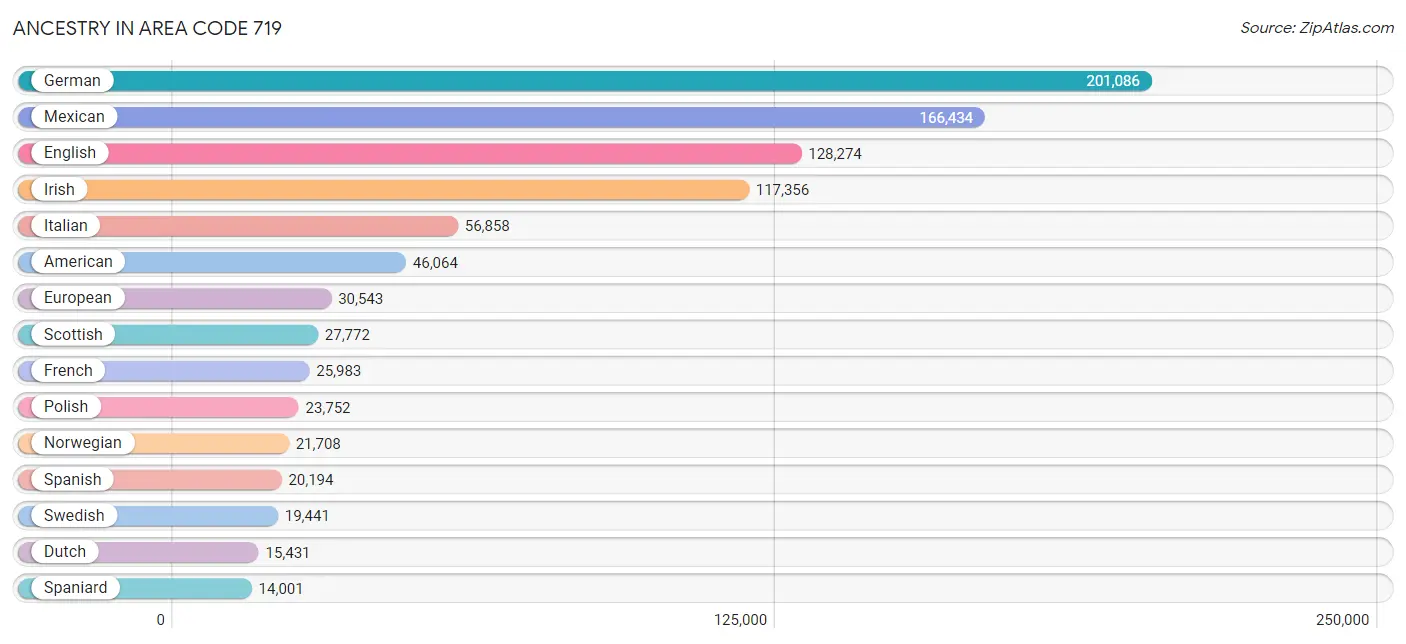
Ancestry in Area Code 719
The most populous ancestries reported in Area Code 719 are German (201,086 | 17.2%), Mexican (166,434 | 14.2%), English (128,274 | 11.0%), Irish (117,356 | 10.0%), and Italian (56,858 | 4.9%), together accounting for 57.3% of all Area Code 719 residents.
| Ancestry | # Population | % Population |
| Afghan | 77 | 0.0% |
| African | 4,028 | 0.3% |
| Alaska Native | 4 | 0.0% |
| Alaskan Athabascan | 95 | 0.0% |
| Albanian | 197 | 0.0% |
| Aleut | 66 | 0.0% |
| Alsatian | 34 | 0.0% |
| American | 46,064 | 3.9% |
| Apache | 4,122 | 0.4% |
| Arab | 2,496 | 0.2% |
| Arapaho | 78 | 0.0% |
| Argentinean | 752 | 0.1% |
| Armenian | 410 | 0.0% |
| Assyrian / Chaldean / Syriac | 11 | 0.0% |
| Australian | 383 | 0.0% |
| Austrian | 2,579 | 0.2% |
| Bangladeshi | 148 | 0.0% |
| Barbadian | 80 | 0.0% |
| Basque | 394 | 0.0% |
| Belgian | 838 | 0.1% |
| Belizean | 261 | 0.0% |
| Bermudan | 20 | 0.0% |
| Bhutanese | 5,768 | 0.5% |
| Blackfeet | 1,148 | 0.1% |
| Bolivian | 114 | 0.0% |
| Brazilian | 783 | 0.1% |
| British | 7,540 | 0.6% |
| British West Indian | 76 | 0.0% |
| Bulgarian | 211 | 0.0% |
| Burmese | 9,804 | 0.8% |
| Cajun | 244 | 0.0% |
| Cambodian | 164 | 0.0% |
| Canadian | 1,828 | 0.2% |
| Cape Verdean | 88 | 0.0% |
| Carpatho Rusyn | 88 | 0.0% |
| Celtic | 363 | 0.0% |
| Central American | 7,375 | 0.6% |
| Central American Indian | 1,287 | 0.1% |
| Cherokee | 7,117 | 0.6% |
| Cheyenne | 231 | 0.0% |
| Chickasaw | 516 | 0.0% |
| Chilean | 523 | 0.0% |
| Chinese | 42 | 0.0% |
| Chippewa | 682 | 0.1% |
| Choctaw | 1,091 | 0.1% |
| Colombian | 2,160 | 0.2% |
| Colville | 2 | 0.0% |
| Comanche | 448 | 0.0% |
| Costa Rican | 318 | 0.0% |
| Cree | 155 | 0.0% |
| Creek | 198 | 0.0% |
| Croatian | 960 | 0.1% |
| Crow | 68 | 0.0% |
| Cuban | 3,352 | 0.3% |
| Czech | 5,729 | 0.5% |
| Czechoslovakian | 1,012 | 0.1% |
| Danish | 6,626 | 0.6% |
| Delaware | 126 | 0.0% |
| Dominican | 1,325 | 0.1% |
| Dutch | 15,431 | 1.3% |
| Dutch West Indian | 42 | 0.0% |
| Eastern European | 2,879 | 0.3% |
| Ecuadorian | 718 | 0.1% |
| Egyptian | 149 | 0.0% |
| English | 128,274 | 11.0% |
| Estonian | 211 | 0.0% |
| Ethiopian | 343 | 0.0% |
| European | 30,543 | 2.6% |
| Fijian | 5 | 0.0% |
| Filipino | 266 | 0.0% |
| Finnish | 2,007 | 0.2% |
| French | 25,983 | 2.2% |
| French American Indian | 28 | 0.0% |
| French Canadian | 4,712 | 0.4% |
| German | 201,086 | 17.2% |
| German Russian | 228 | 0.0% |
| Ghanaian | 192 | 0.0% |
| Greek | 2,656 | 0.2% |
| Guamanian / Chamorro | 1,655 | 0.1% |
| Guatemalan | 1,606 | 0.1% |
| Guyanese | 71 | 0.0% |
| Haitian | 435 | 0.0% |
| Honduran | 1,543 | 0.1% |
| Hopi | 56 | 0.0% |
| Houma | 87 | 0.0% |
| Hungarian | 4,070 | 0.4% |
| Icelander | 419 | 0.0% |
| Indian (Asian) | 6,126 | 0.5% |
| Indonesian | 153 | 0.0% |
| Inupiat | 153 | 0.0% |
| Iranian | 670 | 0.1% |
| Iraqi | 170 | 0.0% |
| Irish | 117,356 | 10.0% |
| Iroquois | 414 | 0.0% |
| Israeli | 176 | 0.0% |
| Italian | 56,858 | 4.9% |
| Jamaican | 1,680 | 0.1% |
| Japanese | 91 | 0.0% |
| Jordanian | 51 | 0.0% |
| Kenyan | 197 | 0.0% |
| Kiowa | 78 | 0.0% |
| Korean | 11,761 | 1.0% |
| Laotian | 419 | 0.0% |
| Latvian | 185 | 0.0% |
| Lebanese | 1,114 | 0.1% |
| Liberian | 108 | 0.0% |
| Lithuanian | 2,104 | 0.2% |
| Lumbee | 15 | 0.0% |
| Luxembourger | 328 | 0.0% |
| Macedonian | 100 | 0.0% |
| Malaysian | 390 | 0.0% |
| Maltese | 65 | 0.0% |
| Menominee | 15 | 0.0% |
| Mexican | 166,434 | 14.2% |
| Mexican American Indian | 2,379 | 0.2% |
| Mongolian | 20 | 0.0% |
| Moroccan | 8 | 0.0% |
| Native Hawaiian | 2,896 | 0.3% |
| Navajo | 3,957 | 0.3% |
| New Zealander | 179 | 0.0% |
| Nicaraguan | 579 | 0.1% |
| Nigerian | 1,015 | 0.1% |
| Northern European | 2,715 | 0.2% |
| Norwegian | 21,708 | 1.8% |
| Okinawan | 73 | 0.0% |
| Osage | 148 | 0.0% |
| Ottawa | 8 | 0.0% |
| Paiute | 185 | 0.0% |
| Pakistani | 1,487 | 0.1% |
| Palestinian | 59 | 0.0% |
| Panamanian | 1,437 | 0.1% |
| Paraguayan | 1 | 0.0% |
| Pennsylvania German | 259 | 0.0% |
| Peruvian | 1,681 | 0.1% |
| Pima | 31 | 0.0% |
| Polish | 23,752 | 2.0% |
| Portuguese | 2,679 | 0.2% |
| Potawatomi | 320 | 0.0% |
| Pueblo | 737 | 0.1% |
| Puerto Rican | 13,316 | 1.1% |
| Puget Sound Salish | 28 | 0.0% |
| Romanian | 952 | 0.1% |
| Russian | 6,539 | 0.6% |
| Salvadoran | 1,755 | 0.2% |
| Samoan | 1,319 | 0.1% |
| Scandinavian | 5,324 | 0.4% |
| Scotch-Irish | 13,641 | 1.2% |
| Scottish | 27,772 | 2.4% |
| Seminole | 140 | 0.0% |
| Serbian | 812 | 0.1% |
| Shoshone | 14 | 0.0% |
| Sierra Leonean | 2 | 0.0% |
| Sioux | 1,407 | 0.1% |
| Slavic | 766 | 0.1% |
| Slovak | 1,916 | 0.2% |
| Slovene | 2,470 | 0.2% |
| Somali | 88 | 0.0% |
| South African | 188 | 0.0% |
| South American | 6,549 | 0.6% |
| South American Indian | 58 | 0.0% |
| Spaniard | 14,001 | 1.2% |
| Spanish | 20,194 | 1.7% |
| Spanish American | 2,263 | 0.2% |
| Spanish American Indian | 342 | 0.0% |
| Sri Lankan | 3,418 | 0.3% |
| Subsaharan African | 6,840 | 0.6% |
| Sudanese | 98 | 0.0% |
| Swedish | 19,441 | 1.7% |
| Swiss | 3,461 | 0.3% |
| Syrian | 180 | 0.0% |
| Thai | 3,004 | 0.3% |
| Tlingit-Haida | 150 | 0.0% |
| Tohono O'Odham | 131 | 0.0% |
| Tongan | 26 | 0.0% |
| Trinidadian and Tobagonian | 147 | 0.0% |
| Tsimshian | 9 | 0.0% |
| Turkish | 315 | 0.0% |
| U.S. Virgin Islander | 25 | 0.0% |
| Ugandan | 108 | 0.0% |
| Ukrainian | 2,125 | 0.2% |
| Uruguayan | 69 | 0.0% |
| Ute | 799 | 0.1% |
| Venezuelan | 486 | 0.0% |
| Vietnamese | 50 | 0.0% |
| Welsh | 8,636 | 0.7% |
| West Indian | 216 | 0.0% |
| Yakama | 134 | 0.0% |
| Yaqui | 59 | 0.0% |
| Yugoslavian | 763 | 0.1% |
| Yuman | 1 | 0.0% |
| Yup'ik | 41 | 0.0% | View All 191 Rows |
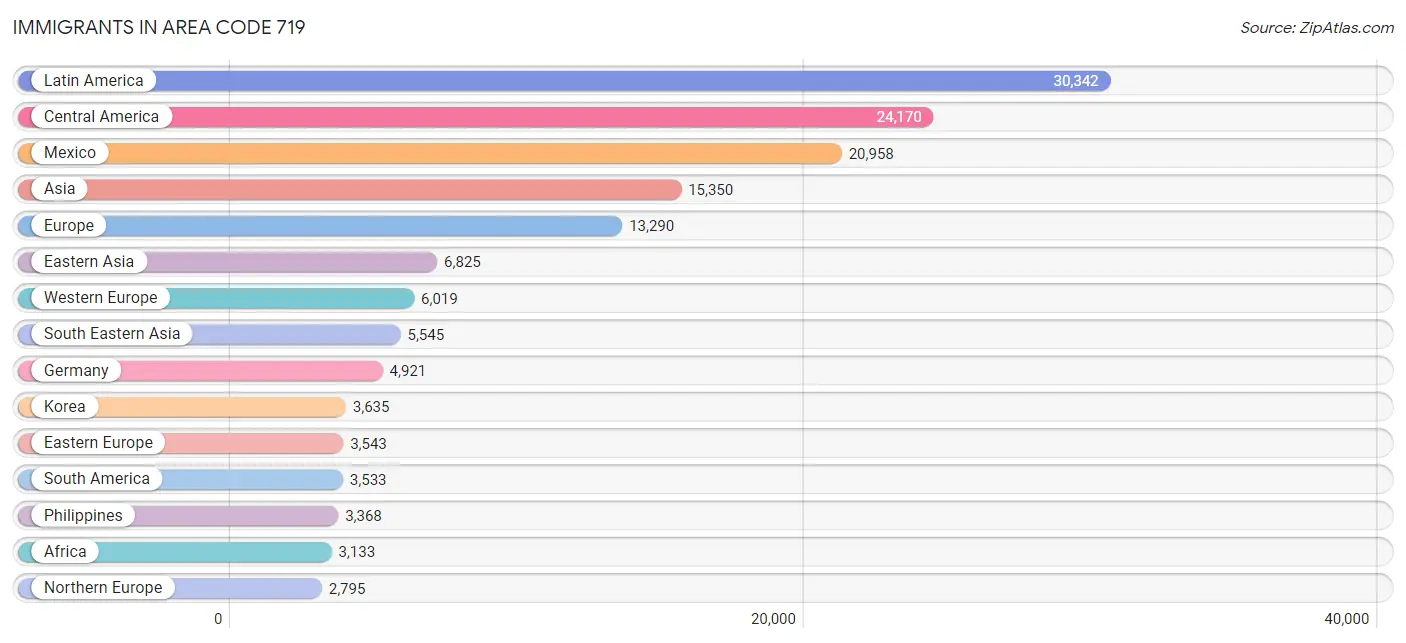
Immigrants in Area Code 719
The most numerous immigrant groups reported in Area Code 719 came from Latin America (30,342 | 2.6%), Central America (24,170 | 2.1%), Mexico (20,958 | 1.8%), Asia (15,350 | 1.3%), and Europe (13,290 | 1.1%), together accounting for 8.9% of all Area Code 719 residents.
| Immigration Origin | # Population | % Population |
| Afghanistan | 58 | 0.0% |
| Africa | 3,133 | 0.3% |
| Albania | 5 | 0.0% |
| Argentina | 485 | 0.0% |
| Armenia | 30 | 0.0% |
| Asia | 15,350 | 1.3% |
| Australia | 361 | 0.0% |
| Austria | 152 | 0.0% |
| Bahamas | 70 | 0.0% |
| Bangladesh | 61 | 0.0% |
| Barbados | 19 | 0.0% |
| Belarus | 132 | 0.0% |
| Belgium | 50 | 0.0% |
| Belize | 52 | 0.0% |
| Bolivia | 114 | 0.0% |
| Bosnia and Herzegovina | 63 | 0.0% |
| Brazil | 712 | 0.1% |
| Bulgaria | 78 | 0.0% |
| Cambodia | 82 | 0.0% |
| Cameroon | 179 | 0.0% |
| Canada | 2,653 | 0.2% |
| Caribbean | 2,639 | 0.2% |
| Central America | 24,170 | 2.1% |
| Chile | 263 | 0.0% |
| China | 2,098 | 0.2% |
| Colombia | 790 | 0.1% |
| Congo | 7 | 0.0% |
| Costa Rica | 79 | 0.0% |
| Croatia | 111 | 0.0% |
| Cuba | 849 | 0.1% |
| Czechoslovakia | 364 | 0.0% |
| Denmark | 72 | 0.0% |
| Dominica | 10 | 0.0% |
| Dominican Republic | 510 | 0.0% |
| Eastern Africa | 1,479 | 0.1% |
| Eastern Asia | 6,825 | 0.6% |
| Eastern Europe | 3,543 | 0.3% |
| Ecuador | 289 | 0.0% |
| Egypt | 63 | 0.0% |
| El Salvador | 770 | 0.1% |
| England | 1,081 | 0.1% |
| Eritrea | 31 | 0.0% |
| Ethiopia | 455 | 0.0% |
| Europe | 13,290 | 1.1% |
| Fiji | 56 | 0.0% |
| France | 244 | 0.0% |
| Germany | 4,921 | 0.4% |
| Ghana | 249 | 0.0% |
| Greece | 16 | 0.0% |
| Guatemala | 772 | 0.1% |
| Guyana | 116 | 0.0% |
| Haiti | 186 | 0.0% |
| Honduras | 916 | 0.1% |
| Hong Kong | 65 | 0.0% |
| Hungary | 154 | 0.0% |
| India | 1,156 | 0.1% |
| Indonesia | 107 | 0.0% |
| Iran | 280 | 0.0% |
| Iraq | 200 | 0.0% |
| Ireland | 183 | 0.0% |
| Israel | 94 | 0.0% |
| Italy | 444 | 0.0% |
| Jamaica | 816 | 0.1% |
| Japan | 1,062 | 0.1% |
| Jordan | 44 | 0.0% |
| Kazakhstan | 35 | 0.0% |
| Kenya | 610 | 0.1% |
| Korea | 3,635 | 0.3% |
| Kuwait | 32 | 0.0% |
| Laos | 64 | 0.0% |
| Latin America | 30,342 | 2.6% |
| Latvia | 67 | 0.0% |
| Lebanon | 26 | 0.0% |
| Liberia | 150 | 0.0% |
| Lithuania | 85 | 0.0% |
| Malaysia | 31 | 0.0% |
| Mexico | 20,958 | 1.8% |
| Middle Africa | 323 | 0.0% |
| Moldova | 42 | 0.0% |
| Morocco | 10 | 0.0% |
| Nepal | 365 | 0.0% |
| Netherlands | 256 | 0.0% |
| Nicaragua | 83 | 0.0% |
| Nigeria | 164 | 0.0% |
| North Macedonia | 34 | 0.0% |
| Northern Africa | 156 | 0.0% |
| Northern Europe | 2,795 | 0.2% |
| Norway | 69 | 0.0% |
| Oceania | 748 | 0.1% |
| Pakistan | 236 | 0.0% |
| Panama | 436 | 0.0% |
| Peru | 494 | 0.0% |
| Philippines | 3,368 | 0.3% |
| Poland | 533 | 0.1% |
| Portugal | 33 | 0.0% |
| Romania | 142 | 0.0% |
| Russia | 841 | 0.1% |
| Scotland | 205 | 0.0% |
| Serbia | 35 | 0.0% |
| Sierra Leone | 75 | 0.0% |
| Singapore | 71 | 0.0% |
| Somalia | 37 | 0.0% |
| South Africa | 341 | 0.0% |
| South America | 3,533 | 0.3% |
| South Central Asia | 2,224 | 0.2% |
| South Eastern Asia | 5,545 | 0.5% |
| Southern Europe | 933 | 0.1% |
| Spain | 440 | 0.0% |
| St. Vincent and the Grenadines | 43 | 0.0% |
| Sudan | 23 | 0.0% |
| Sweden | 158 | 0.0% |
| Switzerland | 353 | 0.0% |
| Syria | 30 | 0.0% |
| Taiwan | 324 | 0.0% |
| Thailand | 473 | 0.0% |
| Trinidad and Tobago | 84 | 0.0% |
| Turkey | 234 | 0.0% |
| Uganda | 107 | 0.0% |
| Ukraine | 599 | 0.1% |
| Uruguay | 81 | 0.0% |
| Uzbekistan | 8 | 0.0% |
| Venezuela | 188 | 0.0% |
| Vietnam | 1,280 | 0.1% |
| West Indies | 31 | 0.0% |
| Western Africa | 727 | 0.1% |
| Western Asia | 756 | 0.1% |
| Western Europe | 6,019 | 0.5% |
| Yemen | 10 | 0.0% |
| Zaire | 111 | 0.0% |
| Zimbabwe | 88 | 0.0% | View All 130 Rows |
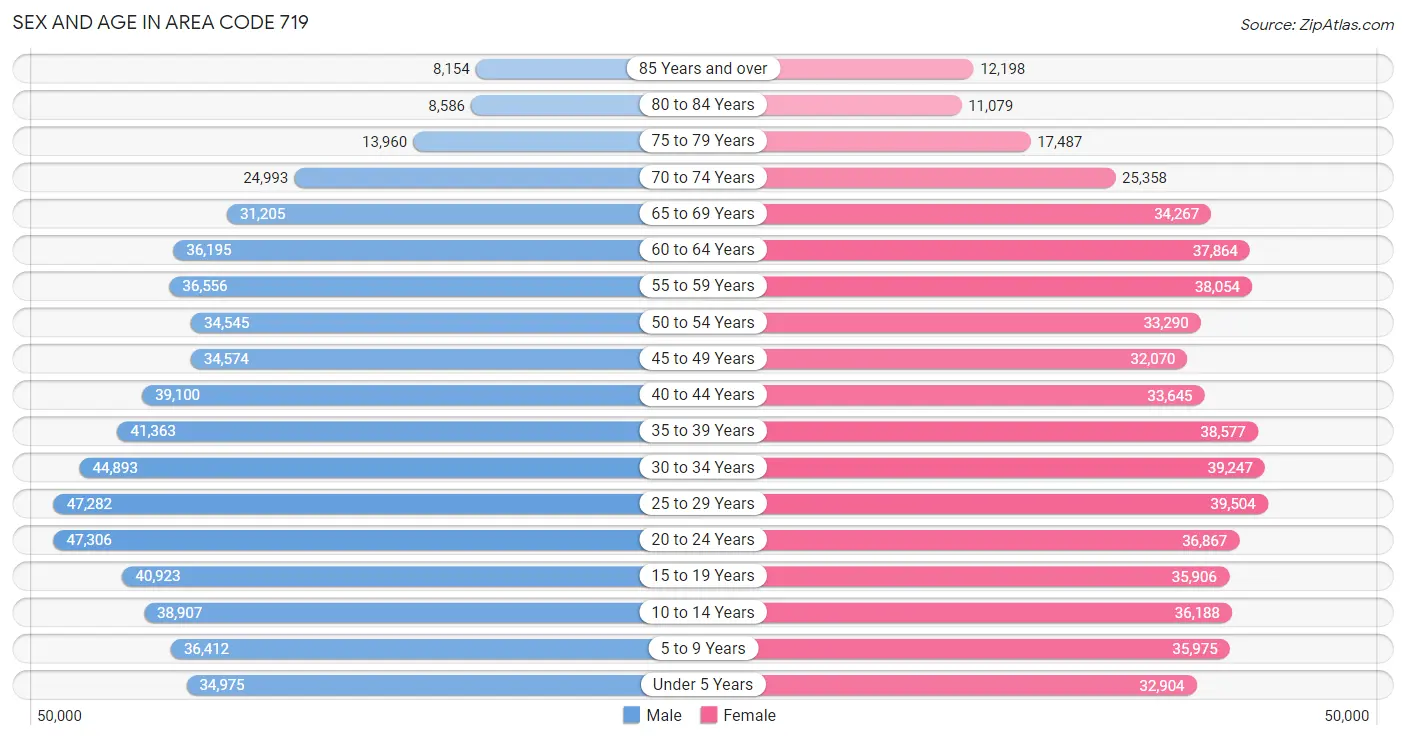
Sex and Age in Area Code 719
Sex and Age in Area Code 719
The most populous age groups in Area Code 719 are 20 to 24 Years (47,306 | 7.9%) for men and 25 to 29 Years (39,504 | 6.9%) for women.
| Age Bracket | Male | Female |
| Under 5 Years | 34,975 (5.8%) | 32,904 (5.8%) |
| 5 to 9 Years | 36,412 (6.1%) | 35,975 (6.3%) |
| 10 to 14 Years | 38,907 (6.5%) | 36,188 (6.3%) |
| 15 to 19 Years | 40,923 (6.8%) | 35,906 (6.3%) |
| 20 to 24 Years | 47,306 (7.9%) | 36,867 (6.5%) |
| 25 to 29 Years | 47,282 (7.9%) | 39,504 (6.9%) |
| 30 to 34 Years | 44,893 (7.5%) | 39,247 (6.9%) |
| 35 to 39 Years | 41,363 (6.9%) | 38,577 (6.8%) |
| 40 to 44 Years | 39,100 (6.5%) | 33,645 (5.9%) |
| 45 to 49 Years | 34,574 (5.8%) | 32,070 (5.6%) |
| 50 to 54 Years | 34,545 (5.8%) | 33,290 (5.8%) |
| 55 to 59 Years | 36,556 (6.1%) | 38,054 (6.7%) |
| 60 to 64 Years | 36,195 (6.0%) | 37,864 (6.6%) |
| 65 to 69 Years | 31,205 (5.2%) | 34,267 (6.0%) |
| 70 to 74 Years | 24,993 (4.2%) | 25,358 (4.4%) |
| 75 to 79 Years | 13,960 (2.3%) | 17,487 (3.1%) |
| 80 to 84 Years | 8,586 (1.4%) | 11,079 (1.9%) |
| 85 Years and over | 8,154 (1.4%) | 12,198 (2.1%) |
| Total | 599,929 (100.0%) | 570,480 (100.0%) |
Families and Households in Area Code 719
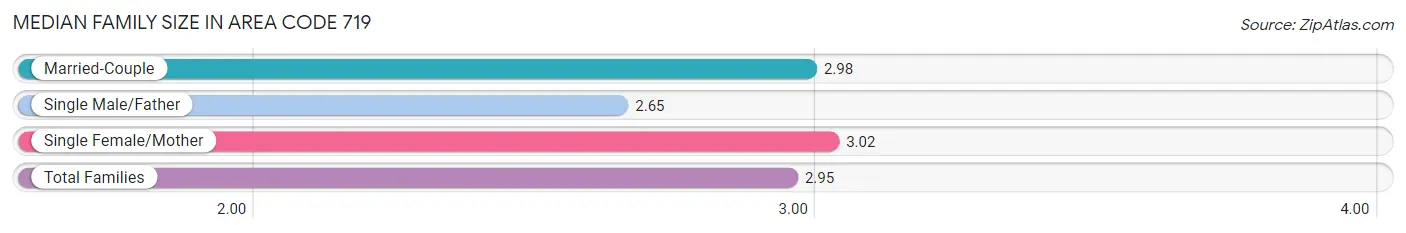
Median Family Size in Area Code 719
The median family size in Area Code 719 is 2.95 persons per family, with single female/mother families (45,345 | 15.2%) accounting for the largest median family size of 3.0233 persons per family. On the other hand, single male/father families (22,552 | 7.6%) represent the smallest median family size with 2.65 persons per family.
| Family Type | # Families | Family Size |
| Married-Couple | 229,725 (77.2%) | 2.98 |
| Single Male/Father | 22,552 (7.6%) | 2.65 |
| Single Female/Mother | 45,345 (15.2%) | 3.02 |
| Total Families | 297,622 (100.0%) | 2.95 |
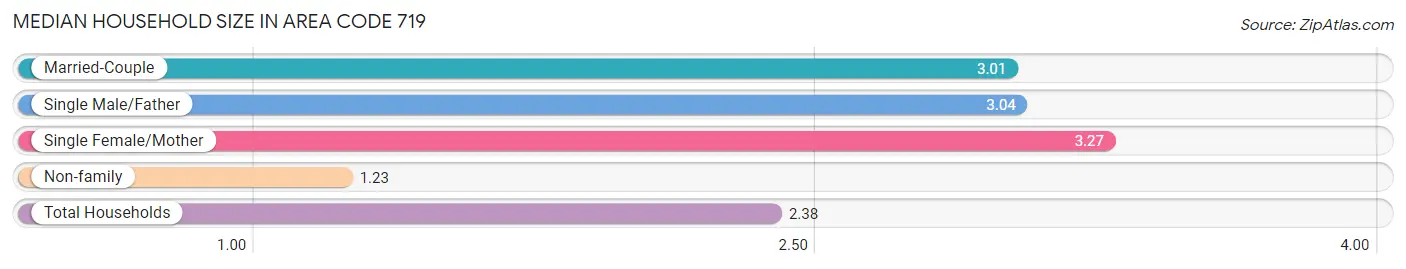
Median Household Size in Area Code 719
The median household size in Area Code 719 is 2.38 persons per household, with single female/mother households (45,345 | 10.0%) accounting for the largest median household size of 3.27464 persons per household. non-family households (155,177 | 34.3%) represent the smallest median household size with 1.23 persons per household.
| Household Type | # Households | Household Size |
| Married-Couple | 229,725 (50.7%) | 3.01 |
| Single Male/Father | 22,552 (5.0%) | 3.04 |
| Single Female/Mother | 45,345 (10.0%) | 3.27 |
| Non-family | 155,177 (34.3%) | 1.23 |
| Total Households | 452,799 (100.0%) | 2.38 |
Household Size by Marriage Status in Area Code 719
Out of a total of 452,799 households in Area Code 719, 297,622 (65.7%) are family households, while 155,177 (34.3%) are nonfamily households. The most numerous type of family households are 2-person households, comprising 137,577, and the most common type of nonfamily households are 1-person households, comprising 122,213.
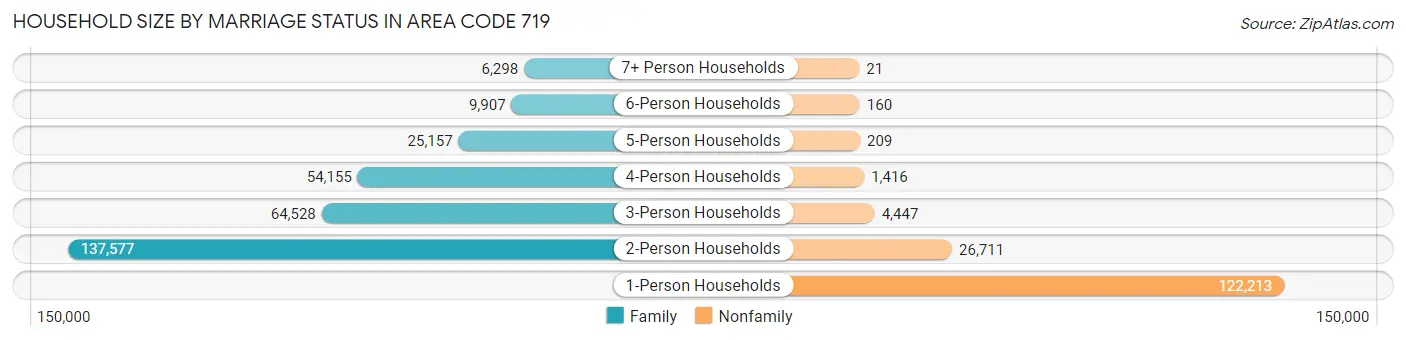
| Household Size | Family Households | Nonfamily Households |
| 1-Person Households | - | 122,213 (27.0%) |
| 2-Person Households | 137,577 (30.4%) | 26,711 (5.9%) |
| 3-Person Households | 64,528 (14.2%) | 4,447 (1.0%) |
| 4-Person Households | 54,155 (12.0%) | 1,416 (0.3%) |
| 5-Person Households | 25,157 (5.6%) | 209 (0.1%) |
| 6-Person Households | 9,907 (2.2%) | 160 (0.0%) |
| 7+ Person Households | 6,298 (1.4%) | 21 (0.0%) |
| Total | 297,622 (65.7%) | 155,177 (34.3%) |
Female Fertility in Area Code 719
Fertility by Age in Area Code 719
Average fertility rate in Area Code 719 is 70.2 births per 1,000 women. Women in the age bracket of 20 to 34 years have the highest fertility rate with 157.6 births per 1,000 women. Women in the age bracket of 20 to 34 years acount for 77.7% of all women with births.
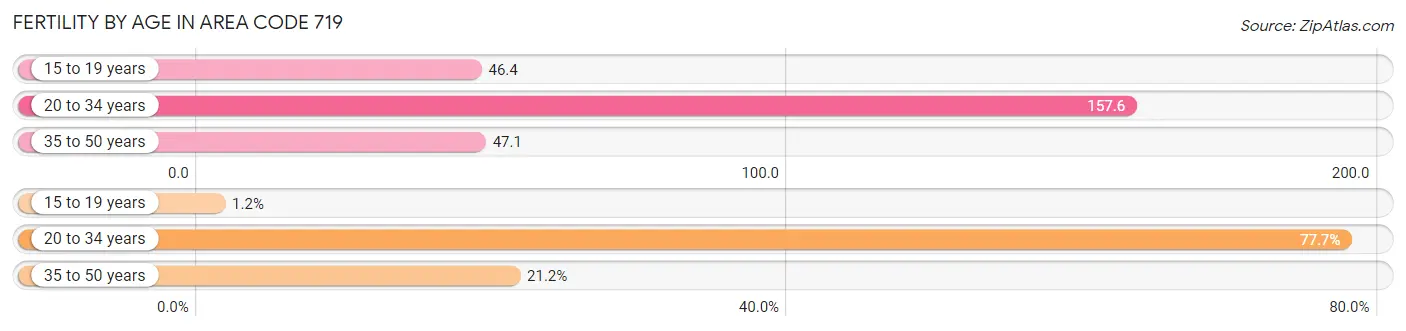
| Age Bracket | Women with Births | Births / 1,000 Women |
| 15 to 19 years | 163 (1.2%) | 46.4 |
| 20 to 34 years | 10,936 (77.7%) | 157.6 |
| 35 to 50 years | 2,983 (21.2%) | 47.1 |
| Total | 14,082 (100.0%) | 70.2 |
Fertility by Age by Marriage Status in Area Code 719
56.1% of women with births (14,082) in Area Code 719 are married. The highest percentage of unmarried women with births falls into 15 to 19 years age bracket with 100.0% of them unmarried at the time of birth, while the lowest percentage of unmarried women with births belong to 20 to 34 years age bracket with 48.9% of them unmarried.
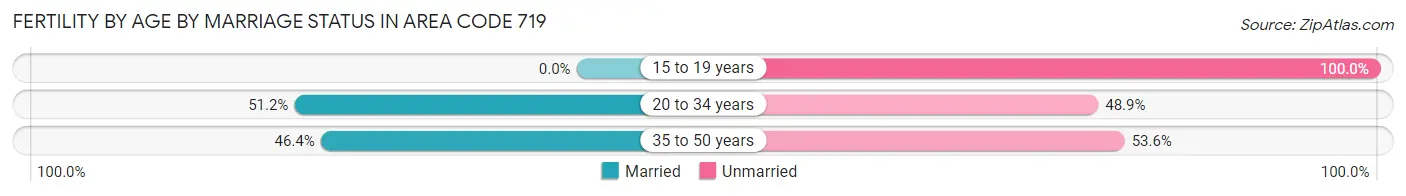
| Age Bracket | Married | Unmarried |
| 15 to 19 years | 0 (0.0%) | 163 (100.0%) |
| 20 to 34 years | 5,594 (51.1%) | 5,342 (48.8%) |
| 35 to 50 years | 1,383 (46.4%) | 1,600 (53.6%) |
| Total | 7,896 (56.1%) | 6,186 (43.9%) |
Fertility by Education in Area Code 719
Average fertility rate in Area Code 719 is 70.2 births per 1,000 women. Women with the education attainment of graduate degree have the highest fertility rate of 138.7 births per 1,000 women, while women with the education attainment of college or associate's degree have the lowest fertility at 111.9 births per 1,000 women. Women with the education attainment of college or associate's degree represent 40.4% of all women with births.
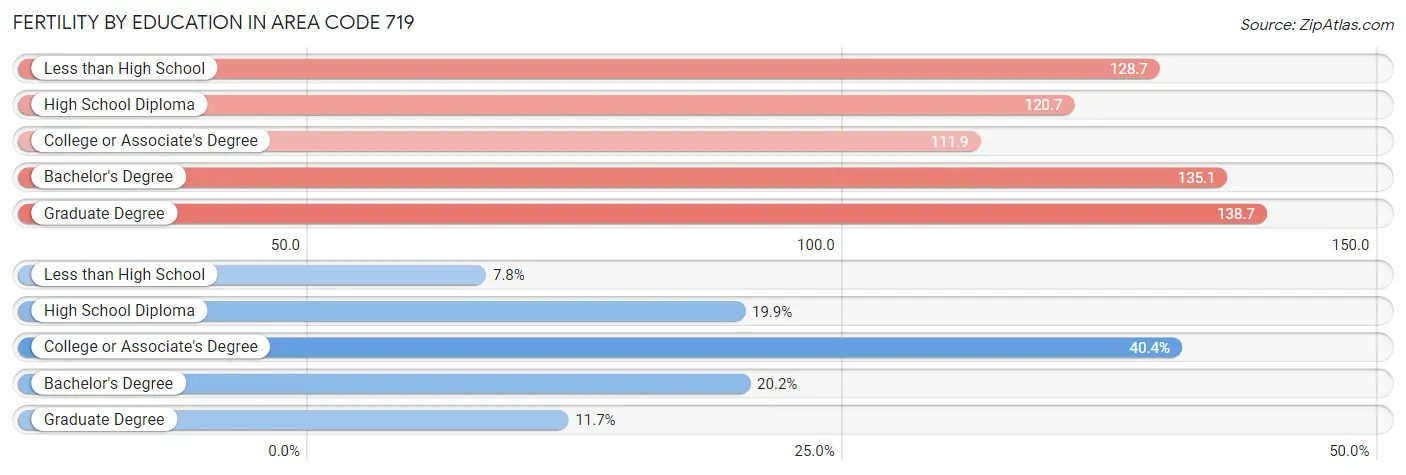
| Educational Attainment | Women with Births | Births / 1,000 Women |
| Less than High School | 1,100 (7.8%) | 128.7 |
| High School Diploma | 2,808 (19.9%) | 120.7 |
| College or Associate's Degree | 5,688 (40.4%) | 111.9 |
| Bachelor's Degree | 2,842 (20.2%) | 135.1 |
| Graduate Degree | 1,644 (11.7%) | 138.7 |
| Total | 14,082 (100.0%) | 70.2 |
Fertility by Education by Marriage Status in Area Code 719
43.9% of women with births in Area Code 719 are unmarried. Women with the educational attainment of bachelor's degree are most likely to be married with 75.2% of them married at childbirth, while women with the educational attainment of less than high school are least likely to be married with 81.7% of them unmarried at childbirth.
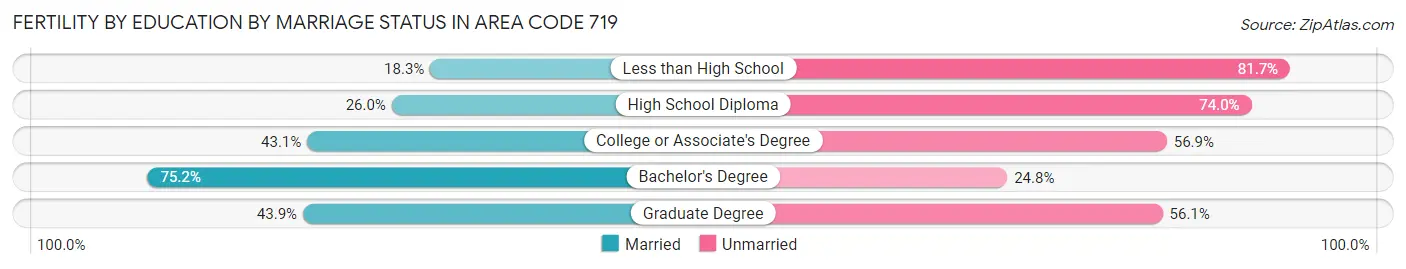
| Educational Attainment | Married | Unmarried |
| Less than High School | 201 (18.3%) | 899 (81.7%) |
| High School Diploma | 731 (26.0%) | 2,077 (74.0%) |
| College or Associate's Degree | 2,450 (43.1%) | 3,238 (56.9%) |
| Bachelor's Degree | 2,138 (75.2%) | 704 (24.8%) |
| Graduate Degree | 722 (43.9%) | 922 (56.1%) |
| Total | 7,896 (56.1%) | 6,186 (43.9%) |
Employment Characteristics in Area Code 719
Employment by Class of Employer in Area Code 719
Among the 553,121 employed individuals in Area Code 719, private company employees (322,486 | 58.3%), federal government employees (58,258 | 10.5%), and not-for-profit organizations (46,413 | 8.4%) make up the most common classes of employment.
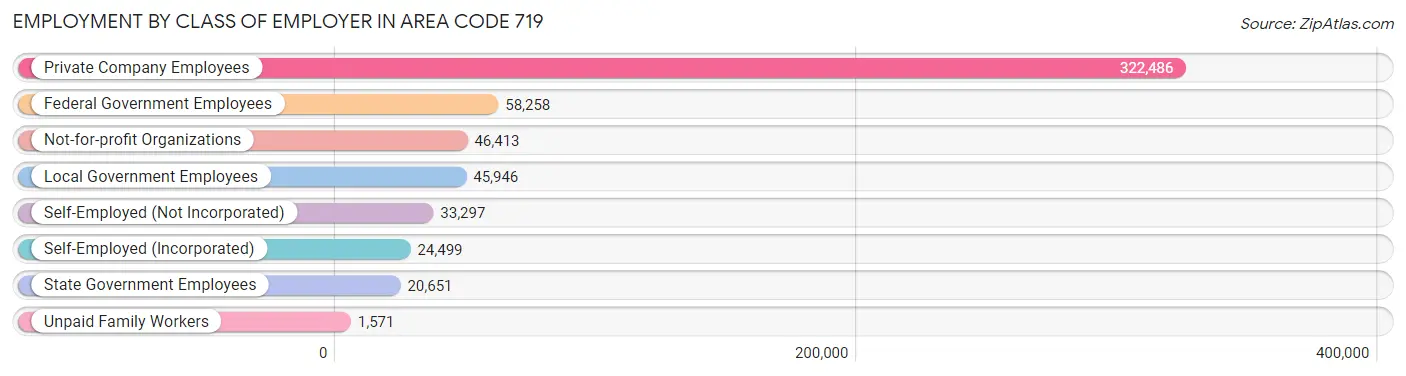
| Employer Class | # Employees | % Employees |
| Private Company Employees | 322,486 | 58.3% |
| Self-Employed (Incorporated) | 24,499 | 4.4% |
| Self-Employed (Not Incorporated) | 33,297 | 6.0% |
| Not-for-profit Organizations | 46,413 | 8.4% |
| Local Government Employees | 45,946 | 8.3% |
| State Government Employees | 20,651 | 3.7% |
| Federal Government Employees | 58,258 | 10.5% |
| Unpaid Family Workers | 1,571 | 0.3% |
| Total | 553,121 | 100.0% |
Employment Status by Age in Area Code 719
According to the labor force statistics for Area Code 719, out of the total population over 16 years of age (938,655), 57.5% or 539,257 individuals are in the labor force, with 6.2% or 33,326 of them unemployed. The age group with the highest labor force participation rate is 25 to 29 years, with 82.1% or 71,217 individuals in the labor force. Within the labor force, the 16 to 19 years age range has the highest percentage of unemployed individuals, with 1,689.3% or 468,105 of them being unemployed.
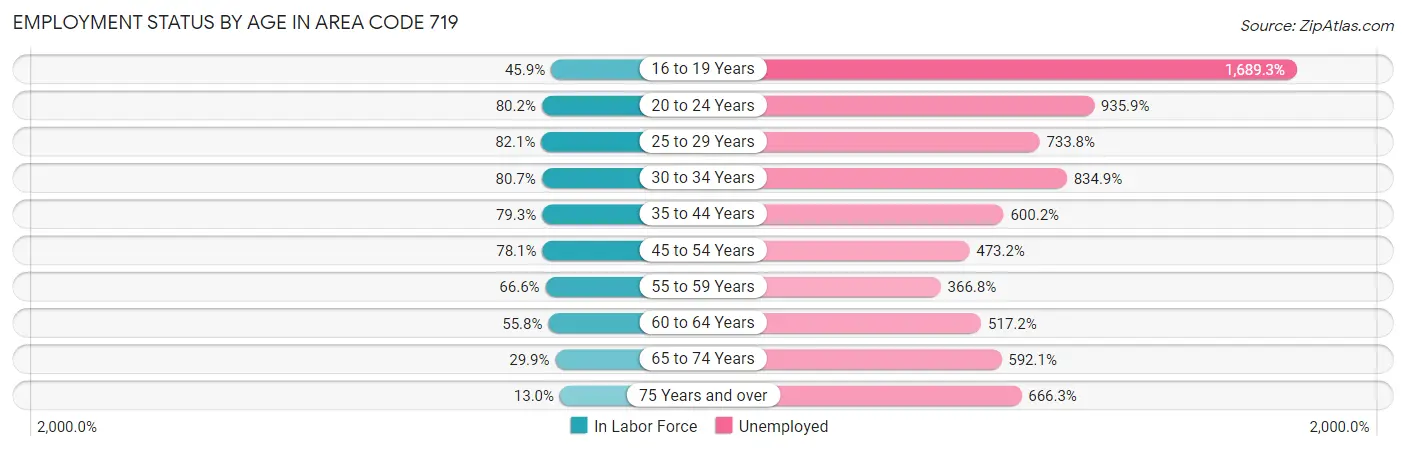
| Age Bracket | In Labor Force | Unemployed |
| 16 to 19 Years | 27,712 (45.9%) | 468,105 (1,689.3%) |
| 20 to 24 Years | 67,523 (80.2%) | 631,957 (935.9%) |
| 25 to 29 Years | 71,216 (82.1%) | 522,590 (733.8%) |
| 30 to 34 Years | 67,866 (80.7%) | 566,622 (834.9%) |
| 35 to 44 Years | 121,133 (79.3%) | 727,082 (600.2%) |
| 45 to 54 Years | 105,037 (78.1%) | 497,059 (473.2%) |
| 55 to 59 Years | 49,693 (66.6%) | 182,263 (366.8%) |
| 60 to 64 Years | 41,329 (55.8%) | 213,769 (517.2%) |
| 65 to 74 Years | 34,570 (29.8%) | 204,707 (592.1%) |
| 75 Years and over | 9,317 (13.0%) | 62,092 (666.3%) |
| Total | 539,260 (57.5%) | 33,308 (6.2%) |
Employment Status by Educational Attainment in Area Code 719
According to labor force statistics for Area Code 719, 71.7% of individuals (434,925) out of the total population between 25 and 64 years of age (606,759) are in the labor force, with 647.2% or 2,814,835 of them being unemployed. The group with the highest labor force participation rate are those with the educational attainment of bachelor's degree or higher, with 82.0% or 173,105 individuals in the labor force. Within the labor force, individuals with less than high school education have the highest percentage of unemployment, with 1,070.8% or 252,227 of them being unemployed.
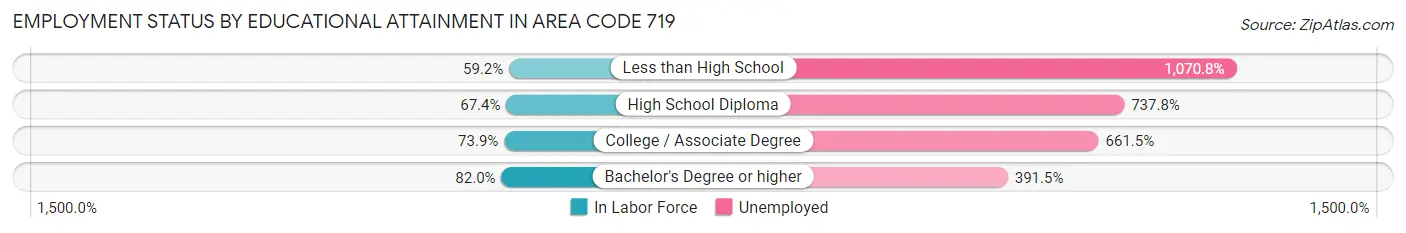
| Educational Attainment | In Labor Force | Unemployed |
| Less than High School | 23,557 (59.2%) | 426,350 (1,070.8%) |
| High School Diploma | 94,356 (67.4%) | 1,033,200 (737.8%) |
| College / Associate Degree | 159,308 (73.9%) | 1,426,670 (661.5%) |
| Bachelor's Degree or higher | 173,110 (82.0%) | 826,977 (391.5%) |
| Total | 434,902 (71.7%) | 3,926,944 (647.2%) |
Employment Occupations by Sex in Area Code 719
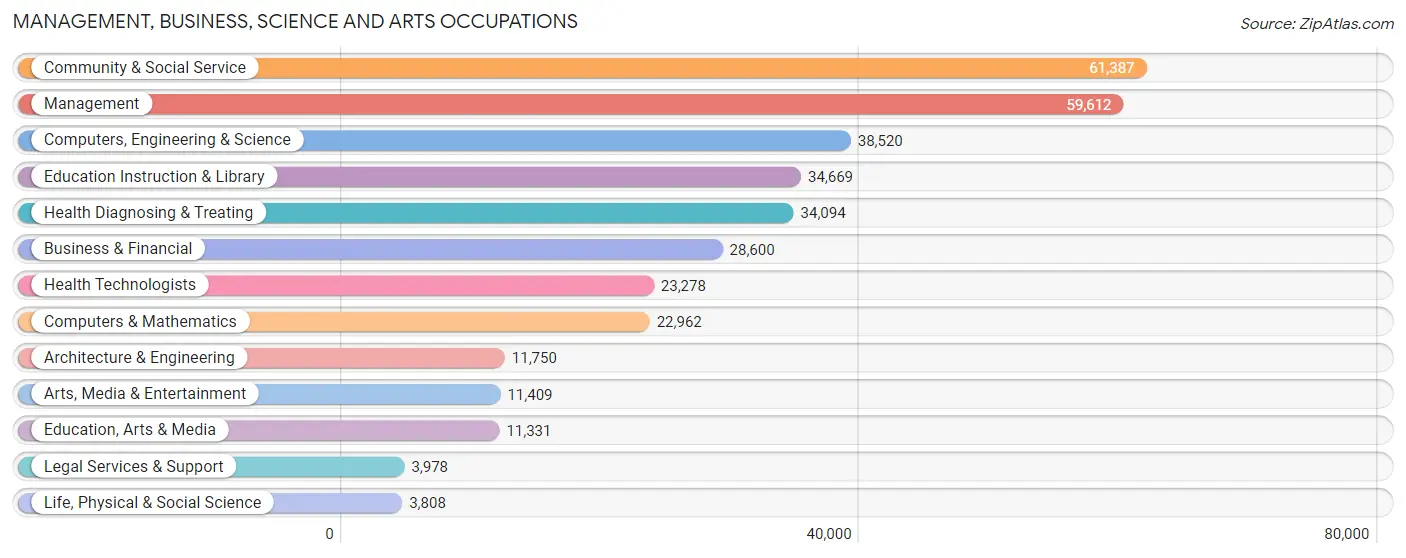
Management, Business, Science and Arts Occupations
The most common Management, Business, Science and Arts occupations in Area Code 719 are Community & Social Service (61,387 | 11.6%), Management (59,612 | 11.3%), Computers, Engineering & Science (38,520 | 7.3%), Education Instruction & Library (34,669 | 6.6%), and Health Diagnosing & Treating (34,094 | 6.4%).
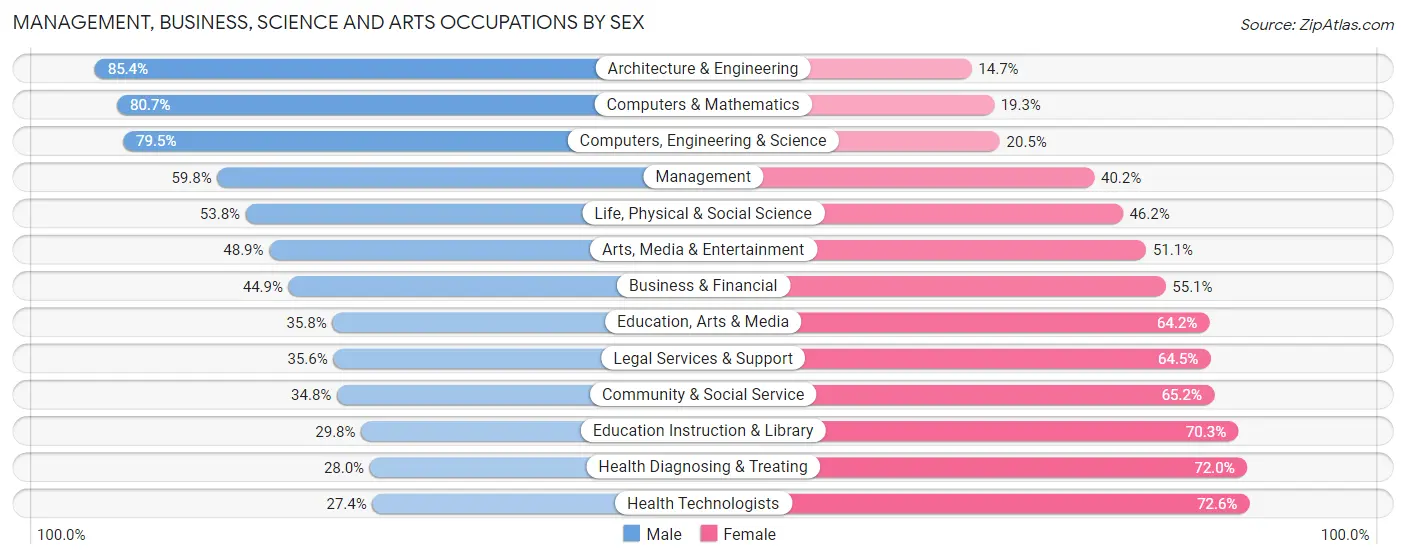
Management, Business, Science and Arts Occupations by Sex
Within the Management, Business, Science and Arts occupations in Area Code 719, the most male-oriented occupations are Architecture & Engineering (85.4%), Computers & Mathematics (80.7%), and Computers, Engineering & Science (79.5%), while the most female-oriented occupations are Health Technologists (72.6%), Health Diagnosing & Treating (72.0%), and Education Instruction & Library (70.3%).
| Occupation | Male | Female |
| Management | 35,624 (59.8%) | 23,988 (40.2%) |
| Business & Financial | 12,838 (44.9%) | 15,762 (55.1%) |
| Computers, Engineering & Science | 30,609 (79.5%) | 7,911 (20.5%) |
| Computers & Mathematics | 18,530 (80.7%) | 4,432 (19.3%) |
| Architecture & Engineering | 10,029 (85.4%) | 1,721 (14.6%) |
| Life, Physical & Social Science | 2,050 (53.8%) | 1,758 (46.2%) |
| Community & Social Service | 21,363 (34.8%) | 40,024 (65.2%) |
| Education, Arts & Media | 4,052 (35.8%) | 7,279 (64.2%) |
| Legal Services & Support | 1,414 (35.5%) | 2,564 (64.4%) |
| Education Instruction & Library | 10,313 (29.7%) | 24,356 (70.3%) |
| Arts, Media & Entertainment | 5,584 (48.9%) | 5,825 (51.1%) |
| Health Diagnosing & Treating | 9,534 (28.0%) | 24,560 (72.0%) |
| Health Technologists | 6,380 (27.4%) | 16,898 (72.6%) |
| Total (Category) | 109,968 (49.5%) | 112,245 (50.5%) |
| Total (Overall) | 283,895 (53.6%) | 245,639 (46.4%) |
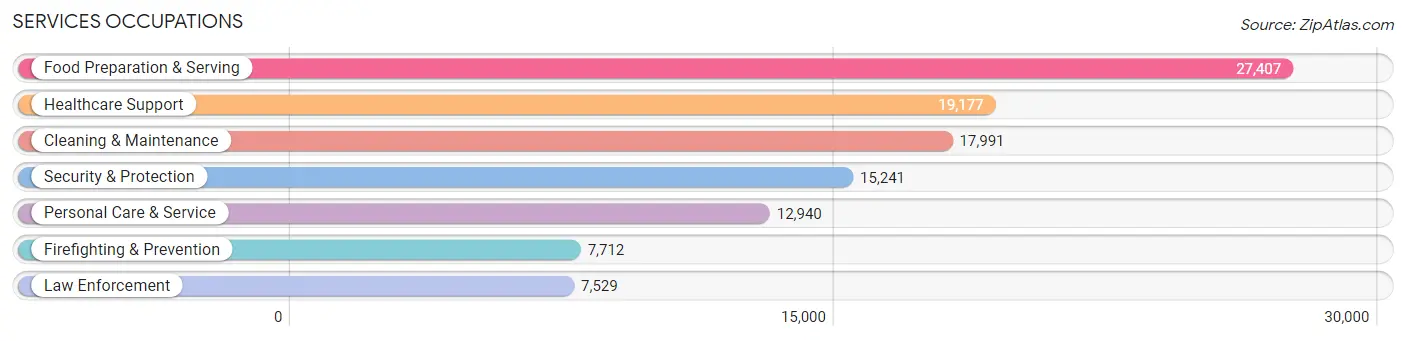
Services Occupations
The most common Services occupations in Area Code 719 are Food Preparation & Serving (27,407 | 5.2%), Healthcare Support (19,177 | 3.6%), Cleaning & Maintenance (17,991 | 3.4%), Security & Protection (15,241 | 2.9%), and Personal Care & Service (12,940 | 2.4%).
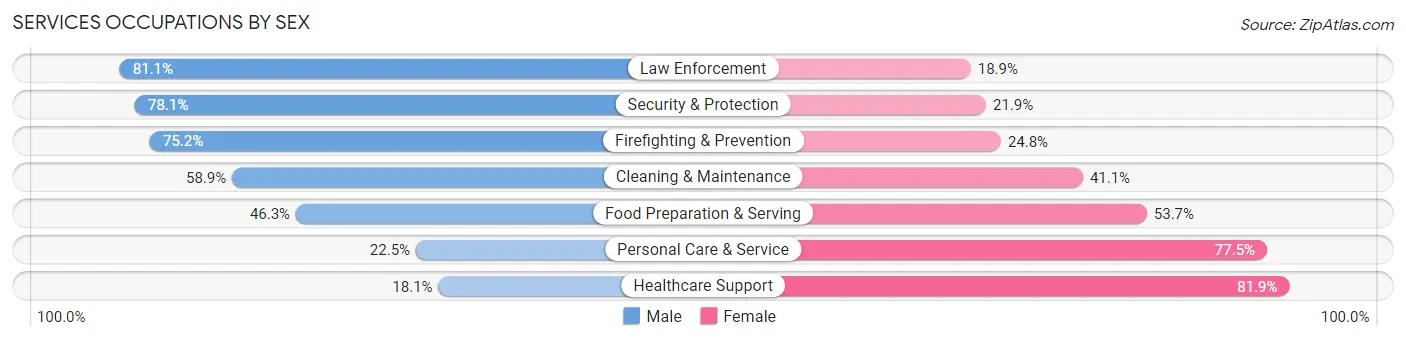
Services Occupations by Sex
Within the Services occupations in Area Code 719, the most male-oriented occupations are Law Enforcement (81.1%), Security & Protection (78.1%), and Firefighting & Prevention (75.2%), while the most female-oriented occupations are Healthcare Support (81.9%), Personal Care & Service (77.5%), and Food Preparation & Serving (53.7%).
| Occupation | Male | Female |
| Healthcare Support | 3,463 (18.1%) | 15,714 (81.9%) |
| Security & Protection | 11,906 (78.1%) | 3,335 (21.9%) |
| Firefighting & Prevention | 5,797 (75.2%) | 1,915 (24.8%) |
| Law Enforcement | 6,109 (81.1%) | 1,420 (18.9%) |
| Food Preparation & Serving | 12,680 (46.3%) | 14,727 (53.7%) |
| Cleaning & Maintenance | 10,602 (58.9%) | 7,389 (41.1%) |
| Personal Care & Service | 2,913 (22.5%) | 10,027 (77.5%) |
| Total (Category) | 41,564 (44.8%) | 51,192 (55.2%) |
| Total (Overall) | 283,895 (53.6%) | 245,639 (46.4%) |
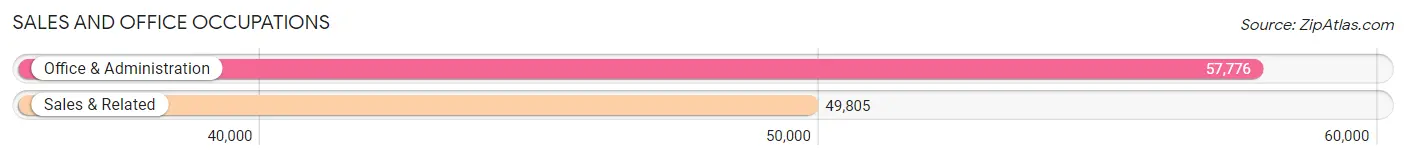
Sales and Office Occupations
The most common Sales and Office occupations in Area Code 719 are Office & Administration (57,776 | 10.9%), and Sales & Related (49,805 | 9.4%).
Sales and Office Occupations by Sex
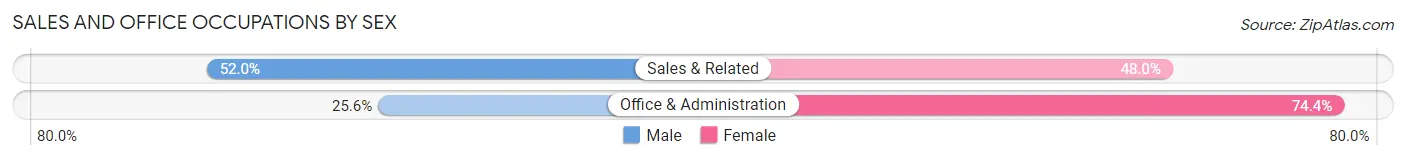
| Occupation | Male | Female |
| Sales & Related | 25,887 (52.0%) | 23,918 (48.0%) |
| Office & Administration | 14,810 (25.6%) | 42,966 (74.4%) |
| Total (Category) | 40,697 (37.8%) | 66,884 (62.2%) |
| Total (Overall) | 283,895 (53.6%) | 245,639 (46.4%) |
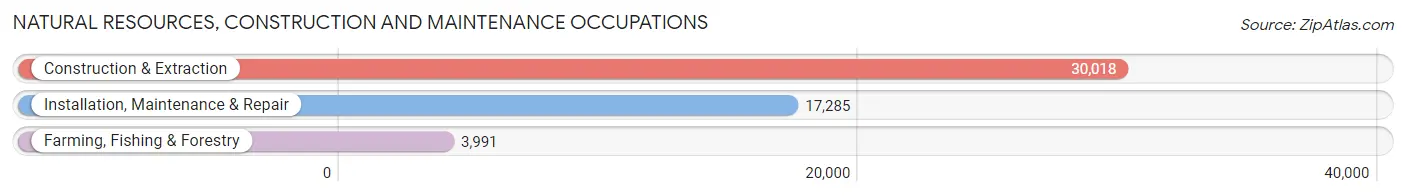
Natural Resources, Construction and Maintenance Occupations
The most common Natural Resources, Construction and Maintenance occupations in Area Code 719 are Construction & Extraction (30,018 | 5.7%), Installation, Maintenance & Repair (17,285 | 3.3%), and Farming, Fishing & Forestry (3,991 | 0.7%).
Natural Resources, Construction and Maintenance Occupations by Sex
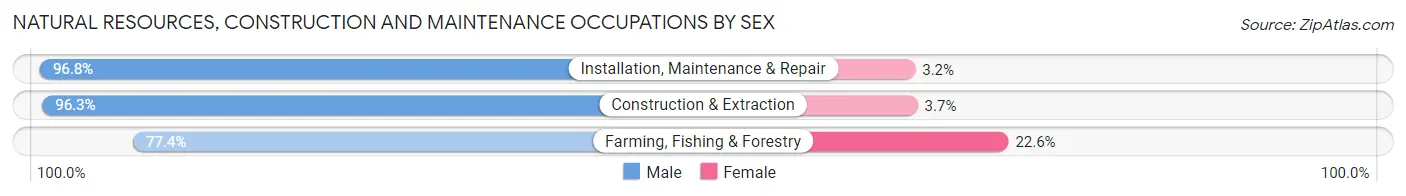
| Occupation | Male | Female |
| Farming, Fishing & Forestry | 3,090 (77.4%) | 901 (22.6%) |
| Construction & Extraction | 28,909 (96.3%) | 1,109 (3.7%) |
| Installation, Maintenance & Repair | 16,732 (96.8%) | 553 (3.2%) |
| Total (Category) | 48,731 (95.0%) | 2,563 (5.0%) |
| Total (Overall) | 283,895 (53.6%) | 245,639 (46.4%) |
Production, Transportation and Moving Occupations
The most common Production, Transportation and Moving occupations in Area Code 719 are Transportation (19,587 | 3.7%), Production (19,328 | 3.6%), and Material Moving (16,775 | 3.2%).
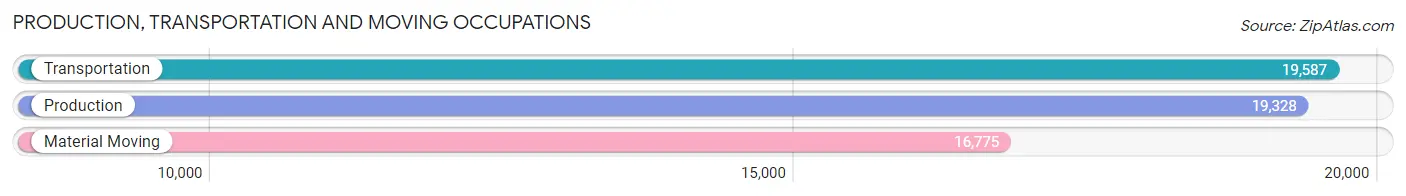
Production, Transportation and Moving Occupations by Sex
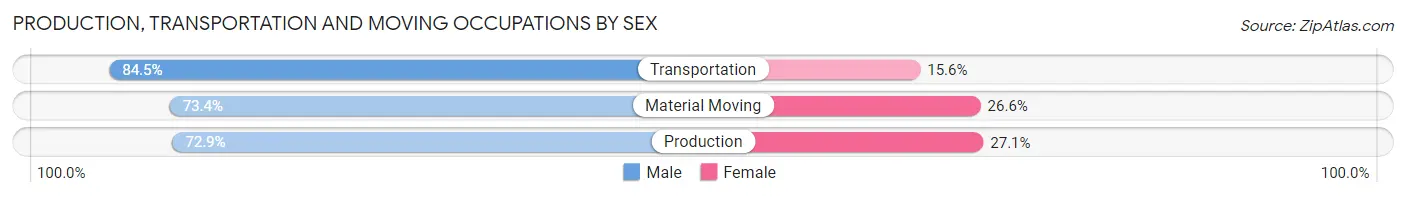
| Occupation | Male | Female |
| Production | 14,086 (72.9%) | 5,242 (27.1%) |
| Transportation | 16,541 (84.5%) | 3,046 (15.5%) |
| Material Moving | 12,308 (73.4%) | 4,467 (26.6%) |
| Total (Category) | 42,935 (77.1%) | 12,755 (22.9%) |
| Total (Overall) | 283,895 (53.6%) | 245,639 (46.4%) |
Employment Industries by Sex in Area Code 719
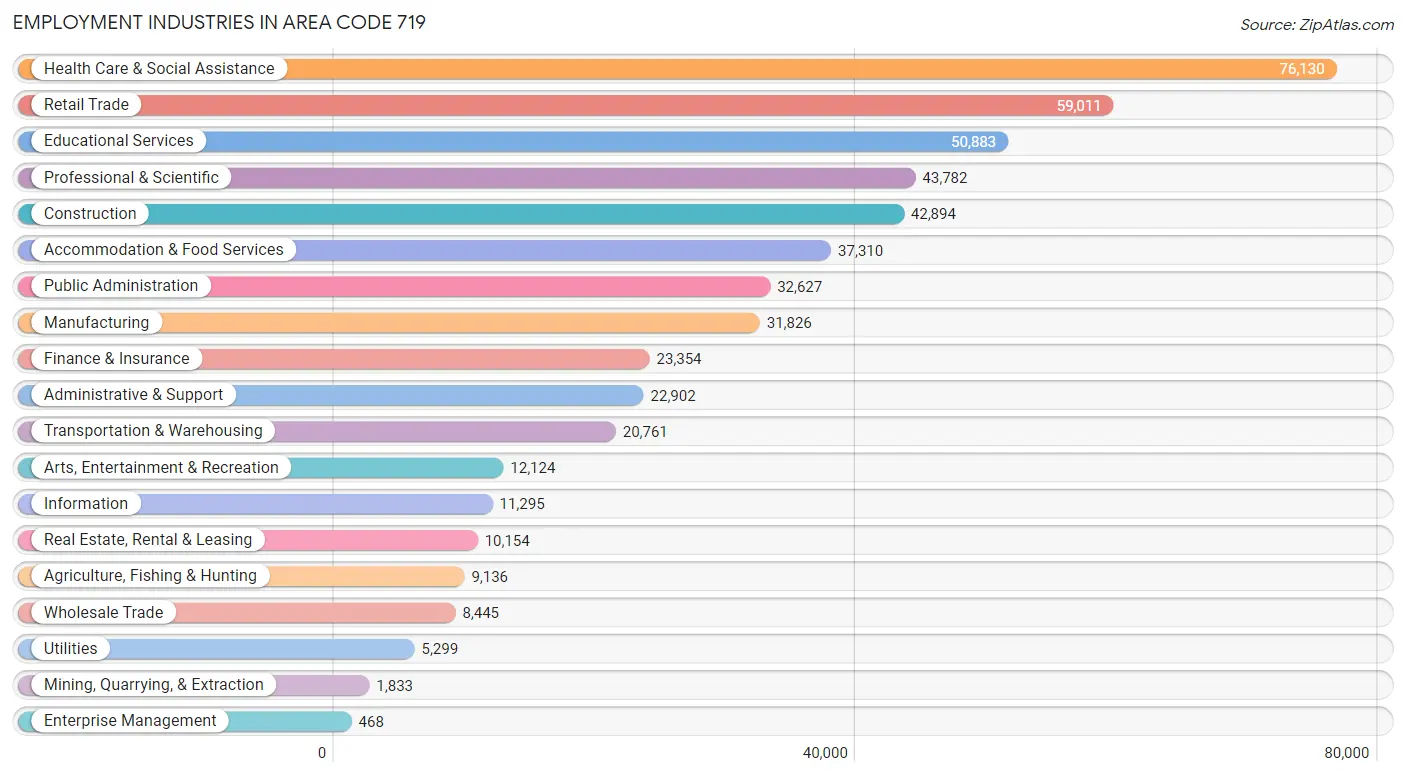
Employment Industries in Area Code 719
The major employment industries in Area Code 719 include Health Care & Social Assistance (76,130 | 14.4%), Retail Trade (59,011 | 11.1%), Educational Services (50,883 | 9.6%), Professional & Scientific (43,782 | 8.3%), and Construction (42,894 | 8.1%).
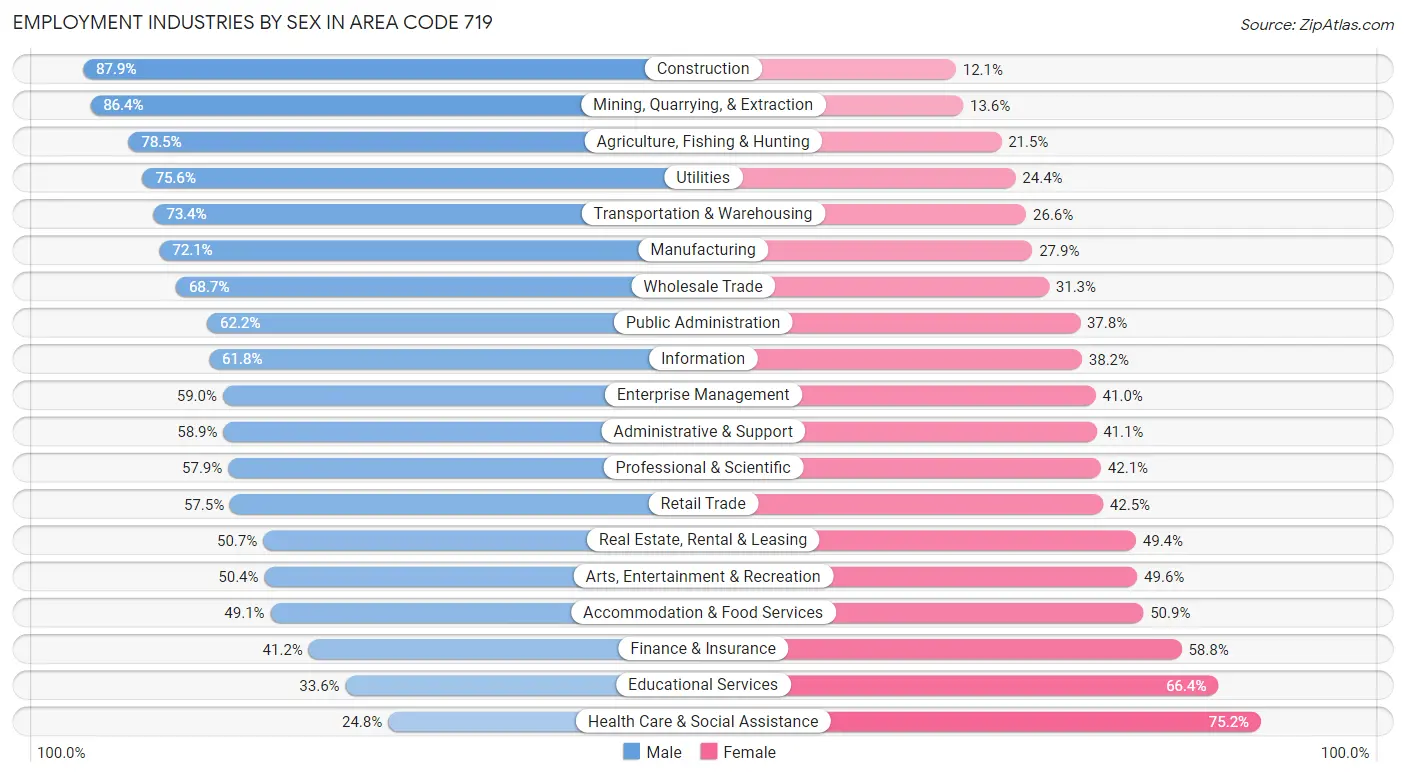
Employment Industries by Sex in Area Code 719
The Area Code 719 industries that see more men than women are Construction (87.9%), Mining, Quarrying, & Extraction (86.4%), and Agriculture, Fishing & Hunting (78.5%), whereas the industries that tend to have a higher number of women are Health Care & Social Assistance (75.2%), Educational Services (66.4%), and Finance & Insurance (58.8%).
| Industry | Male | Female |
| Agriculture, Fishing & Hunting | 7,174 (78.5%) | 1,962 (21.5%) |
| Mining, Quarrying, & Extraction | 1,584 (86.4%) | 249 (13.6%) |
| Construction | 37,710 (87.9%) | 5,184 (12.1%) |
| Manufacturing | 22,942 (72.1%) | 8,884 (27.9%) |
| Wholesale Trade | 5,798 (68.7%) | 2,647 (31.3%) |
| Retail Trade | 33,916 (57.5%) | 25,095 (42.5%) |
| Transportation & Warehousing | 15,230 (73.4%) | 5,531 (26.6%) |
| Utilities | 4,005 (75.6%) | 1,294 (24.4%) |
| Information | 6,983 (61.8%) | 4,312 (38.2%) |
| Finance & Insurance | 9,622 (41.2%) | 13,732 (58.8%) |
| Real Estate, Rental & Leasing | 5,143 (50.6%) | 5,011 (49.3%) |
| Professional & Scientific | 25,341 (57.9%) | 18,441 (42.1%) |
| Enterprise Management | 276 (59.0%) | 192 (41.0%) |
| Administrative & Support | 13,481 (58.9%) | 9,421 (41.1%) |
| Educational Services | 17,099 (33.6%) | 33,784 (66.4%) |
| Health Care & Social Assistance | 18,855 (24.8%) | 57,275 (75.2%) |
| Arts, Entertainment & Recreation | 6,108 (50.4%) | 6,016 (49.6%) |
| Accommodation & Food Services | 18,325 (49.1%) | 18,985 (50.9%) |
| Public Administration | 20,296 (62.2%) | 12,331 (37.8%) |
| Total | 283,895 (53.6%) | 245,639 (46.4%) |
Education in Area Code 719
School Enrollment in Area Code 719
The most common levels of schooling among the 283,695 students in Area Code 719 are college / undergraduate (61,917 | 21.8%), middle school (59,722 | 21.0%), and high school (59,717 | 21.0%).
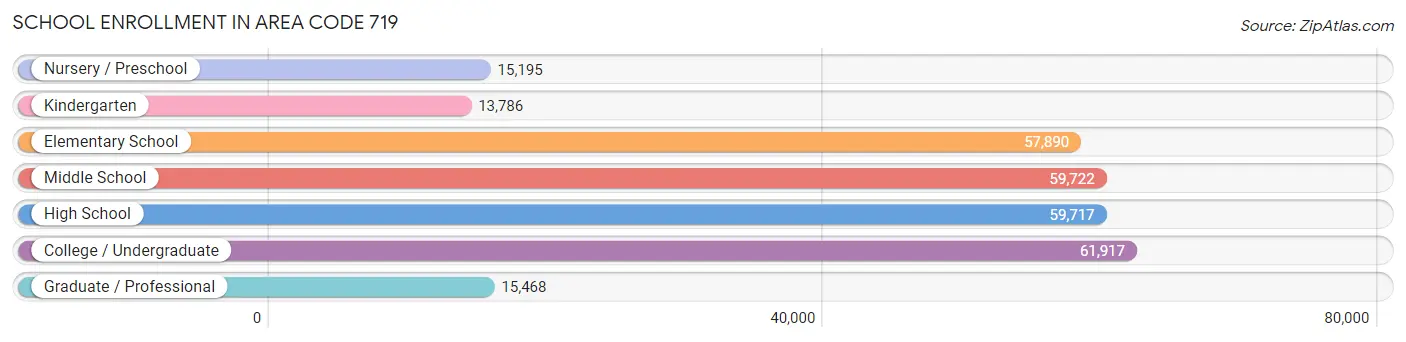
| School Level | # Students | % Students |
| Nursery / Preschool | 15,195 | 5.4% |
| Kindergarten | 13,786 | 4.9% |
| Elementary School | 57,890 | 20.4% |
| Middle School | 59,722 | 21.0% |
| High School | 59,717 | 21.0% |
| College / Undergraduate | 61,917 | 21.8% |
| Graduate / Professional | 15,468 | 5.4% |
| Total | 283,695 | 100.0% |
School Enrollment by Age by Funding Source in Area Code 719
Out of a total of 283,695 students who are enrolled in schools in Area Code 719, 39,933 (14.1%) attend a private institution, while the remaining 243,762 (85.9%) are enrolled in public schools. The age group of 3 to 4 year olds has the highest likelihood of being enrolled in private schools, with 3,668 (31.5% in the age bracket) enrolled. Conversely, the age group of 15 to 17 year olds has the lowest likelihood of being enrolled in a private school, with 39,988 (90.5% in the age bracket) attending a public institution.

| Age Bracket | Public School | Private School |
| 3 to 4 Year Olds | 7,989 (68.5%) | 3,668 (31.5%) |
| 5 to 9 Year Old | 59,573 (87.8%) | 8,289 (12.2%) |
| 10 to 14 Year Olds | 65,123 (88.7%) | 8,281 (11.3%) |
| 15 to 17 Year Olds | 39,988 (90.5%) | 4,191 (9.5%) |
| 18 to 19 Year Olds | 18,494 (87.2%) | 2,724 (12.8%) |
| 20 to 24 Year Olds | 22,302 (85.6%) | 3,766 (14.4%) |
| 25 to 34 Year Olds | 17,094 (82.7%) | 3,587 (17.3%) |
| 35 Years and over | 13,204 (70.9%) | 5,422 (29.1%) |
| Total | 243,762 (85.9%) | 39,933 (14.1%) |
Educational Attainment by Field of Study in Area Code 719
Business (53,056 | 17.6%), education (32,862 | 10.9%), science & technology (28,458 | 9.5%), social sciences (23,381 | 7.8%), and arts & humanities (20,733 | 6.9%) are the most common fields of study among 300,915 individuals in Area Code 719 who have obtained a bachelor's degree or higher.
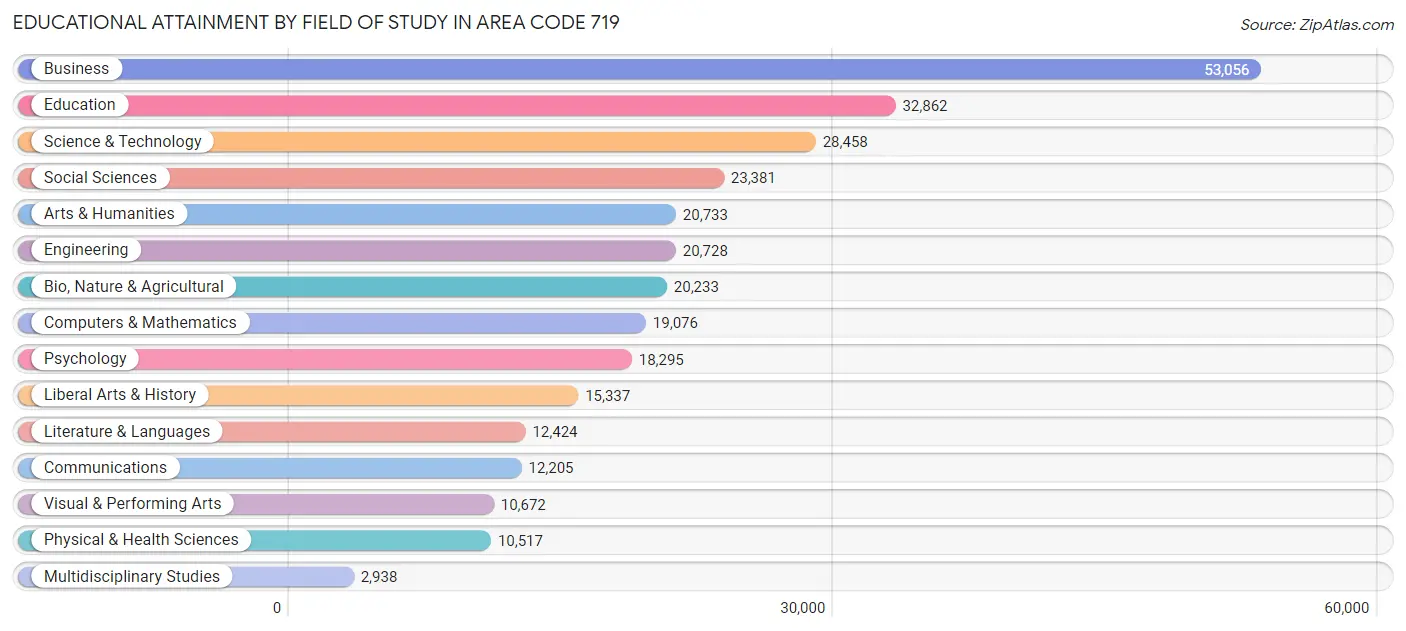
| Field of Study | # Graduates | % Graduates |
| Computers & Mathematics | 19,076 | 6.3% |
| Bio, Nature & Agricultural | 20,233 | 6.7% |
| Physical & Health Sciences | 10,517 | 3.5% |
| Psychology | 18,295 | 6.1% |
| Social Sciences | 23,381 | 7.8% |
| Engineering | 20,728 | 6.9% |
| Multidisciplinary Studies | 2,938 | 1.0% |
| Science & Technology | 28,458 | 9.5% |
| Business | 53,056 | 17.6% |
| Education | 32,862 | 10.9% |
| Literature & Languages | 12,424 | 4.1% |
| Liberal Arts & History | 15,337 | 5.1% |
| Visual & Performing Arts | 10,672 | 3.5% |
| Communications | 12,205 | 4.1% |
| Arts & Humanities | 20,733 | 6.9% |
| Total | 300,915 | 100.0% |
Transportation & Commute in Area Code 719
Vehicle Availability by Sex in Area Code 719
The most prevalent vehicle ownership categories in Area Code 719 are males with 2 vehicles (124,491, accounting for 41.9%) and females with 2 vehicles (94,548, making up 51.7%).
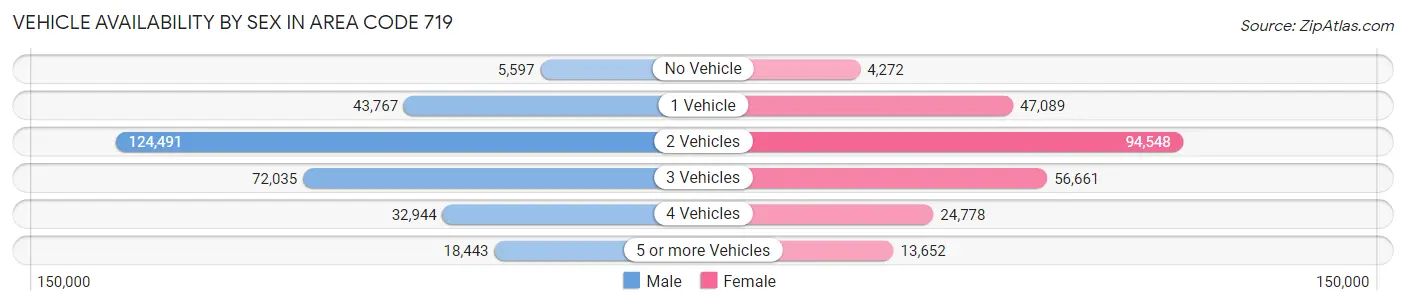
| Vehicles Available | Male | Female |
| No Vehicle | 5,597 (1.9%) | 4,272 (1.8%) |
| 1 Vehicle | 43,767 (14.7%) | 47,089 (19.5%) |
| 2 Vehicles | 124,491 (41.9%) | 94,548 (39.2%) |
| 3 Vehicles | 72,035 (24.2%) | 56,661 (23.5%) |
| 4 Vehicles | 32,944 (11.1%) | 24,778 (10.3%) |
| 5 or more Vehicles | 18,443 (6.2%) | 13,652 (5.7%) |
| Total | 297,277 (100.0%) | 241,000 (100.0%) |
Commute Time in Area Code 719
The most frequently occuring commute durations in Area Code 719 are 15 to 19 minutes (85,810 commuters, 17.6%), 20 to 24 minutes (77,288 commuters, 15.9%), and 10 to 14 minutes (73,410 commuters, 15.1%).
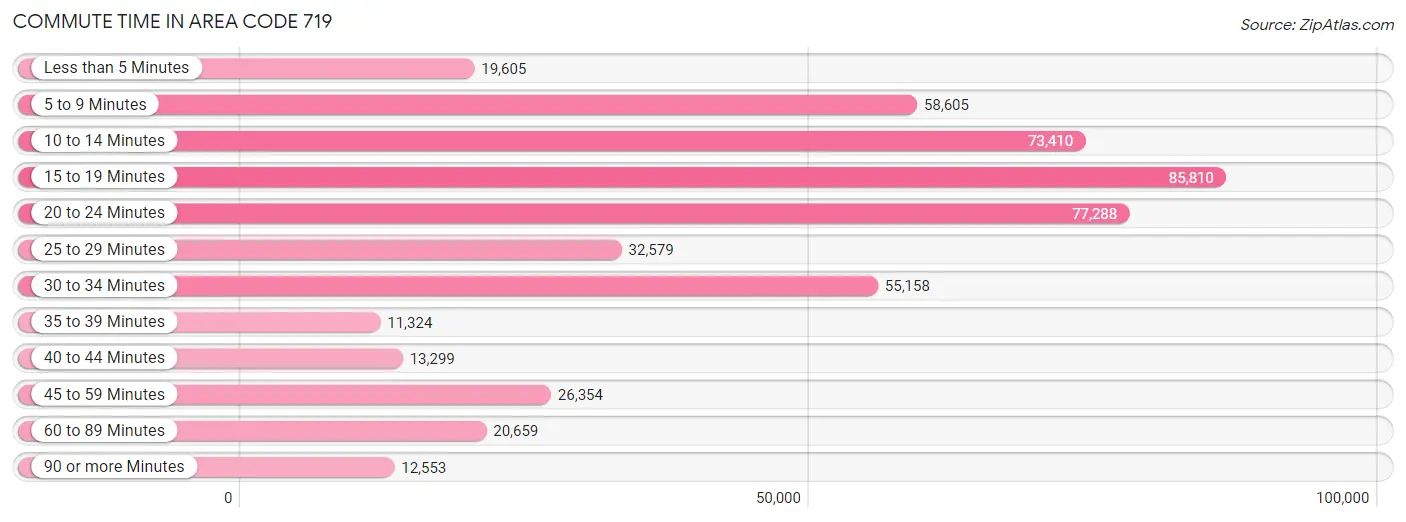
| Commute Time | # Commuters | % Commuters |
| Less than 5 Minutes | 19,605 | 4.0% |
| 5 to 9 Minutes | 58,605 | 12.0% |
| 10 to 14 Minutes | 73,410 | 15.1% |
| 15 to 19 Minutes | 85,810 | 17.6% |
| 20 to 24 Minutes | 77,288 | 15.9% |
| 25 to 29 Minutes | 32,579 | 6.7% |
| 30 to 34 Minutes | 55,158 | 11.3% |
| 35 to 39 Minutes | 11,324 | 2.3% |
| 40 to 44 Minutes | 13,299 | 2.7% |
| 45 to 59 Minutes | 26,354 | 5.4% |
| 60 to 89 Minutes | 20,659 | 4.3% |
| 90 or more Minutes | 12,553 | 2.6% |
Commute Time by Sex in Area Code 719
The most common commute times in Area Code 719 are 15 to 19 minutes (47,494 commuters, 17.1%) for males and 15 to 19 minutes (38,316 commuters, 18.3%) for females.
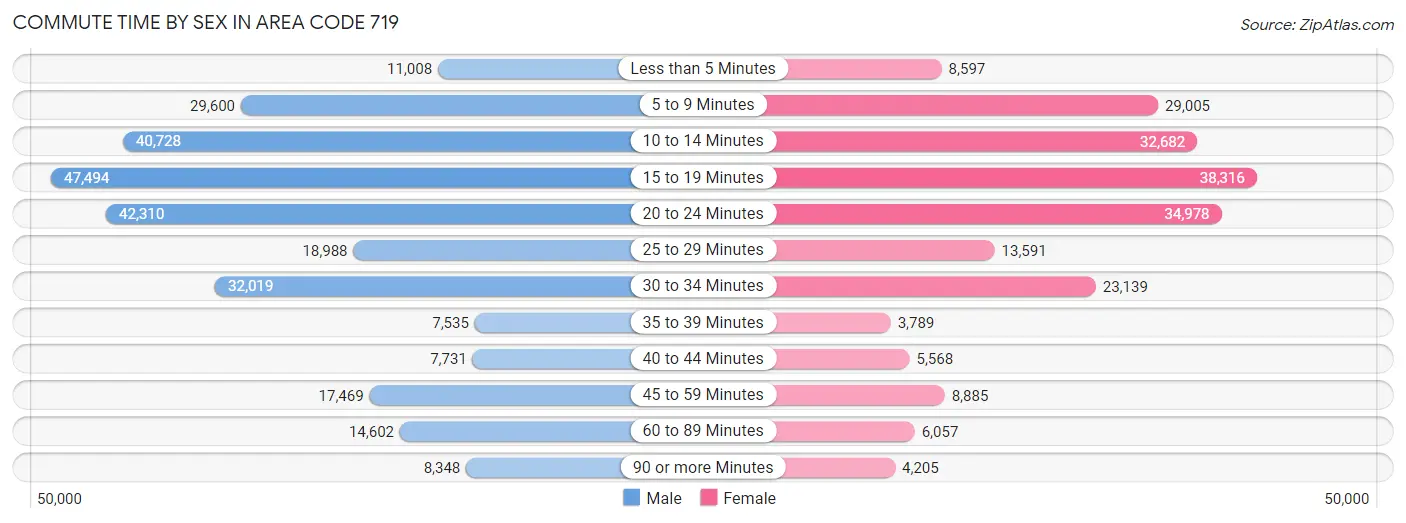
| Commute Time | Male | Female |
| Less than 5 Minutes | 11,008 (4.0%) | 8,597 (4.1%) |
| 5 to 9 Minutes | 29,600 (10.6%) | 29,005 (13.9%) |
| 10 to 14 Minutes | 40,728 (14.7%) | 32,682 (15.7%) |
| 15 to 19 Minutes | 47,494 (17.1%) | 38,316 (18.3%) |
| 20 to 24 Minutes | 42,310 (15.2%) | 34,978 (16.8%) |
| 25 to 29 Minutes | 18,988 (6.8%) | 13,591 (6.5%) |
| 30 to 34 Minutes | 32,019 (11.5%) | 23,139 (11.1%) |
| 35 to 39 Minutes | 7,535 (2.7%) | 3,789 (1.8%) |
| 40 to 44 Minutes | 7,731 (2.8%) | 5,568 (2.7%) |
| 45 to 59 Minutes | 17,469 (6.3%) | 8,885 (4.3%) |
| 60 to 89 Minutes | 14,602 (5.3%) | 6,057 (2.9%) |
| 90 or more Minutes | 8,348 (3.0%) | 4,205 (2.0%) |
Time of Departure to Work by Sex in Area Code 719
The most frequent times of departure to work in Area Code 719 are 7:00 AM to 7:29 AM (44,758, 16.1%) for males and 7:00 AM to 7:29 AM (36,563, 17.5%) for females.
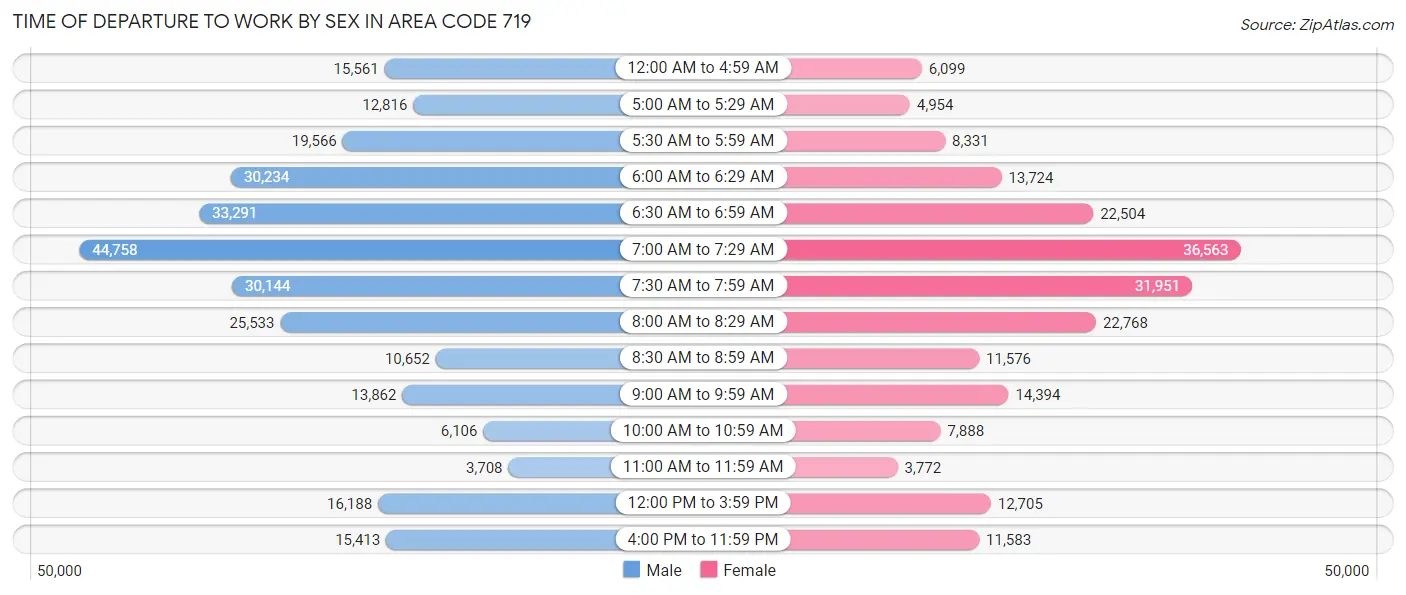
| Time of Departure | Male | Female |
| 12:00 AM to 4:59 AM | 15,561 (5.6%) | 6,099 (2.9%) |
| 5:00 AM to 5:29 AM | 12,816 (4.6%) | 4,954 (2.4%) |
| 5:30 AM to 5:59 AM | 19,566 (7.0%) | 8,331 (4.0%) |
| 6:00 AM to 6:29 AM | 30,234 (10.9%) | 13,724 (6.6%) |
| 6:30 AM to 6:59 AM | 33,291 (12.0%) | 22,504 (10.8%) |
| 7:00 AM to 7:29 AM | 44,758 (16.1%) | 36,563 (17.5%) |
| 7:30 AM to 7:59 AM | 30,144 (10.8%) | 31,951 (15.3%) |
| 8:00 AM to 8:29 AM | 25,533 (9.2%) | 22,768 (10.9%) |
| 8:30 AM to 8:59 AM | 10,652 (3.8%) | 11,576 (5.5%) |
| 9:00 AM to 9:59 AM | 13,862 (5.0%) | 14,394 (6.9%) |
| 10:00 AM to 10:59 AM | 6,106 (2.2%) | 7,888 (3.8%) |
| 11:00 AM to 11:59 AM | 3,708 (1.3%) | 3,772 (1.8%) |
| 12:00 PM to 3:59 PM | 16,188 (5.8%) | 12,705 (6.1%) |
| 4:00 PM to 11:59 PM | 15,413 (5.6%) | 11,583 (5.6%) |
| Total | 277,832 (100.0%) | 208,812 (100.0%) |
Housing Occupancy in Area Code 719
Occupancy by Ownership in Area Code 719
Of the total 452,799 dwellings in Area Code 719, owner-occupied units account for 310,086 (68.5%), while renter-occupied units make up 142,713 (31.5%).
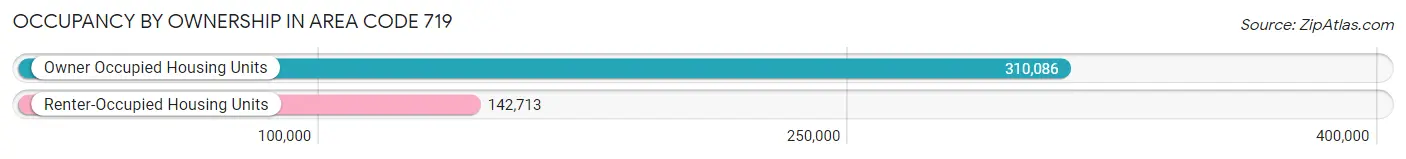
| Occupancy | # Housing Units | % Housing Units |
| Owner Occupied Housing Units | 310,086 | 68.5% |
| Renter-Occupied Housing Units | 142,713 | 31.5% |
| Total Occupied Housing Units | 452,799 | 100.0% |
Occupancy by Household Size in Area Code 719
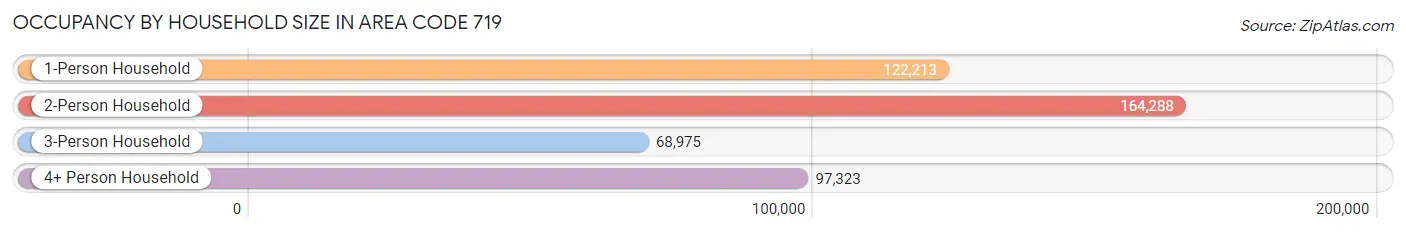
| Household Size | # Housing Units | % Housing Units |
| 1-Person Household | 122,213 | 27.0% |
| 2-Person Household | 164,288 | 36.3% |
| 3-Person Household | 68,975 | 15.2% |
| 4+ Person Household | 97,323 | 21.5% |
| Total Housing Units | 452,799 | 100.0% |
Occupancy by Ownership by Household Size in Area Code 719
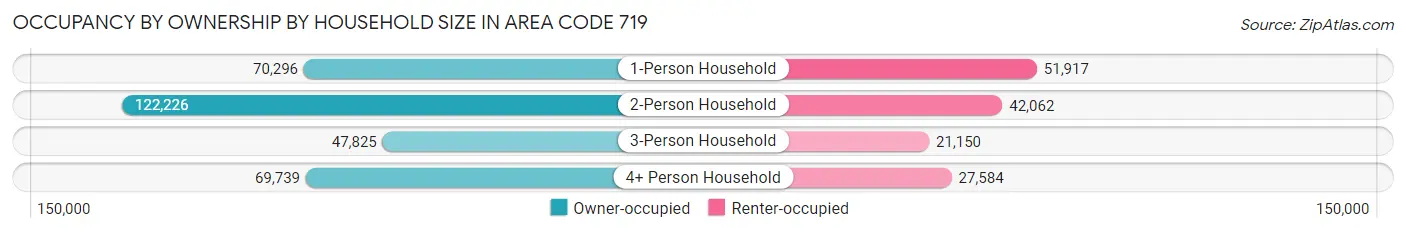
| Household Size | Owner-occupied | Renter-occupied |
| 1-Person Household | 70,296 (57.5%) | 51,917 (42.5%) |
| 2-Person Household | 122,226 (74.4%) | 42,062 (25.6%) |
| 3-Person Household | 47,825 (69.3%) | 21,150 (30.7%) |
| 4+ Person Household | 69,739 (71.7%) | 27,584 (28.3%) |
| Total Housing Units | 310,086 (68.5%) | 142,713 (31.5%) |
Occupancy by Educational Attainment in Area Code 719
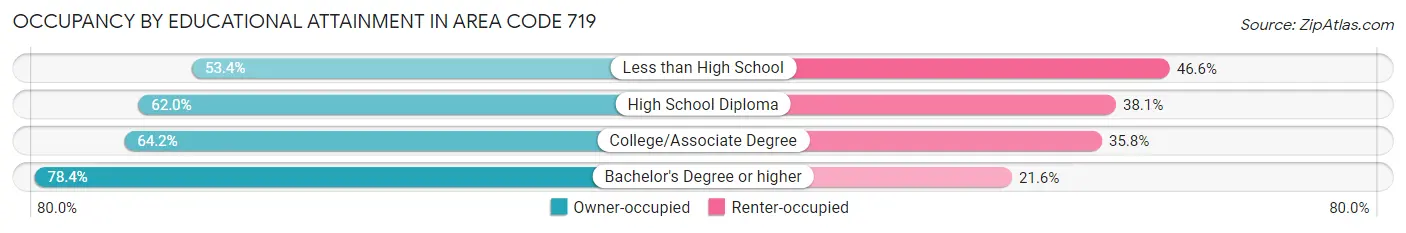
| Household Size | Owner-occupied | Renter-occupied |
| Less than High School | 12,452 (53.4%) | 10,854 (46.6%) |
| High School Diploma | 57,328 (62.0%) | 35,214 (38.1%) |
| College/Associate Degree | 107,954 (64.2%) | 60,267 (35.8%) |
| Bachelor's Degree or higher | 132,352 (78.4%) | 36,378 (21.6%) |
Occupancy by Age of Householder in Area Code 719
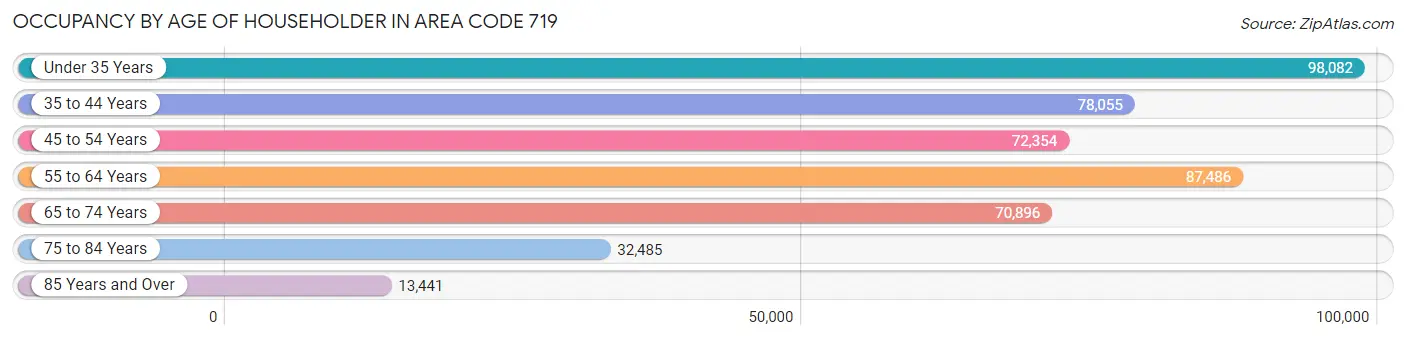
| Age Bracket | # Households | % Households |
| Under 35 Years | 98,082 | 21.7% |
| 35 to 44 Years | 78,055 | 17.2% |
| 45 to 54 Years | 72,354 | 16.0% |
| 55 to 64 Years | 87,486 | 19.3% |
| 65 to 74 Years | 70,896 | 15.7% |
| 75 to 84 Years | 32,485 | 7.2% |
| 85 Years and Over | 13,441 | 3.0% |
| Total | 452,799 | 100.0% |
Housing Finances in Area Code 719
Median Income by Occupancy in Area Code 719
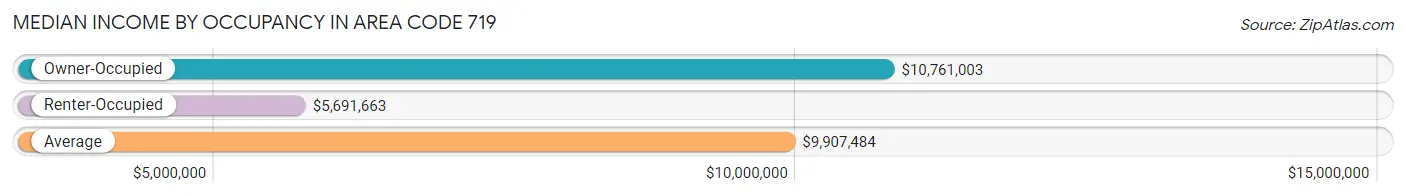
| Occupancy Type | # Households | Median Income |
| Owner-Occupied | 310,086 (68.5%) | $10,761,003 |
| Renter-Occupied | 142,713 (31.5%) | $5,691,663 |
| Average | 452,799 (100.0%) | $9,907,484 |
Occupancy by Householder Income Bracket in Area Code 719
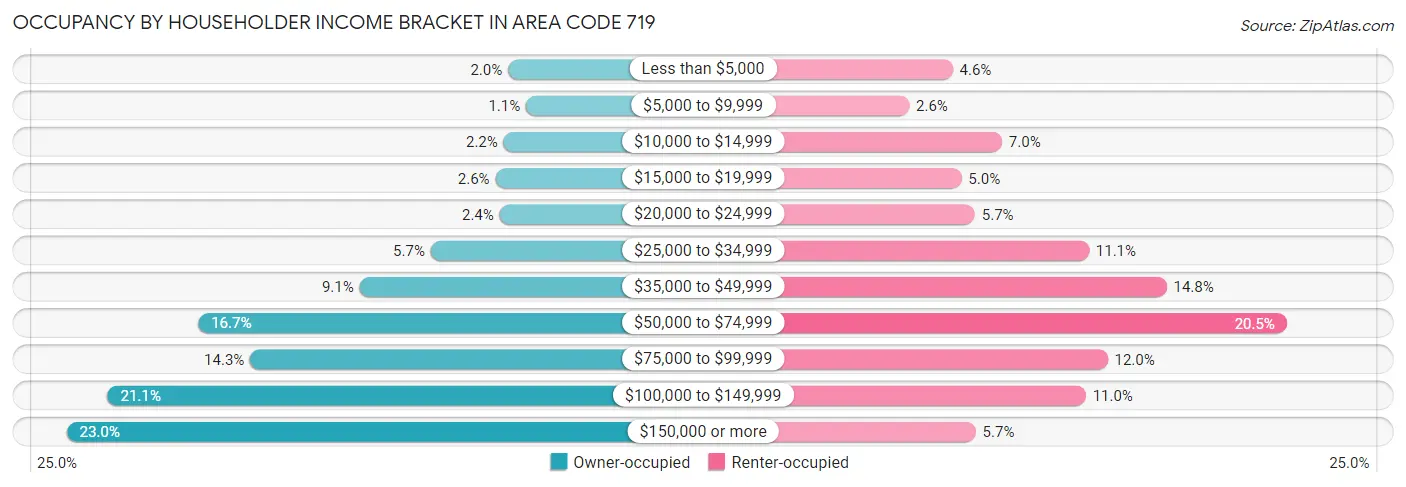
| Income Bracket | Owner-occupied | Renter-occupied |
| Less than $5,000 | 6,147 (2.0%) | 6,595 (4.6%) |
| $5,000 to $9,999 | 3,458 (1.1%) | 3,644 (2.5%) |
| $10,000 to $14,999 | 6,793 (2.2%) | 9,944 (7.0%) |
| $15,000 to $19,999 | 7,999 (2.6%) | 7,190 (5.0%) |
| $20,000 to $24,999 | 7,387 (2.4%) | 8,107 (5.7%) |
| $25,000 to $34,999 | 17,548 (5.7%) | 15,850 (11.1%) |
| $35,000 to $49,999 | 28,073 (9.0%) | 21,141 (14.8%) |
| $50,000 to $74,999 | 51,879 (16.7%) | 29,305 (20.5%) |
| $75,000 to $99,999 | 44,218 (14.3%) | 17,131 (12.0%) |
| $100,000 to $149,999 | 65,272 (21.0%) | 15,638 (11.0%) |
| $150,000 or more | 71,312 (23.0%) | 8,168 (5.7%) |
| Total | 310,086 (100.0%) | 142,713 (100.0%) |
Monthly Housing Cost Tiers in Area Code 719
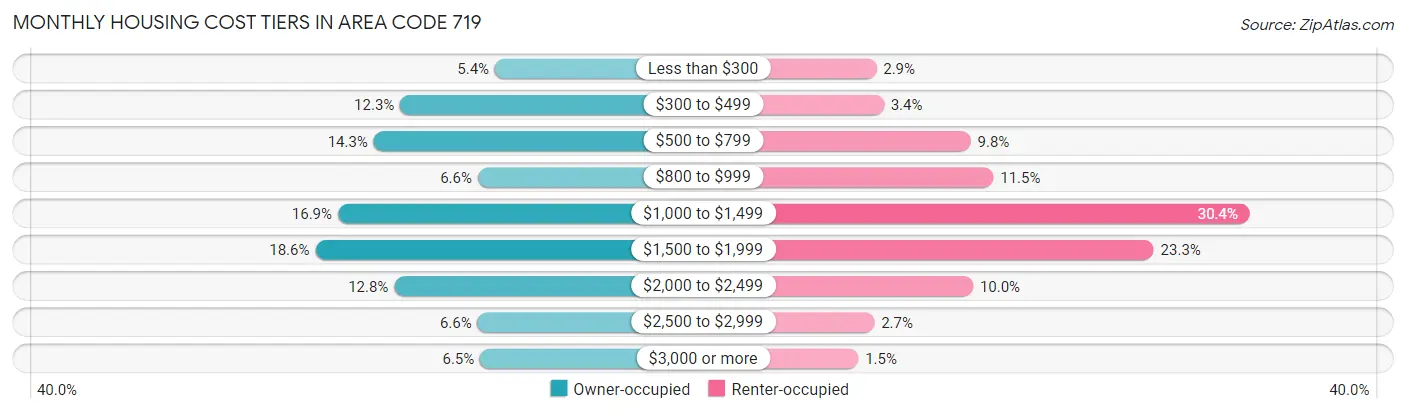
| Monthly Cost | Owner-occupied | Renter-occupied |
| Less than $300 | 16,633 (5.4%) | 4,077 (2.9%) |
| $300 to $499 | 38,257 (12.3%) | 4,868 (3.4%) |
| $500 to $799 | 44,318 (14.3%) | 14,000 (9.8%) |
| $800 to $999 | 20,526 (6.6%) | 16,381 (11.5%) |
| $1,000 to $1,499 | 52,487 (16.9%) | 43,336 (30.4%) |
| $1,500 to $1,999 | 57,642 (18.6%) | 33,237 (23.3%) |
| $2,000 to $2,499 | 39,640 (12.8%) | 14,242 (10.0%) |
| $2,500 to $2,999 | 20,590 (6.6%) | 3,874 (2.7%) |
| $3,000 or more | 19,993 (6.5%) | 2,179 (1.5%) |
| Total | 310,086 (100.0%) | 142,713 (100.0%) |
Physical Housing Characteristics in Area Code 719
Housing Structures in Area Code 719
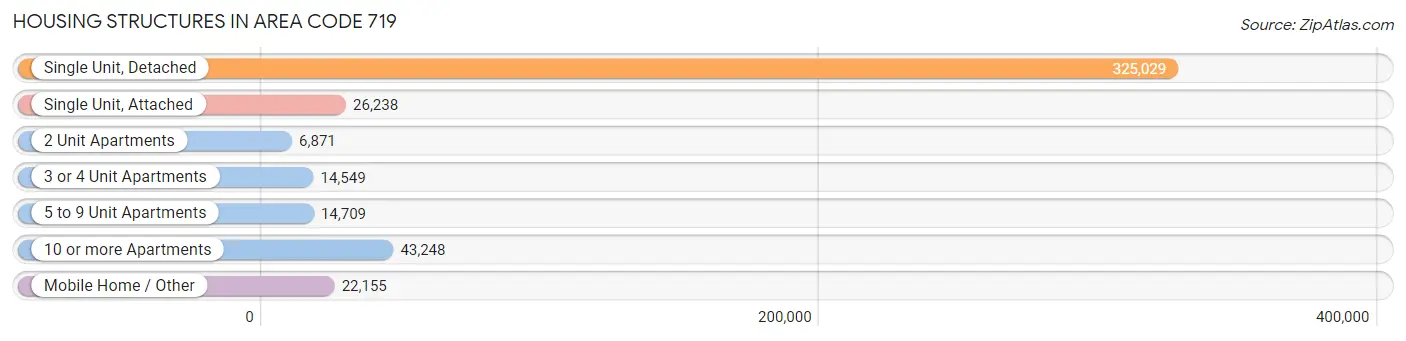
| Structure Type | # Housing Units | % Housing Units |
| Single Unit, Detached | 325,029 | 71.8% |
| Single Unit, Attached | 26,238 | 5.8% |
| 2 Unit Apartments | 6,871 | 1.5% |
| 3 or 4 Unit Apartments | 14,549 | 3.2% |
| 5 to 9 Unit Apartments | 14,709 | 3.3% |
| 10 or more Apartments | 43,248 | 9.6% |
| Mobile Home / Other | 22,155 | 4.9% |
| Total | 452,799 | 100.0% |
Housing Structures by Occupancy in Area Code 719
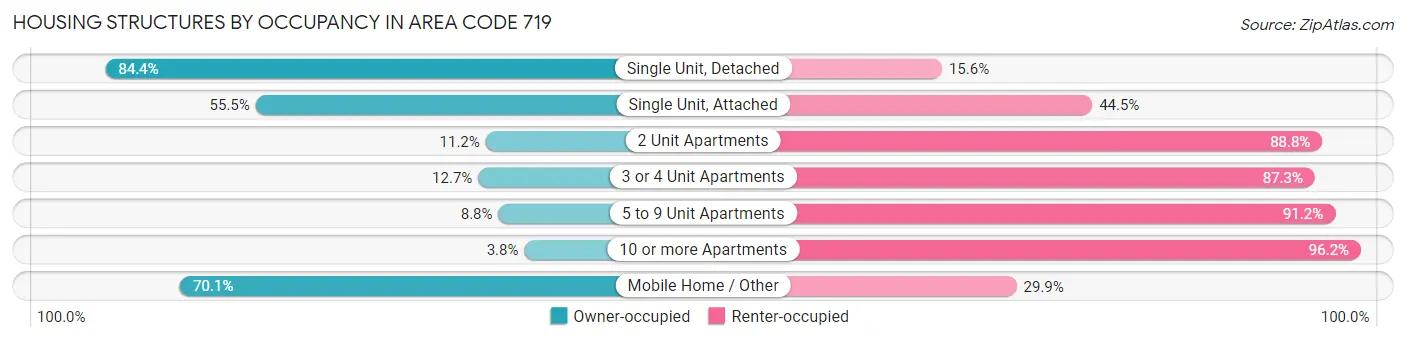
| Structure Type | Owner-occupied | Renter-occupied |
| Single Unit, Detached | 274,445 (84.4%) | 50,584 (15.6%) |
| Single Unit, Attached | 14,568 (55.5%) | 11,670 (44.5%) |
| 2 Unit Apartments | 772 (11.2%) | 6,099 (88.8%) |
| 3 or 4 Unit Apartments | 1,844 (12.7%) | 12,705 (87.3%) |
| 5 to 9 Unit Apartments | 1,292 (8.8%) | 13,417 (91.2%) |
| 10 or more Apartments | 1,641 (3.8%) | 41,607 (96.2%) |
| Mobile Home / Other | 15,524 (70.1%) | 6,631 (29.9%) |
| Total | 310,086 (68.5%) | 142,713 (31.5%) |
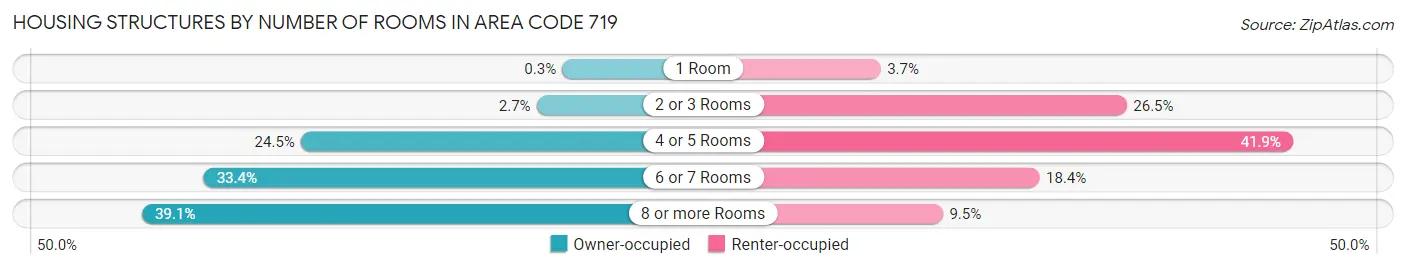
Housing Structures by Number of Rooms in Area Code 719
| Number of Rooms | Owner-occupied | Renter-occupied |
| 1 Room | 927 (0.3%) | 5,328 (3.7%) |
| 2 or 3 Rooms | 8,259 (2.7%) | 37,802 (26.5%) |
| 4 or 5 Rooms | 75,886 (24.5%) | 59,770 (41.9%) |
| 6 or 7 Rooms | 103,647 (33.4%) | 26,282 (18.4%) |
| 8 or more Rooms | 121,367 (39.1%) | 13,531 (9.5%) |
| Total | 310,086 (100.0%) | 142,713 (100.0%) |
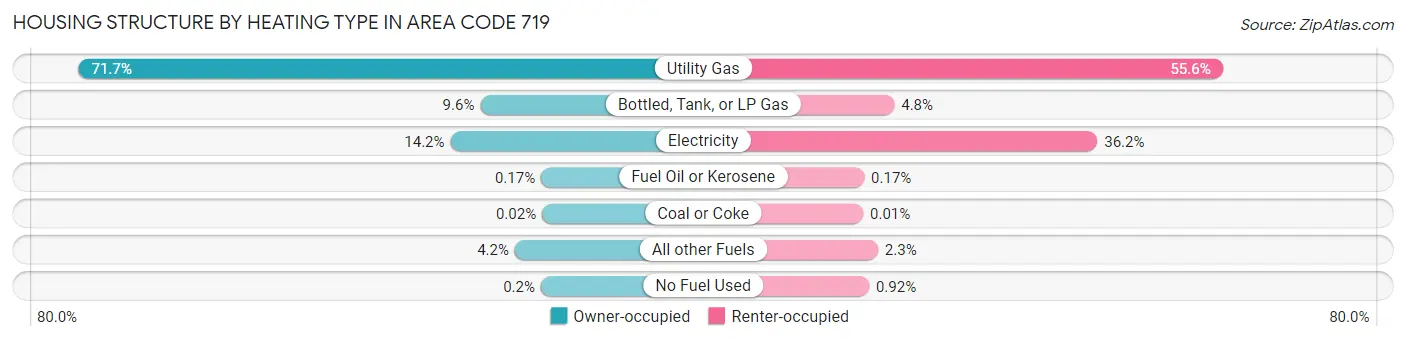
Housing Structure by Heating Type in Area Code 719
| Heating Type | Owner-occupied | Renter-occupied |
| Utility Gas | 222,164 (71.7%) | 79,292 (55.6%) |
| Bottled, Tank, or LP Gas | 29,648 (9.6%) | 6,895 (4.8%) |
| Electricity | 43,985 (14.2%) | 51,683 (36.2%) |
| Fuel Oil or Kerosene | 530 (0.2%) | 244 (0.2%) |
| Coal or Coke | 69 (0.0%) | 14 (0.0%) |
| All other Fuels | 13,071 (4.2%) | 3,279 (2.3%) |
| No Fuel Used | 619 (0.2%) | 1,306 (0.9%) |
| Total | 310,086 (100.0%) | 142,713 (100.0%) |
Household Vehicle Usage in Area Code 719
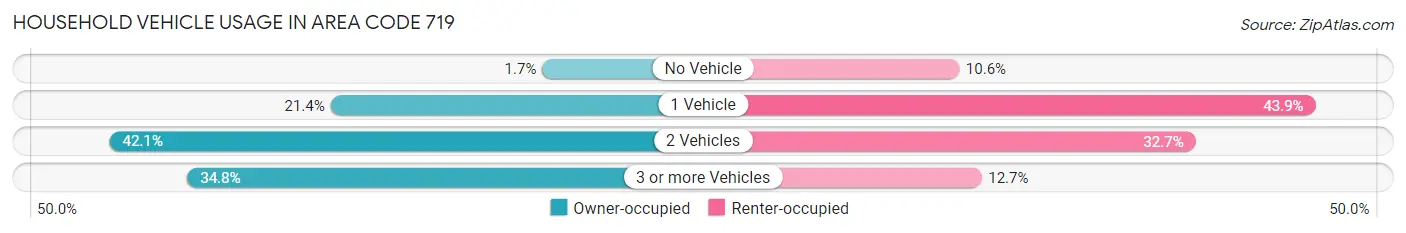
| Vehicles per Household | Owner-occupied | Renter-occupied |
| No Vehicle | 5,215 (1.7%) | 15,179 (10.6%) |
| 1 Vehicle | 66,484 (21.4%) | 62,673 (43.9%) |
| 2 Vehicles | 130,450 (42.1%) | 46,699 (32.7%) |
| 3 or more Vehicles | 107,937 (34.8%) | 18,162 (12.7%) |
| Total | 310,086 (100.0%) | 142,713 (100.0%) |
Real Estate & Mortgages in Area Code 719
Real Estate and Mortgage Overview in Area Code 719
| Characteristic | Without Mortgage | With Mortgage |
| Housing Units | 103,223 | 206,863 |
| Median Property Value | $37,566,099 | $41,466,500 |
| Median Household Income | $9,185,592 | $55,772 |
| Monthly Housing Costs | $72,674 | $19,768 |
| Real Estate Taxes | $144,582 | $4,262 |
Property Value by Mortgage Status in Area Code 719
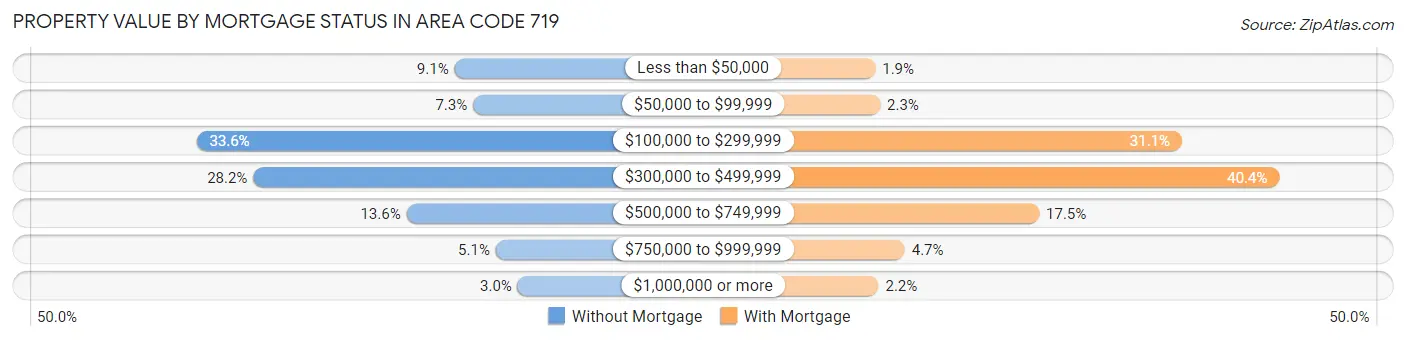
| Property Value | Without Mortgage | With Mortgage |
| Less than $50,000 | 9,351 (9.1%) | 3,884 (1.9%) |
| $50,000 to $99,999 | 7,524 (7.3%) | 4,837 (2.3%) |
| $100,000 to $299,999 | 34,709 (33.6%) | 64,297 (31.1%) |
| $300,000 to $499,999 | 29,145 (28.2%) | 83,463 (40.4%) |
| $500,000 to $749,999 | 14,066 (13.6%) | 36,158 (17.5%) |
| $750,000 to $999,999 | 5,293 (5.1%) | 9,693 (4.7%) |
| $1,000,000 or more | 3,135 (3.0%) | 4,531 (2.2%) |
| Total | 103,223 (100.0%) | 206,863 (100.0%) |
Household Income by Mortgage Status in Area Code 719
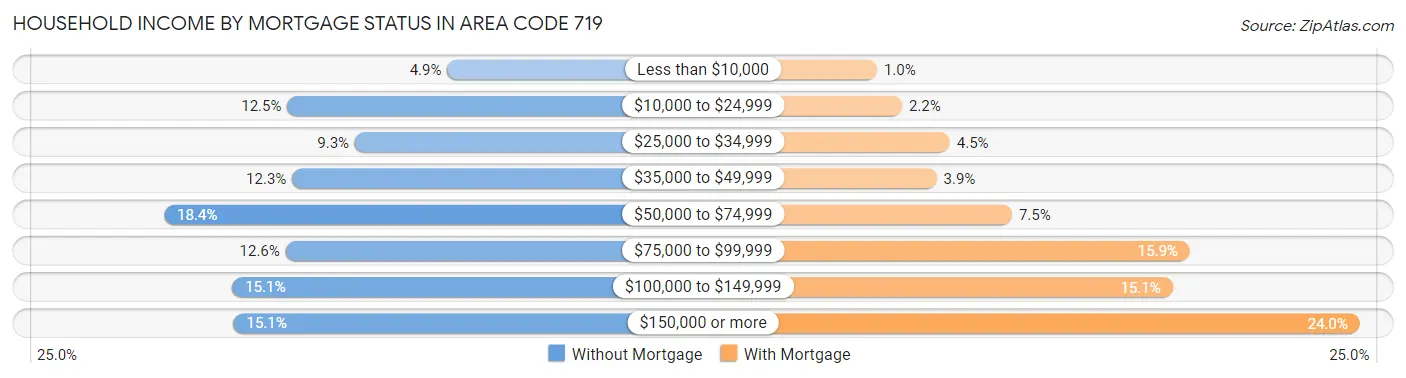
| Household Income | Without Mortgage | With Mortgage |
| Less than $10,000 | 5,028 (4.9%) | 2,102 (1.0%) |
| $10,000 to $24,999 | 12,892 (12.5%) | 4,577 (2.2%) |
| $25,000 to $34,999 | 9,573 (9.3%) | 9,287 (4.5%) |
| $35,000 to $49,999 | 12,654 (12.3%) | 7,975 (3.9%) |
| $50,000 to $74,999 | 18,956 (18.4%) | 15,419 (7.4%) |
| $75,000 to $99,999 | 12,978 (12.6%) | 32,923 (15.9%) |
| $100,000 to $149,999 | 15,602 (15.1%) | 31,240 (15.1%) |
| $150,000 or more | 15,540 (15.0%) | 49,670 (24.0%) |
| Total | 103,223 (100.0%) | 206,863 (100.0%) |
Property Value to Household Income Ratio in Area Code 719
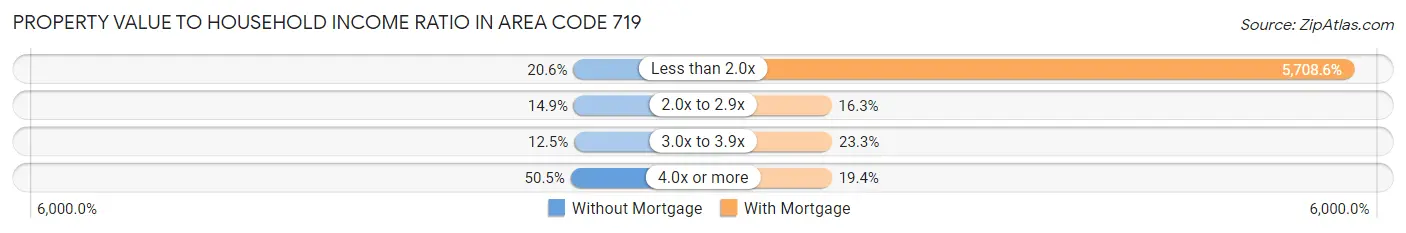
| Value-to-Income Ratio | Without Mortgage | With Mortgage |
| Less than 2.0x | 21,309 (20.6%) | 11,808,963 (5,708.6%) |
| 2.0x to 2.9x | 15,407 (14.9%) | 33,656 (16.3%) |
| 3.0x to 3.9x | 12,925 (12.5%) | 48,135 (23.3%) |
| 4.0x or more | 52,102 (50.5%) | 40,026 (19.4%) |
| Total | 103,223 (100.0%) | 206,863 (100.0%) |
Real Estate Taxes by Mortgage Status in Area Code 719
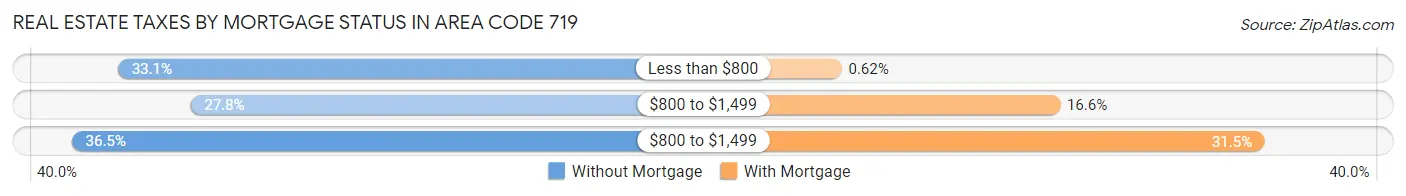
| Property Taxes | Without Mortgage | With Mortgage |
| Less than $800 | 34,192 (33.1%) | 1,287 (0.6%) |
| $800 to $1,499 | 28,716 (27.8%) | 34,294 (16.6%) |
| $800 to $1,499 | 37,670 (36.5%) | 65,113 (31.5%) |
| Total | 103,223 (100.0%) | 206,863 (100.0%) |
Health & Disability in Area Code 719
Health Insurance Coverage by Age in Area Code 719
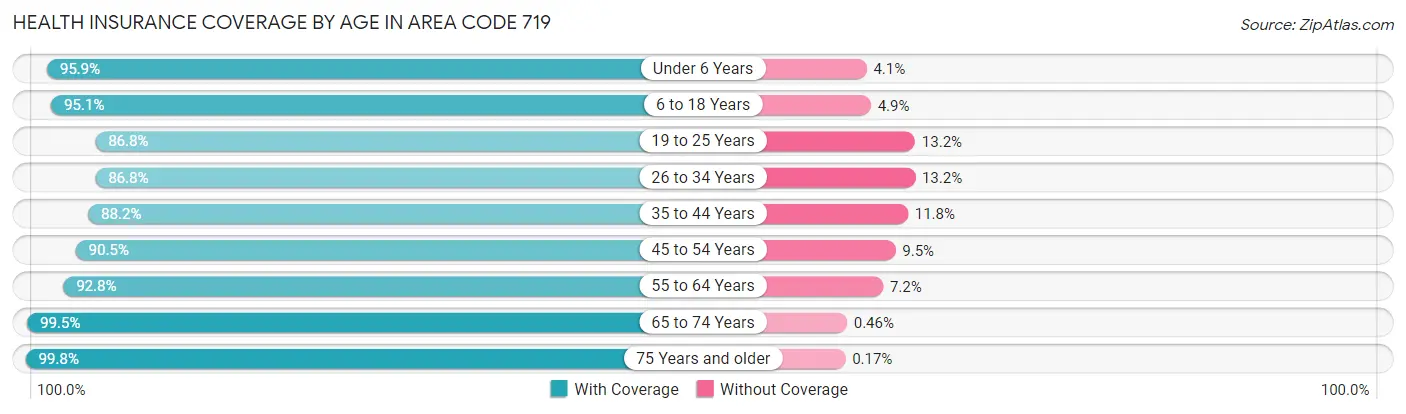
| Age Bracket | With Coverage | Without Coverage |
| Under 6 Years | 78,261 (95.9%) | 3,379 (4.1%) |
| 6 to 18 Years | 184,035 (95.1%) | 9,551 (4.9%) |
| 19 to 25 Years | 86,797 (86.8%) | 13,167 (13.2%) |
| 26 to 34 Years | 120,517 (86.8%) | 18,303 (13.2%) |
| 35 to 44 Years | 124,580 (88.2%) | 16,730 (11.8%) |
| 45 to 54 Years | 117,602 (90.5%) | 12,369 (9.5%) |
| 55 to 64 Years | 135,615 (92.8%) | 10,545 (7.2%) |
| 65 to 74 Years | 113,555 (99.5%) | 526 (0.5%) |
| 75 Years and older | 68,300 (99.8%) | 113 (0.2%) |
| Total | 1,029,262 (92.4%) | 84,683 (7.6%) |
Health Insurance Coverage by Citizenship Status in Area Code 719
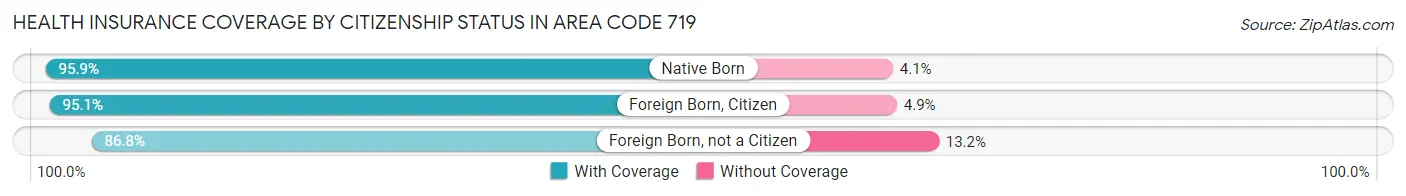
| Citizenship Status | With Coverage | Without Coverage |
| Native Born | 78,261 (95.9%) | 3,379 (4.1%) |
| Foreign Born, Citizen | 184,035 (95.1%) | 9,551 (4.9%) |
| Foreign Born, not a Citizen | 86,797 (86.8%) | 13,167 (13.2%) |
Health Insurance Coverage by Household Income in Area Code 719
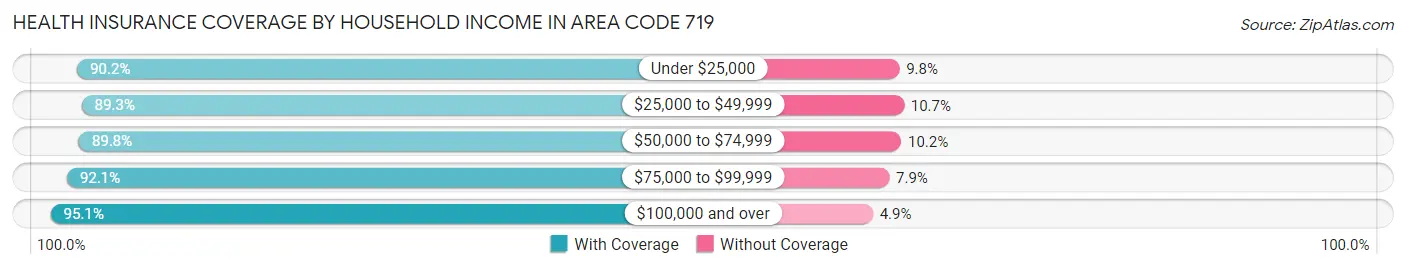
| Household Income | With Coverage | Without Coverage |
| Under $25,000 | 100,986 (90.2%) | 10,998 (9.8%) |
| $25,000 to $49,999 | 150,012 (89.3%) | 17,934 (10.7%) |
| $50,000 to $74,999 | 166,299 (89.8%) | 18,830 (10.2%) |
| $75,000 to $99,999 | 146,690 (92.1%) | 12,618 (7.9%) |
| $100,000 and over | 456,898 (95.1%) | 23,352 (4.9%) |
Public vs Private Health Insurance Coverage by Age in Area Code 719
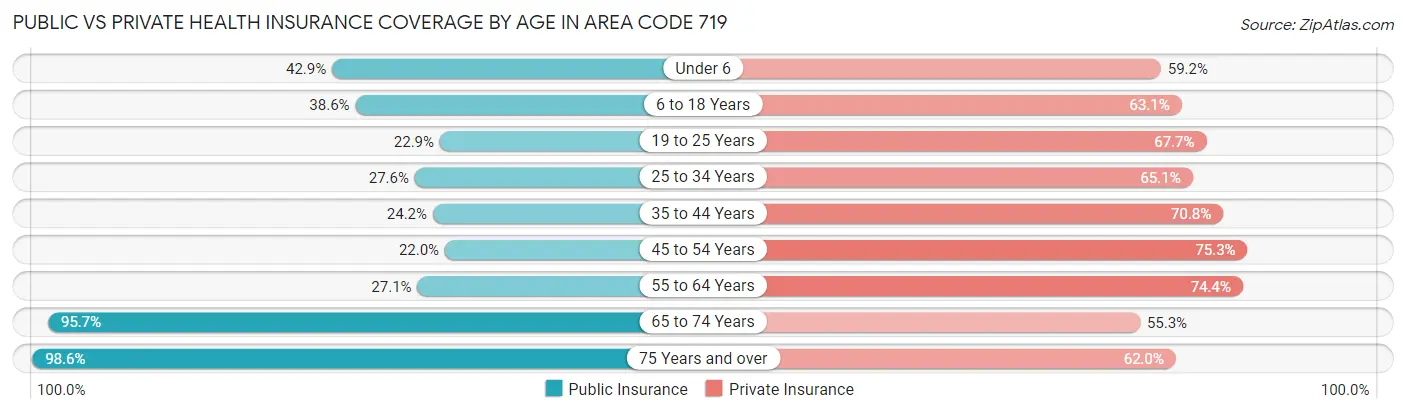
| Age Bracket | Public Insurance | Private Insurance |
| Under 6 | 35,044 (42.9%) | 48,341 (59.2%) |
| 6 to 18 Years | 74,721 (38.6%) | 122,100 (63.1%) |
| 19 to 25 Years | 22,908 (22.9%) | 67,632 (67.7%) |
| 25 to 34 Years | 38,277 (27.6%) | 90,360 (65.1%) |
| 35 to 44 Years | 34,224 (24.2%) | 100,012 (70.8%) |
| 45 to 54 Years | 28,573 (22.0%) | 97,861 (75.3%) |
| 55 to 64 Years | 39,588 (27.1%) | 108,766 (74.4%) |
| 65 to 74 Years | 109,169 (95.7%) | 63,127 (55.3%) |
| 75 Years and over | 67,442 (98.6%) | 42,409 (62.0%) |
| Total | 449,946 (40.4%) | 740,608 (66.5%) |
Disability Status by Sex by Age in Area Code 719
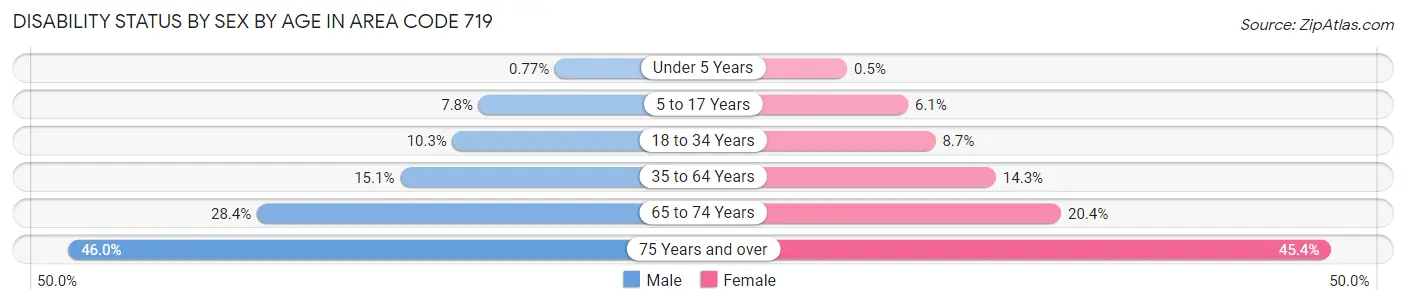
| Age Bracket | Male | Female |
| Under 5 Years | 270 (0.8%) | 164 (0.5%) |
| 5 to 17 Years | 7,733 (7.8%) | 5,785 (6.1%) |
| 18 to 34 Years | 13,144 (10.3%) | 10,897 (8.7%) |
| 35 to 64 Years | 31,160 (15.1%) | 30,254 (14.3%) |
| 65 to 74 Years | 15,623 (28.4%) | 12,030 (20.3%) |
| 75 Years and over | 13,657 (46.0%) | 17,571 (45.4%) |
Disability Class by Sex by Age in Area Code 719
Disability Class: Hearing Difficulty
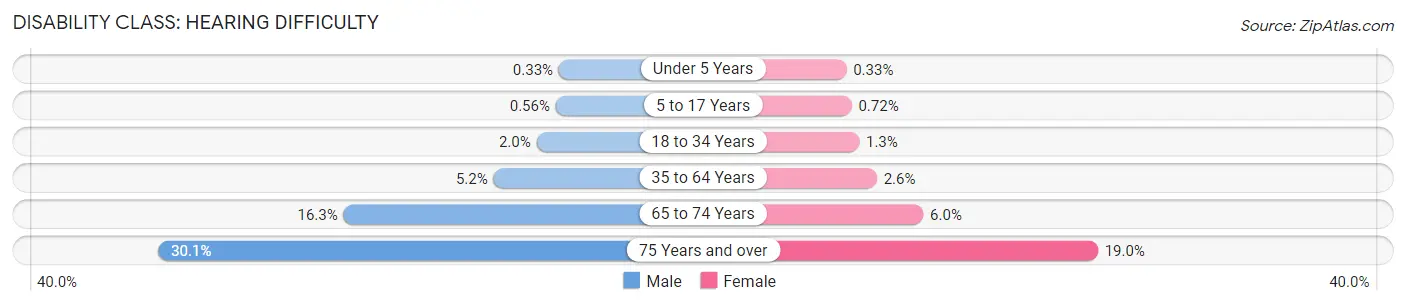
| Age Bracket | Male | Female |
| Under 5 Years | 115 (0.3%) | 107 (0.3%) |
| 5 to 17 Years | 551 (0.6%) | 680 (0.7%) |
| 18 to 34 Years | 2,552 (2.0%) | 1,607 (1.3%) |
| 35 to 64 Years | 10,670 (5.2%) | 5,482 (2.6%) |
| 65 to 74 Years | 8,972 (16.3%) | 3,571 (6.0%) |
| 75 Years and over | 8,943 (30.1%) | 7,352 (19.0%) |
Disability Class: Vision Difficulty
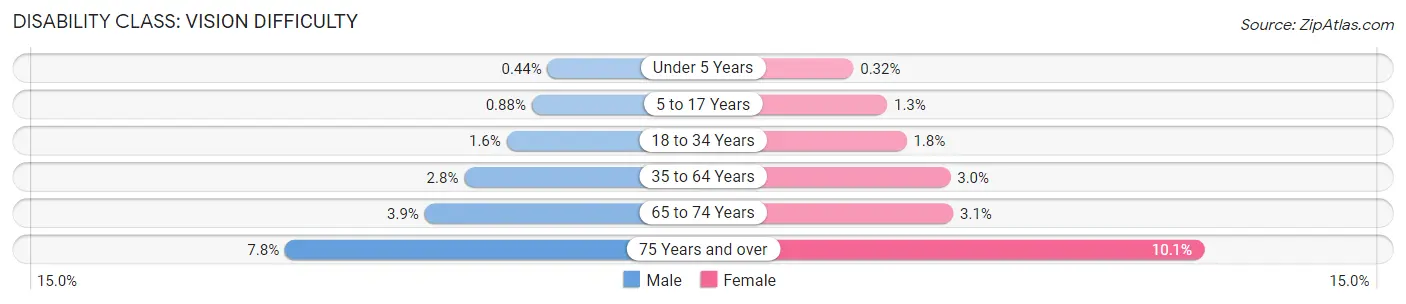
| Age Bracket | Male | Female |
| Under 5 Years | 155 (0.4%) | 106 (0.3%) |
| 5 to 17 Years | 868 (0.9%) | 1,191 (1.3%) |
| 18 to 34 Years | 2,021 (1.6%) | 2,252 (1.8%) |
| 35 to 64 Years | 5,685 (2.8%) | 6,395 (3.0%) |
| 65 to 74 Years | 2,122 (3.9%) | 1,833 (3.1%) |
| 75 Years and over | 2,304 (7.7%) | 3,900 (10.1%) |
Disability Class: Cognitive Difficulty
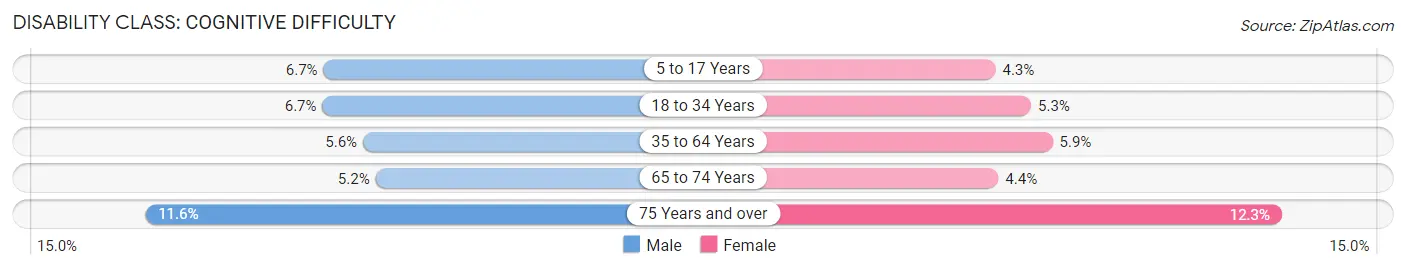
| Age Bracket | Male | Female |
| 5 to 17 Years | 6,587 (6.7%) | 4,027 (4.3%) |
| 18 to 34 Years | 8,584 (6.7%) | 6,612 (5.3%) |
| 35 to 64 Years | 11,491 (5.6%) | 12,426 (5.9%) |
| 65 to 74 Years | 2,873 (5.2%) | 2,576 (4.4%) |
| 75 Years and over | 3,461 (11.6%) | 4,738 (12.2%) |
Disability Class: Ambulatory Difficulty
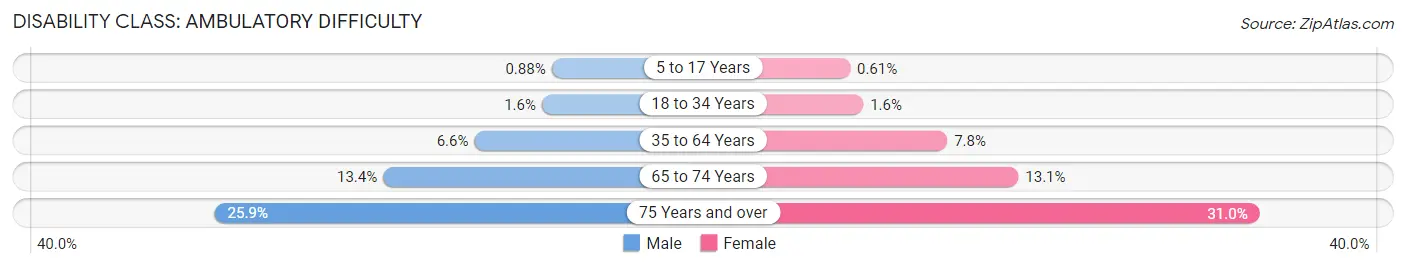
| Age Bracket | Male | Female |
| 5 to 17 Years | 871 (0.9%) | 577 (0.6%) |
| 18 to 34 Years | 2,052 (1.6%) | 1,987 (1.6%) |
| 35 to 64 Years | 13,608 (6.6%) | 16,579 (7.8%) |
| 65 to 74 Years | 7,359 (13.4%) | 7,751 (13.1%) |
| 75 Years and over | 7,694 (25.9%) | 11,999 (31.0%) |
Disability Class: Self-Care Difficulty
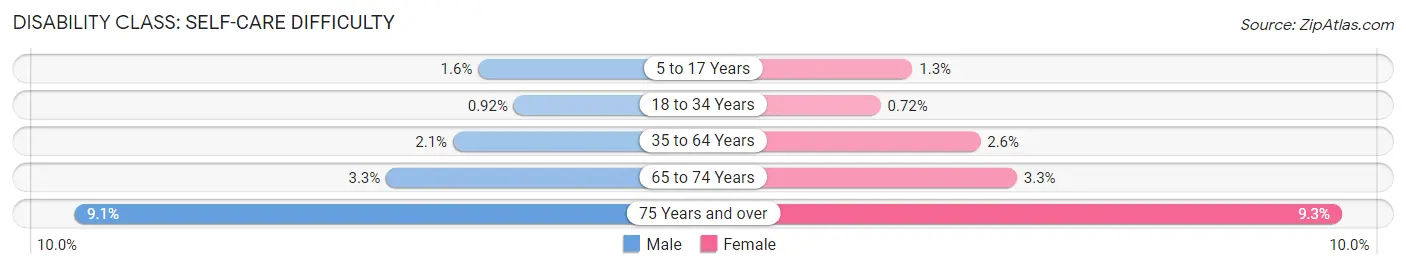
| Age Bracket | Male | Female |
| 5 to 17 Years | 1,557 (1.6%) | 1,231 (1.3%) |
| 18 to 34 Years | 1,177 (0.9%) | 898 (0.7%) |
| 35 to 64 Years | 4,211 (2.1%) | 5,430 (2.6%) |
| 65 to 74 Years | 1,807 (3.3%) | 1,922 (3.3%) |
| 75 Years and over | 2,698 (9.1%) | 3,589 (9.3%) |
Technology Access in Area Code 719
Computing Device Access in Area Code 719
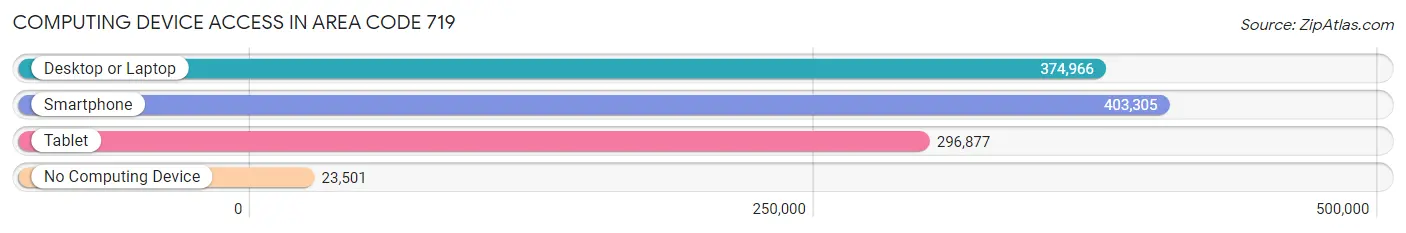
| Device Type | # Households | % Households |
| Desktop or Laptop | 374,966 | 82.8% |
| Smartphone | 403,305 | 89.1% |
| Tablet | 296,877 | 65.6% |
| No Computing Device | 23,501 | 5.2% |
| Total | 452,799 | 100.0% |
Internet Access in Area Code 719
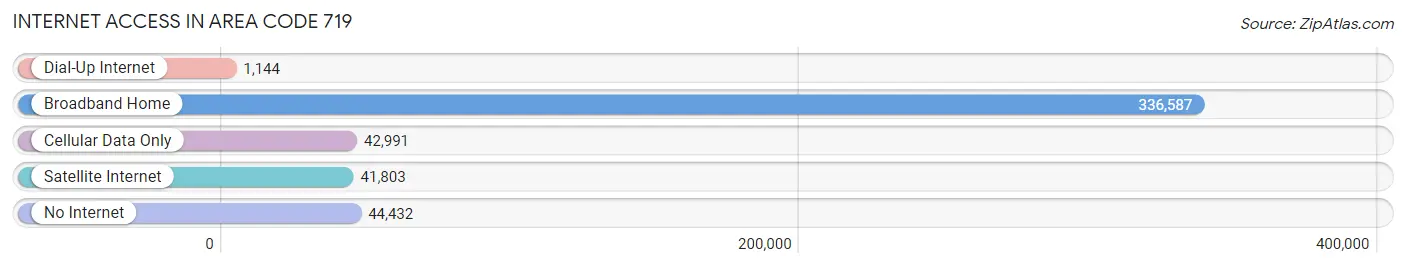
| Internet Type | # Households | % Households |
| Dial-Up Internet | 1,144 | 0.3% |
| Broadband Home | 336,587 | 74.3% |
| Cellular Data Only | 42,991 | 9.5% |
| Satellite Internet | 41,803 | 9.2% |
| No Internet | 44,432 | 9.8% |
| Total | 452,799 | 100.0% |
Area Code 719 Summary
Geography
Area code 719 is located in the state of Colorado and covers the southern portion of the state, including the cities of Colorado Springs, Pueblo, and Canon City. It also covers parts of the San Luis Valley, the Sangre de Cristo Mountains, and the Wet Mountain Valley.
Social
Area code 719 is home to a diverse population of people from all walks of life. The area is known for its outdoor activities, such as skiing, hiking, and camping, as well as its vibrant arts and culture scene. The area is also home to a number of military bases, including the United States Air Force Academy and Fort Carson.
Economics
Area code 719 is home to a number of major employers, including the University of Colorado at Colorado Springs, the United States Air Force Academy, and the United States Olympic Training Center. The area is also home to a number of technology companies, such as Hewlett Packard and Lockheed Martin.
Demographics
Area code 719 is home to a population of over 1.5 million people. The population is largely white, with a significant Hispanic population. The median household income is around $60,000, and the unemployment rate is around 4%. The area is also home to a number of military personnel and their families.
Common Questions
What is Per Capita Income in Area Code 719?
Per Capita income in Area Code 719 is $35,788.
What is the Median Family Income in Area Code 719?
Median Family Income in Area Code 719 is $80,128.
What is the Median Household income in Area Code 719?
Median Household Income in Area Code 719 is $64,755.
What is Income or Wage Gap in Area Code 719?
Income or Wage Gap in Area Code 719 is 29.7%.
Women in Area Code 719 earn 70.3 cents for every dollar earned by a man.
What is Family Income Deficit in Area Code 719?
Family Income Deficit in Area Code 719 is $10,861.
Families that are below poverty line in Area Code 719 earn $10,861 less on average than the poverty threshold level.
What is Inequality or Gini Index in Area Code 719?
Inequality or Gini Index in Area Code 719 is 68.17.
What is the Total Population of Area Code 719?
Total Population of Area Code 719 is 1,170,409.
What is the Total Male Population of Area Code 719?
Total Male Population of Area Code 719 is 599,929.
What is the Total Female Population of Area Code 719?
Total Female Population of Area Code 719 is 570,480.
What is the Ratio of Males per 100 Females in Area Code 719?
There are 105.16 Males per 100 Females in Area Code 719.
What is the Ratio of Females per 100 Males in Area Code 719?
There are 95.09 Females per 100 Males in Area Code 719.
What is the Median Population Age in Area Code 719?
Median Population Age in Area Code 719 is 44.8 Years.
What is the Average Family Size in Area Code 719
Average Family Size in Area Code 719 is 2.9 People.
What is the Average Household Size in Area Code 719
Average Household Size in Area Code 719 is 2.4 People.
How Large is the Labor Force in Area Code 719?
There are 539,260 People in the Labor Forcein in Area Code 719.
What is the Percentage of People in the Labor Force in Area Code 719?
57.5% of People are in the Labor Force in Area Code 719.
What is the Unemployment Rate in Area Code 719?
Unemployment Rate in Area Code 719 is 6.2%.