Area Code 318 Map & Demographics
Area Code 318 Map
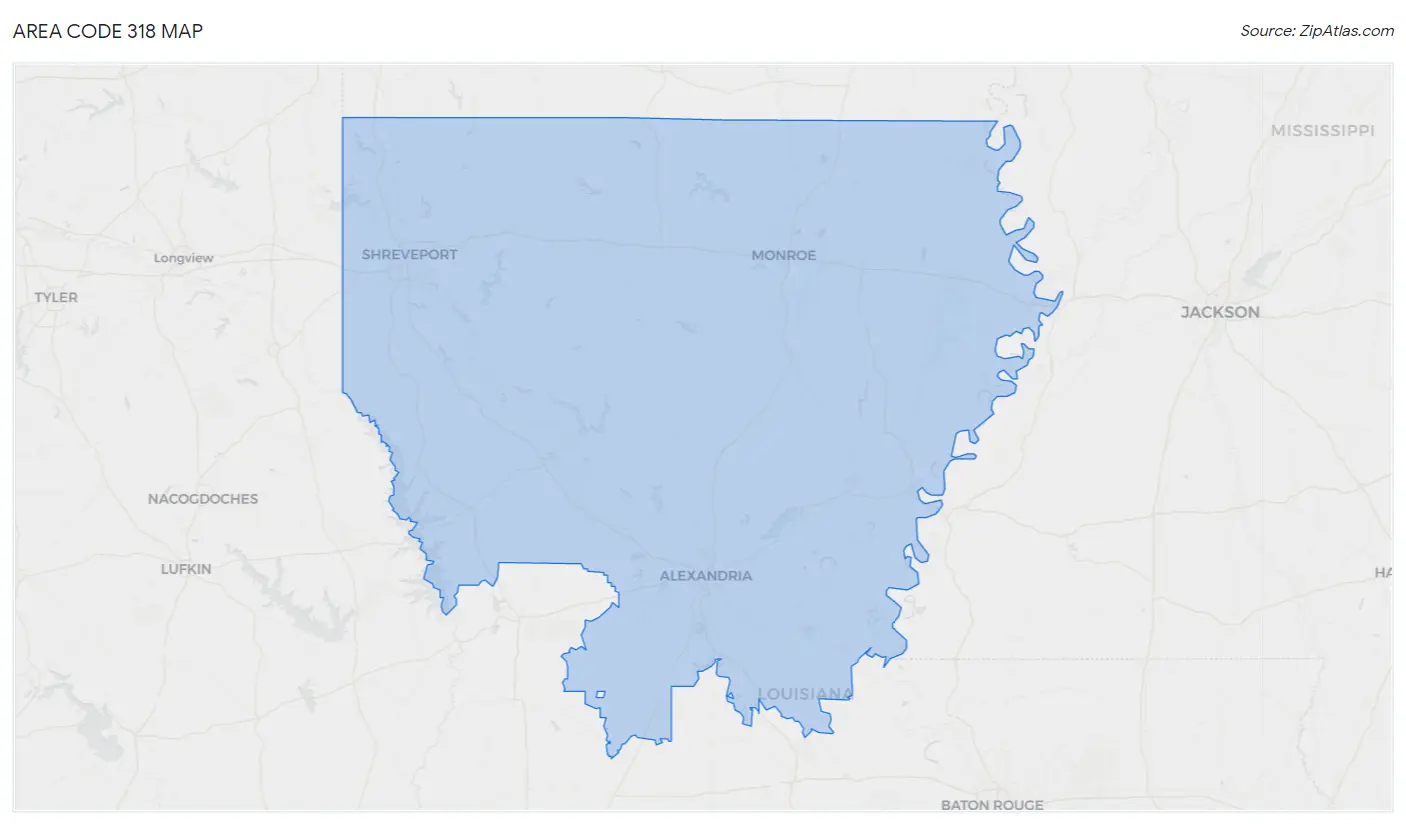
Area Code 318 Overview
$26,051
PER CAPITA INCOME
$62,180
AVG FAMILY INCOME
$46,489
AVG HOUSEHOLD INCOME
33.2%
WAGE / INCOME GAP [ % ]
66.8¢/ $1
WAGE / INCOME GAP [ $ ]
$11,066
FAMILY INCOME DEFICIT
88.59
INEQUALITY / GINI INDEX
1,122,258
TOTAL POPULATION
552,392
MALE POPULATION
569,866
FEMALE POPULATION
96.93
MALES / 100 FEMALES
103.16
FEMALES / 100 MALES
40.9
MEDIAN AGE
3.2
AVG FAMILY SIZE
2.5
AVG HOUSEHOLD SIZE
457,258
LABOR FORCE [ PEOPLE ]
51.3%
PERCENT IN LABOR FORCE
8.4%
UNEMPLOYMENT RATE
Income in Area Code 318
Income Overview in Area Code 318
Per Capita Income in Area Code 318 is $26,051, while median incomes of families and households are $62,180 and $46,489 respectively.
| Characteristic | Number | Measure |
| Per Capita Income | 1,122,258 | $26,051 |
| Median Family Income | 265,634 | $62,180 |
| Mean Family Income | 265,634 | $14,635,702 |
| Median Household Income | 422,260 | $46,489 |
| Mean Household Income | 422,260 | $12,365,317 |
| Income Deficit | 265,634 | $11,066 |
| Wage / Income Gap (%) | 1,122,258 | 33.19% |
| Wage / Income Gap ($) | 1,122,258 | 66.81¢ per $1 |
| Gini / Inequality Index | 1,122,258 | 88.59 |
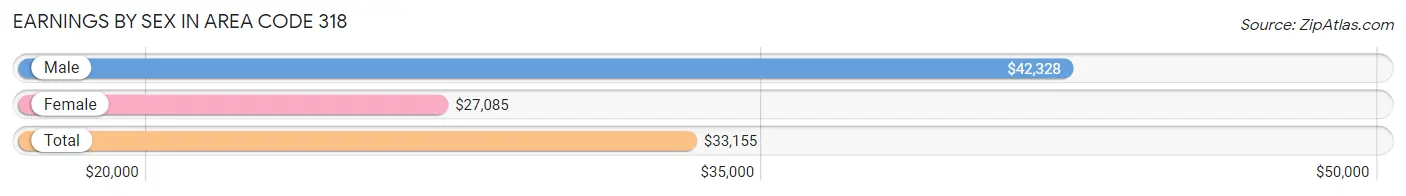
Earnings by Sex in Area Code 318
Average Earnings in Area Code 318 are $33,155, $42,328 for men and $27,085 for women, a difference of 36.0%.
| Sex | Number | Average Earnings |
| Male | 255,384 (51.3%) | $42,328 |
| Female | 242,358 (48.7%) | $27,085 |
| Total | 497,742 (100.0%) | $33,155 |
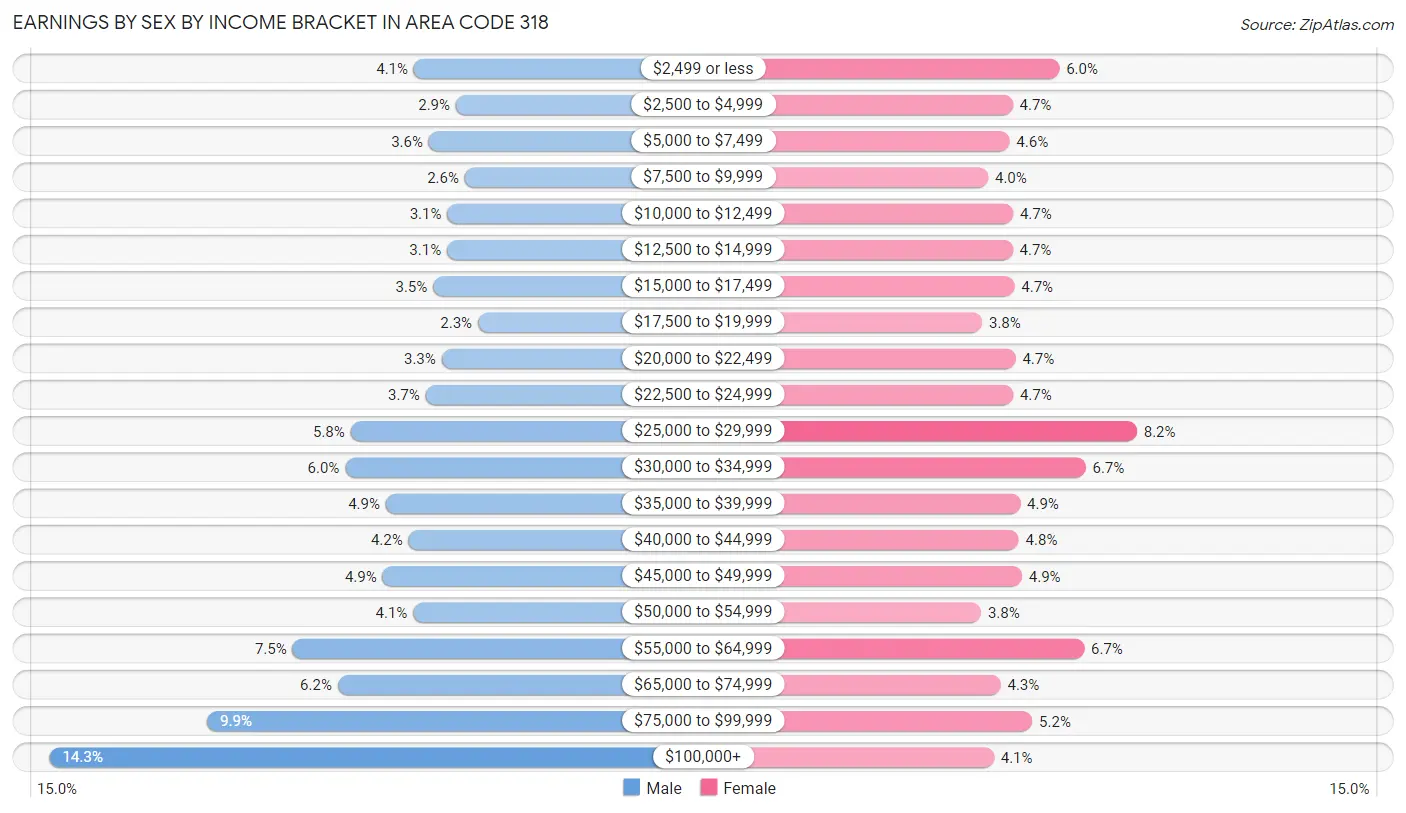
Earnings by Sex by Income Bracket in Area Code 318
The most common earnings brackets in Area Code 318 are $100,000+ for men (36,527 | 14.3%) and $25,000 to $29,999 for women (19,753 | 8.2%).
| Income | Male | Female |
| $2,499 or less | 10,380 (4.1%) | 14,473 (6.0%) |
| $2,500 to $4,999 | 7,348 (2.9%) | 11,286 (4.7%) |
| $5,000 to $7,499 | 9,293 (3.6%) | 11,075 (4.6%) |
| $7,500 to $9,999 | 6,721 (2.6%) | 9,614 (4.0%) |
| $10,000 to $12,499 | 7,966 (3.1%) | 11,323 (4.7%) |
| $12,500 to $14,999 | 7,996 (3.1%) | 11,304 (4.7%) |
| $15,000 to $17,499 | 8,978 (3.5%) | 11,427 (4.7%) |
| $17,500 to $19,999 | 5,765 (2.3%) | 9,199 (3.8%) |
| $20,000 to $22,499 | 8,370 (3.3%) | 11,478 (4.7%) |
| $22,500 to $24,999 | 9,537 (3.7%) | 11,325 (4.7%) |
| $25,000 to $29,999 | 14,909 (5.8%) | 19,753 (8.2%) |
| $30,000 to $34,999 | 15,306 (6.0%) | 16,273 (6.7%) |
| $35,000 to $39,999 | 12,386 (4.9%) | 11,799 (4.9%) |
| $40,000 to $44,999 | 10,764 (4.2%) | 11,704 (4.8%) |
| $45,000 to $49,999 | 12,611 (4.9%) | 11,916 (4.9%) |
| $50,000 to $54,999 | 10,407 (4.1%) | 9,140 (3.8%) |
| $55,000 to $64,999 | 19,084 (7.5%) | 16,163 (6.7%) |
| $65,000 to $74,999 | 15,827 (6.2%) | 10,481 (4.3%) |
| $75,000 to $99,999 | 25,209 (9.9%) | 12,621 (5.2%) |
| $100,000+ | 36,527 (14.3%) | 10,004 (4.1%) |
| Total | 255,384 (100.0%) | 242,358 (100.0%) |
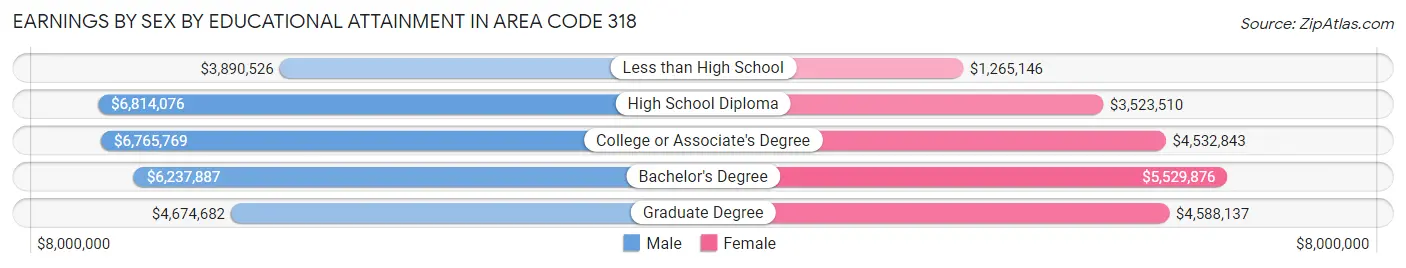
Earnings by Sex by Educational Attainment in Area Code 318
Average earnings in Area Code 318 are $7,888,352 for men and $5,067,327 for women, a difference of 35.8%. Men with an educational attainment of high school diploma enjoy the highest average annual earnings of $6,814,076, while those with less than high school education earn the least with $3,890,526. Women with an educational attainment of bachelor's degree earn the most with the average annual earnings of $5,529,876, while those with less than high school education have the smallest earnings of $1,265,146.
| Educational Attainment | Male Income | Female Income |
| Less than High School | $3,890,526 | $1,265,146 |
| High School Diploma | $6,814,076 | $3,523,510 |
| College or Associate's Degree | $6,765,769 | $4,532,843 |
| Bachelor's Degree | $6,237,887 | $5,529,876 |
| Graduate Degree | $4,674,682 | $4,588,137 |
| Total | $7,888,352 | $5,067,327 |
Family Income in Area Code 318
Family Income Brackets in Area Code 318
According to the Area Code 318 family income data, there are 9,304,628 families falling into the $50,000 to $74,999 income range, which is the most common income bracket and makes up 3,502.8% of all families. Conversely, the $10,000 to $14,999 income bracket is the least frequent group with only 2,252,842 families (848.1%) belonging to this category.
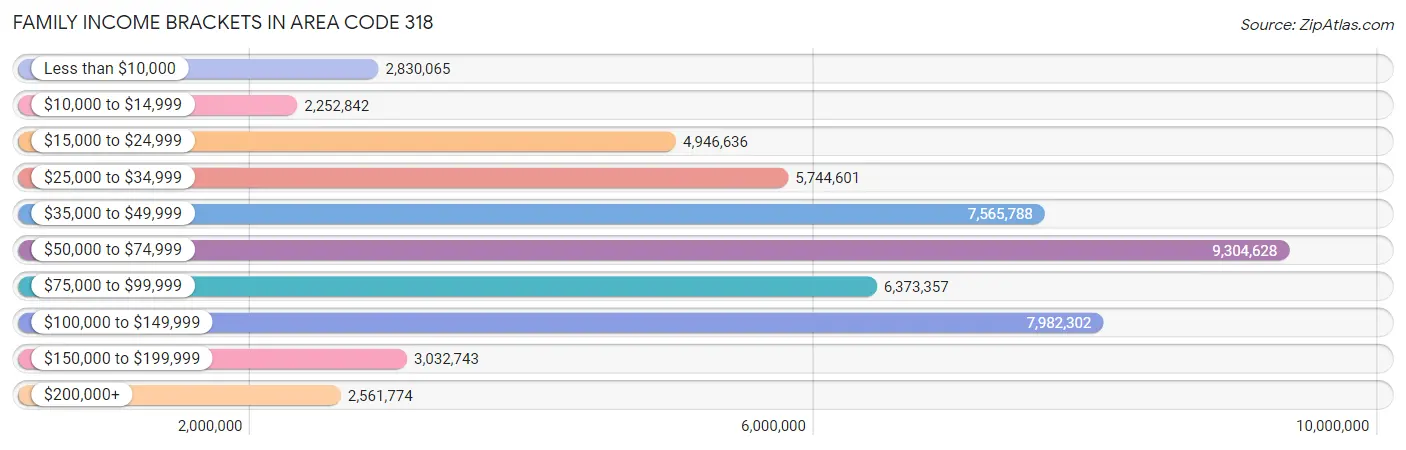
| Income Bracket | # Families | % Families |
| Less than $10,000 | 2,830,065 | 1,065.4% |
| $10,000 to $14,999 | 2,252,842 | 848.1% |
| $15,000 to $24,999 | 4,946,636 | 1,862.2% |
| $25,000 to $34,999 | 5,744,601 | 2,162.6% |
| $35,000 to $49,999 | 7,565,788 | 2,848.2% |
| $50,000 to $74,999 | 9,304,628 | 3,502.8% |
| $75,000 to $99,999 | 6,373,357 | 2,399.3% |
| $100,000 to $149,999 | 7,982,302 | 3,005.0% |
| $150,000 to $199,999 | 3,032,743 | 1,141.7% |
| $200,000+ | 2,561,774 | 964.4% |
Family Income by Famaliy Size in Area Code 318
7+ person families (3,172 | 1.2%) account for the highest median family income in Area Code 318 with $92,546 per family, while 2-person families (129,309 | 48.7%) have the highest median income of $30,072 per family member.
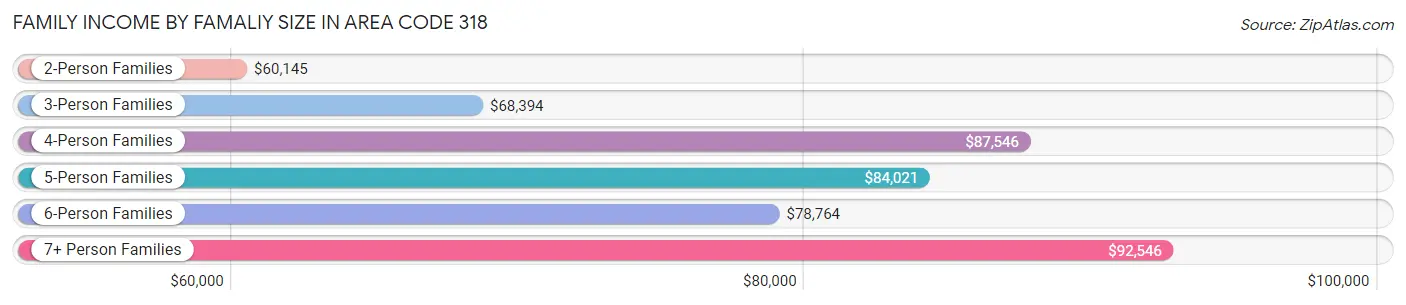
| Income Bracket | # Families | Median Income |
| 2-Person Families | 129,309 (48.7%) | $60,145 |
| 3-Person Families | 64,245 (24.2%) | $68,394 |
| 4-Person Families | 42,588 (16.0%) | $87,546 |
| 5-Person Families | 20,176 (7.6%) | $84,021 |
| 6-Person Families | 6,144 (2.3%) | $78,764 |
| 7+ Person Families | 3,172 (1.2%) | $92,546 |
| Total | 265,634 (100.0%) | $62,180 |
Family Income by Number of Earners in Area Code 318
The median family income in Area Code 318 is $62,180, with families comprising 3+ earners (17,508) having the highest median family income of $125,229, while families with no earners (52,972) have the lowest median family income of $35,715, accounting for 6.6% and 19.9% of families, respectively.
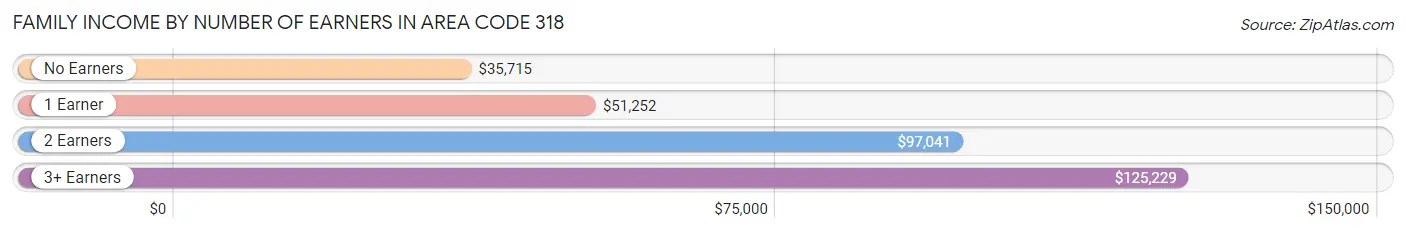
| Number of Earners | # Families | Median Income |
| No Earners | 52,972 (19.9%) | $35,715 |
| 1 Earner | 102,437 (38.6%) | $51,252 |
| 2 Earners | 92,717 (34.9%) | $97,041 |
| 3+ Earners | 17,508 (6.6%) | $125,229 |
| Total | 265,634 (100.0%) | $62,180 |
Household Income in Area Code 318
Household Income Brackets in Area Code 318
With 12,660,199 households falling in the category, the $50,000 to $74,999 income range is the most frequent in Area Code 318, accounting for 2,998.2% of all households. In contrast, only 3,483,223 households (824.9%) fall into the $200,000+ income bracket, making it the least populous group.
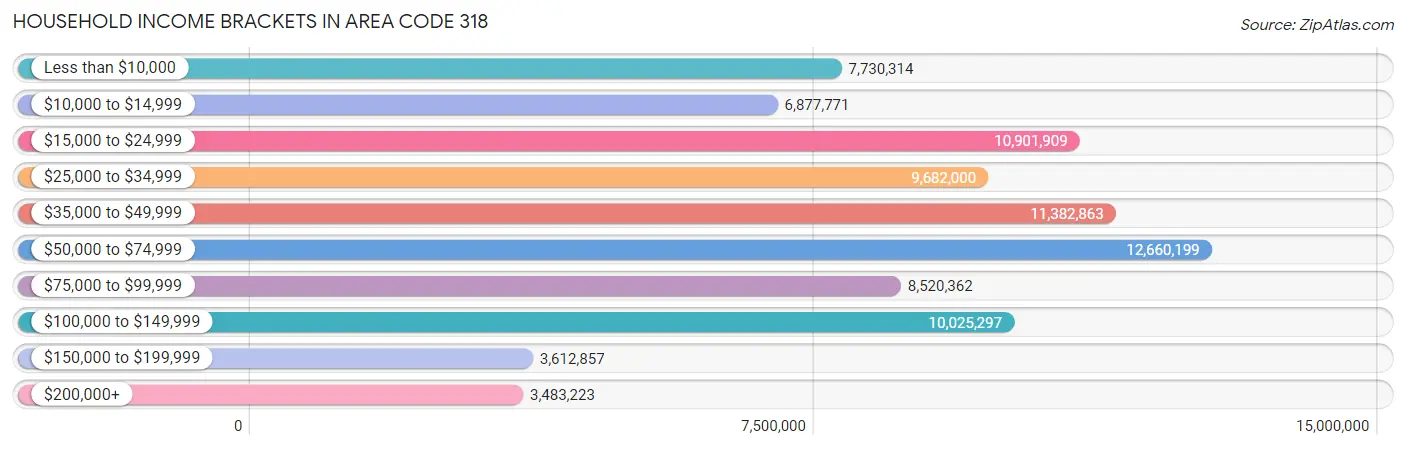
| Income Bracket | # Households | % Households |
| Less than $10,000 | 7,730,314 | 1,830.7% |
| $10,000 to $14,999 | 6,877,771 | 1,628.8% |
| $15,000 to $24,999 | 10,901,909 | 2,581.8% |
| $25,000 to $34,999 | 9,682,000 | 2,292.9% |
| $35,000 to $49,999 | 11,382,863 | 2,695.7% |
| $50,000 to $74,999 | 12,660,199 | 2,998.2% |
| $75,000 to $99,999 | 8,520,362 | 2,017.8% |
| $100,000 to $149,999 | 10,025,297 | 2,374.2% |
| $150,000 to $199,999 | 3,612,857 | 855.6% |
| $200,000+ | 3,483,223 | 824.9% |
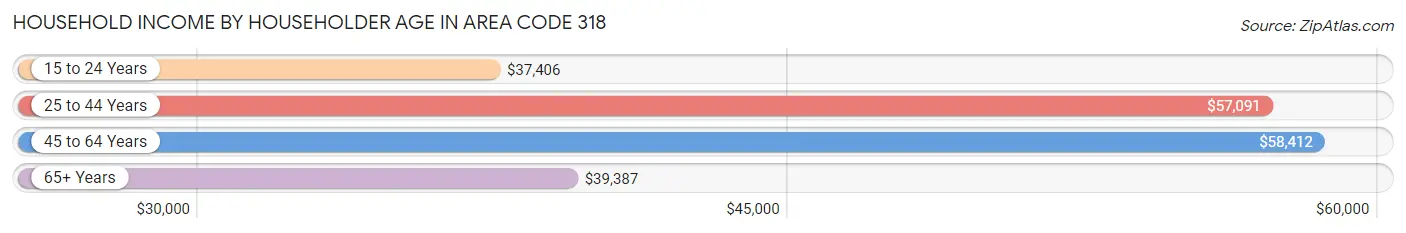
Household Income by Householder Age in Area Code 318
The median household income in Area Code 318 is $46,489, with the highest median household income of $58,412 found in the 45 to 64 years age bracket for the primary householder. A total of 151,056 households (35.8%) fall into this category. Meanwhile, the 15 to 24 years age bracket for the primary householder has the lowest median household income of $37,406, with 18,163 households (4.3%) in this group.
| Income Bracket | # Households | Median Income |
| 15 to 24 Years | 18,163 (4.3%) | $37,406 |
| 25 to 44 Years | 131,393 (31.1%) | $57,091 |
| 45 to 64 Years | 151,056 (35.8%) | $58,412 |
| 65+ Years | 121,648 (28.8%) | $39,387 |
| Total | 422,260 (100.0%) | $46,489 |
Poverty in Area Code 318
Income Below Poverty by Sex and Age in Area Code 318
With 20.8% poverty level for males and 24.8% for females among the residents of Area Code 318, 5 year old males and under 5 year old females are the most vulnerable to poverty, with 2,756 males (40.9%) and 12,227 females (36.1%) in their respective age groups living below the poverty level.
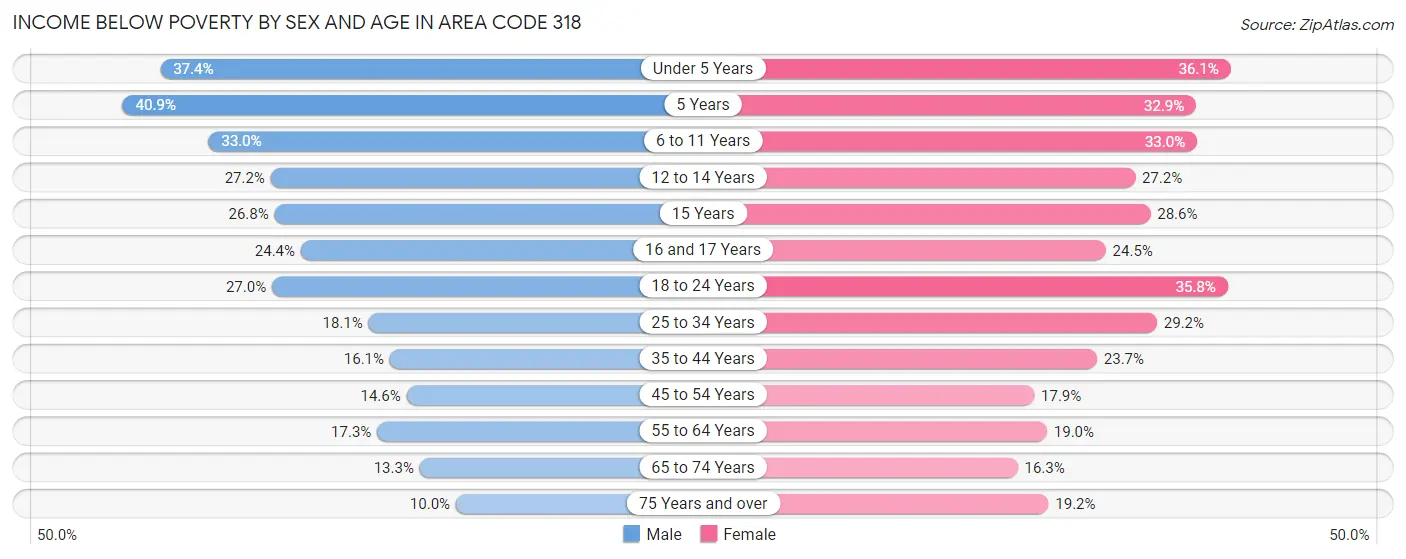
| Age Bracket | Male | Female |
| Under 5 Years | 12,709 (37.4%) | 12,227 (36.1%) |
| 5 Years | 2,756 (40.9%) | 2,213 (32.9%) |
| 6 to 11 Years | 14,688 (33.0%) | 13,492 (33.0%) |
| 12 to 14 Years | 6,585 (27.2%) | 6,368 (27.2%) |
| 15 Years | 2,043 (26.8%) | 1,818 (28.6%) |
| 16 and 17 Years | 3,745 (24.4%) | 3,694 (24.5%) |
| 18 to 24 Years | 13,233 (27.0%) | 17,344 (35.8%) |
| 25 to 34 Years | 11,953 (18.1%) | 20,806 (29.2%) |
| 35 to 44 Years | 10,070 (16.1%) | 16,402 (23.7%) |
| 45 to 54 Years | 8,553 (14.5%) | 11,463 (17.8%) |
| 55 to 64 Years | 11,514 (17.3%) | 14,112 (19.0%) |
| 65 to 74 Years | 6,782 (13.3%) | 9,768 (16.3%) |
| 75 Years and over | 2,994 (10.0%) | 8,339 (19.2%) |
| Total | 107,625 (20.8%) | 138,046 (24.8%) |
Income Above Poverty by Sex and Age in Area Code 318
According to the poverty statistics in Area Code 318, males aged 75 years and over and females aged 65 to 74 years are the age groups that are most secure financially, with 90.0% of males and 83.7% of females in these age groups living above the poverty line.
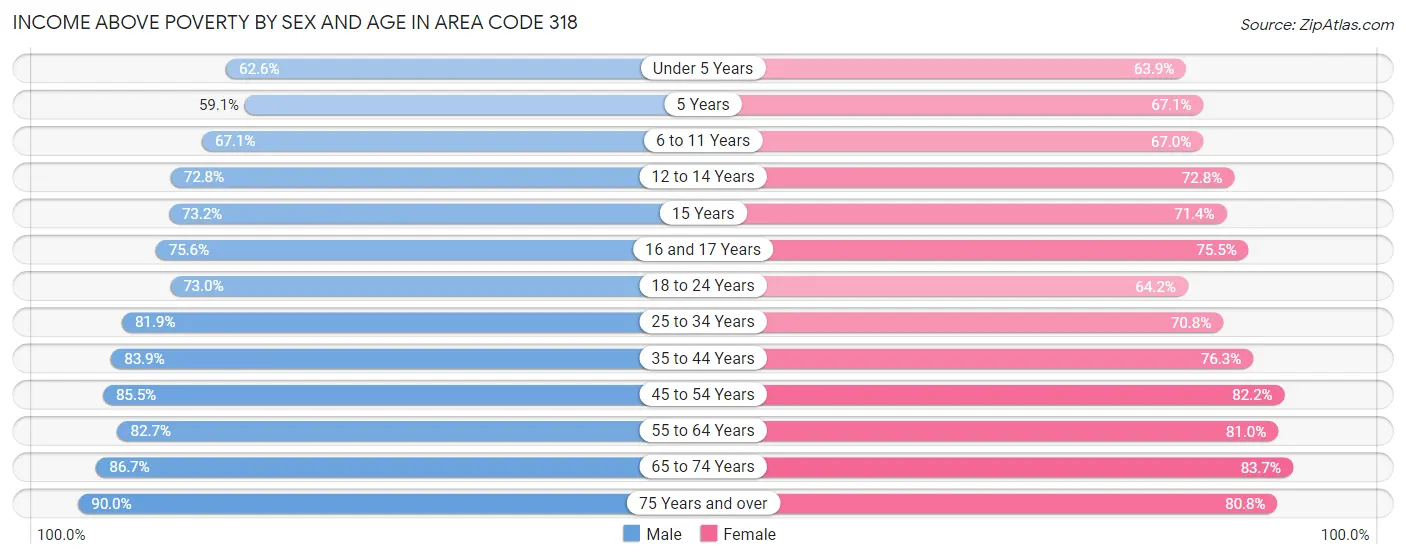
| Age Bracket | Male | Female |
| Under 5 Years | 21,262 (62.6%) | 21,649 (63.9%) |
| 5 Years | 3,983 (59.1%) | 4,518 (67.1%) |
| 6 to 11 Years | 29,893 (67.0%) | 27,446 (67.0%) |
| 12 to 14 Years | 17,663 (72.8%) | 17,037 (72.8%) |
| 15 Years | 5,581 (73.2%) | 4,531 (71.4%) |
| 16 and 17 Years | 11,627 (75.6%) | 11,390 (75.5%) |
| 18 to 24 Years | 35,697 (73.0%) | 31,088 (64.2%) |
| 25 to 34 Years | 54,152 (81.9%) | 50,354 (70.8%) |
| 35 to 44 Years | 52,474 (83.9%) | 52,900 (76.3%) |
| 45 to 54 Years | 50,249 (85.5%) | 52,747 (82.2%) |
| 55 to 64 Years | 55,123 (82.7%) | 60,057 (81.0%) |
| 65 to 74 Years | 44,110 (86.7%) | 50,133 (83.7%) |
| 75 Years and over | 27,028 (90.0%) | 35,162 (80.8%) |
| Total | 408,842 (79.2%) | 419,012 (75.2%) |
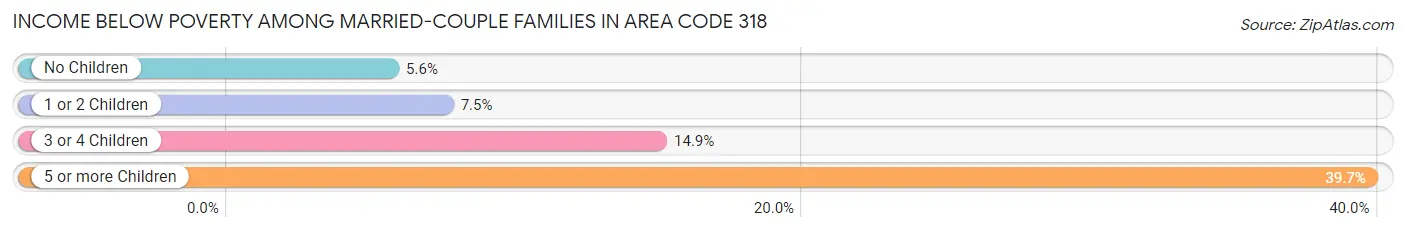
Income Below Poverty Among Married-Couple Families in Area Code 318
The poverty statistics for married-couple families in Area Code 318 show that 7.1% or 12,322 of the total 172,836 families live below the poverty line. Families with 5 or more children have the highest poverty rate of 39.7%, comprising of 475 families. On the other hand, families with no children have the lowest poverty rate of 5.6%, which includes 5,912 families.
| Children | Above Poverty | Below Poverty |
| No Children | 99,412 (94.4%) | 5,912 (5.6%) |
| 1 or 2 Children | 49,456 (92.5%) | 4,016 (7.5%) |
| 3 or 4 Children | 10,924 (85.1%) | 1,919 (14.9%) |
| 5 or more Children | 722 (60.3%) | 475 (39.7%) |
| Total | 160,514 (92.9%) | 12,322 (7.1%) |
Income Below Poverty Among Single-Parent Households in Area Code 318
According to the poverty data in Area Code 318, 23.9% or 5,244 single-father households and 39.4% or 27,886 single-mother households are living below the poverty line. Among single-father households, those with 5 or more children have the highest poverty rate, with 19 households (79.2%) experiencing poverty. Likewise, among single-mother households, those with 5 or more children have the highest poverty rate, with 822 households (89.5%) falling below the poverty line.
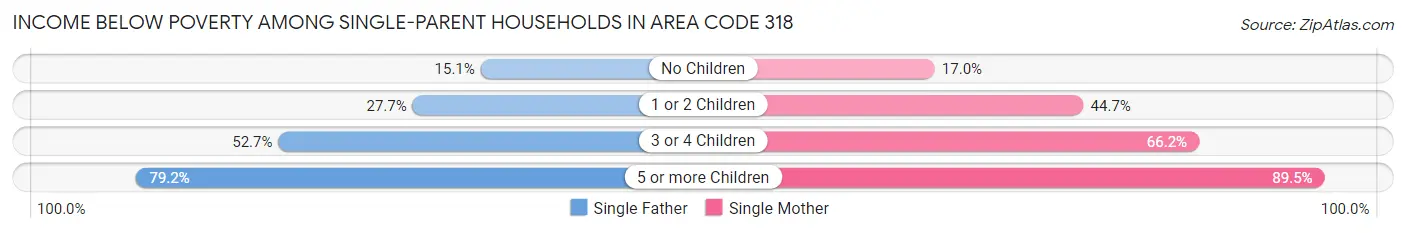
| Children | Single Father | Single Mother |
| No Children | 1,549 (15.1%) | 3,901 (17.0%) |
| 1 or 2 Children | 2,752 (27.7%) | 16,425 (44.7%) |
| 3 or 4 Children | 924 (52.7%) | 6,738 (66.2%) |
| 5 or more Children | 19 (79.2%) | 822 (89.5%) |
| Total | 5,244 (23.9%) | 27,886 (39.4%) |
Income Below Poverty Among Married-Couple vs Single-Parent Households in Area Code 318
The poverty data for Area Code 318 shows that 12,322 of the married-couple family households (7.1%) and 33,130 of the single-parent households (35.7%) are living below the poverty level. Within the married-couple family households, those with 5 or more children have the highest poverty rate, with 475 households (39.7%) falling below the poverty line. Among the single-parent households, those with 5 or more children have the highest poverty rate, with 841 household (89.3%) living below poverty.
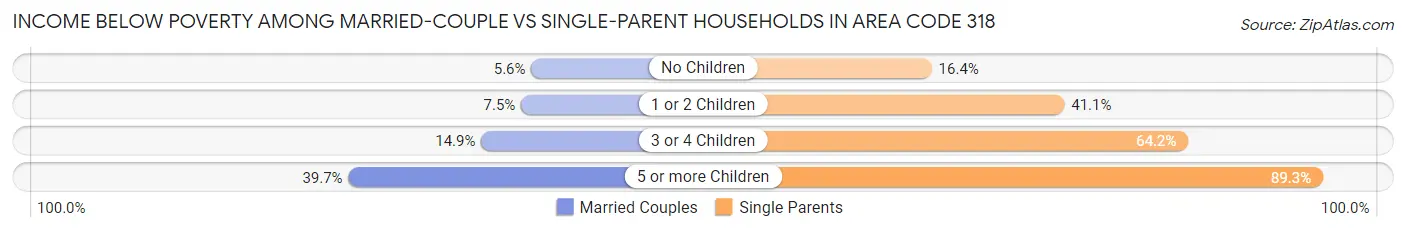
| Children | Married-Couple Families | Single-Parent Households |
| No Children | 5,912 (5.6%) | 5,450 (16.4%) |
| 1 or 2 Children | 4,016 (7.5%) | 19,177 (41.1%) |
| 3 or 4 Children | 1,919 (14.9%) | 7,662 (64.2%) |
| 5 or more Children | 475 (39.7%) | 841 (89.3%) |
| Total | 12,322 (7.1%) | 33,130 (35.7%) |
Race in Area Code 318
The most populous races in Area Code 318 are White / Caucasian (647,707 | 57.7%), Black / African American (402,883 | 35.9%), and Two or more Races (42,162 | 3.8%).
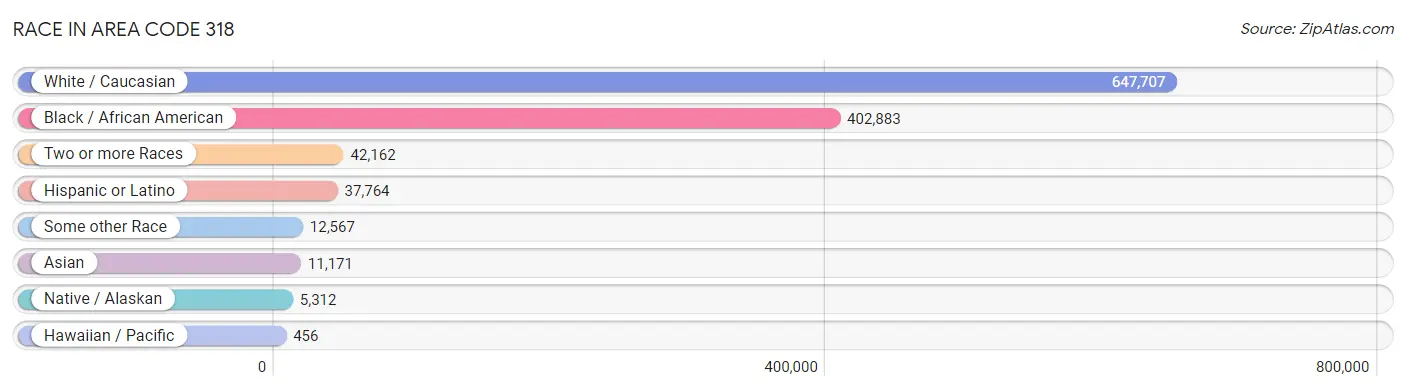
| Race | # Population | % Population |
| Asian | 11,171 | 1.0% |
| Black / African American | 402,883 | 35.9% |
| Hawaiian / Pacific | 456 | 0.0% |
| Hispanic or Latino | 37,764 | 3.4% |
| Native / Alaskan | 5,312 | 0.5% |
| White / Caucasian | 647,707 | 57.7% |
| Two or more Races | 42,162 | 3.8% |
| Some other Race | 12,567 | 1.1% |
| Total | 1,122,258 | 100.0% |
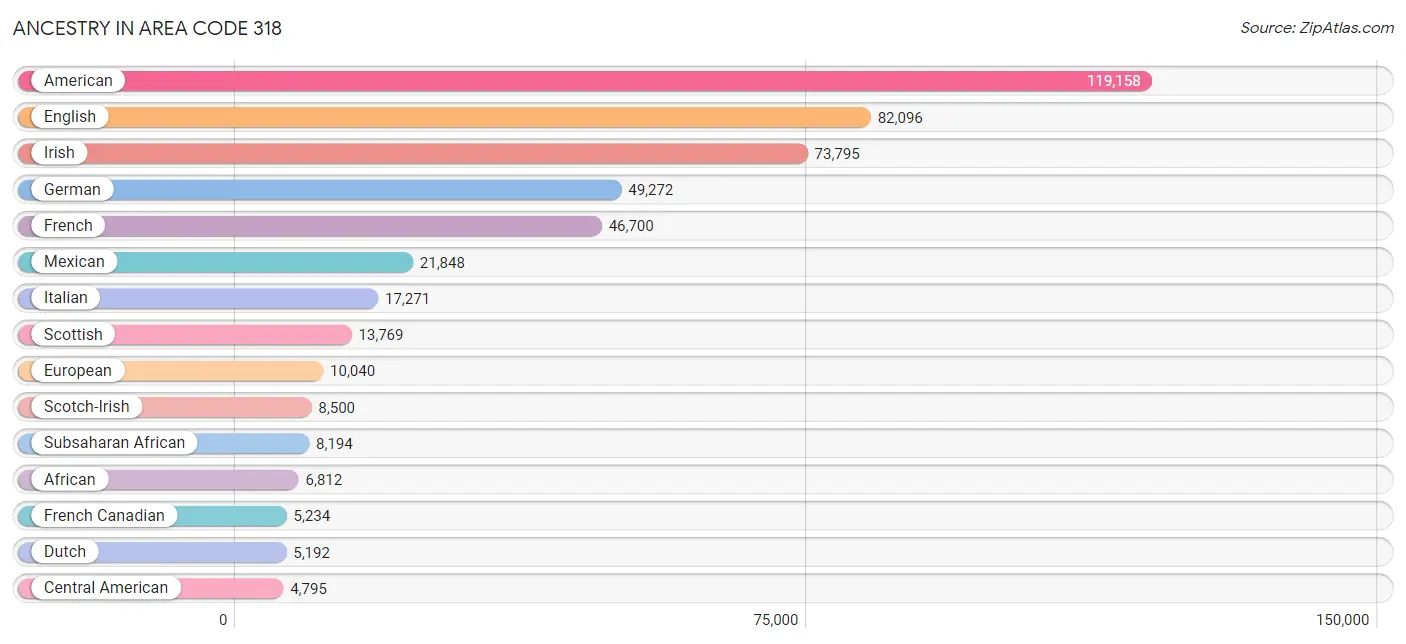
Ancestry in Area Code 318
The most populous ancestries reported in Area Code 318 are American (119,158 | 10.6%), English (82,096 | 7.3%), Irish (73,795 | 6.6%), German (49,272 | 4.4%), and French (46,700 | 4.2%), together accounting for 33.1% of all Area Code 318 residents.
| Ancestry | # Population | % Population |
| African | 6,812 | 0.6% |
| Alaskan Athabascan | 27 | 0.0% |
| Albanian | 21 | 0.0% |
| Alsatian | 1 | 0.0% |
| American | 119,158 | 10.6% |
| Apache | 190 | 0.0% |
| Arab | 2,990 | 0.3% |
| Argentinean | 150 | 0.0% |
| Armenian | 27 | 0.0% |
| Assyrian / Chaldean / Syriac | 23 | 0.0% |
| Australian | 154 | 0.0% |
| Austrian | 514 | 0.1% |
| Bahamian | 51 | 0.0% |
| Bangladeshi | 1 | 0.0% |
| Barbadian | 21 | 0.0% |
| Basque | 73 | 0.0% |
| Belgian | 1,039 | 0.1% |
| Belizean | 253 | 0.0% |
| Bhutanese | 889 | 0.1% |
| Blackfeet | 292 | 0.0% |
| Bolivian | 9 | 0.0% |
| Brazilian | 104 | 0.0% |
| British | 3,341 | 0.3% |
| British West Indian | 85 | 0.0% |
| Bulgarian | 114 | 0.0% |
| Burmese | 1,199 | 0.1% |
| Cajun | 3,690 | 0.3% |
| Canadian | 427 | 0.0% |
| Celtic | 4 | 0.0% |
| Central American | 4,795 | 0.4% |
| Central American Indian | 433 | 0.0% |
| Cherokee | 2,496 | 0.2% |
| Cheyenne | 5 | 0.0% |
| Chickasaw | 159 | 0.0% |
| Chippewa | 77 | 0.0% |
| Choctaw | 2,140 | 0.2% |
| Colombian | 471 | 0.0% |
| Comanche | 103 | 0.0% |
| Costa Rican | 246 | 0.0% |
| Cree | 3 | 0.0% |
| Creek | 129 | 0.0% |
| Croatian | 204 | 0.0% |
| Crow | 1 | 0.0% |
| Cuban | 941 | 0.1% |
| Cypriot | 6 | 0.0% |
| Czech | 535 | 0.1% |
| Czechoslovakian | 460 | 0.0% |
| Danish | 492 | 0.0% |
| Dominican | 473 | 0.0% |
| Dutch | 5,192 | 0.5% |
| Dutch West Indian | 29 | 0.0% |
| Eastern European | 940 | 0.1% |
| Ecuadorian | 110 | 0.0% |
| Egyptian | 95 | 0.0% |
| English | 82,096 | 7.3% |
| Estonian | 16 | 0.0% |
| Ethiopian | 155 | 0.0% |
| European | 10,040 | 0.9% |
| Filipino | 34 | 0.0% |
| Finnish | 248 | 0.0% |
| French | 46,700 | 4.2% |
| French American Indian | 140 | 0.0% |
| French Canadian | 5,234 | 0.5% |
| German | 49,272 | 4.4% |
| German Russian | 2 | 0.0% |
| Ghanaian | 4 | 0.0% |
| Greek | 618 | 0.1% |
| Guamanian / Chamorro | 237 | 0.0% |
| Guatemalan | 674 | 0.1% |
| Guyanese | 41 | 0.0% |
| Haitian | 435 | 0.0% |
| Honduran | 2,695 | 0.2% |
| Houma | 424 | 0.0% |
| Hungarian | 766 | 0.1% |
| Icelander | 49 | 0.0% |
| Indian (Asian) | 2,759 | 0.3% |
| Indonesian | 51 | 0.0% |
| Inupiat | 40 | 0.0% |
| Iranian | 216 | 0.0% |
| Iraqi | 52 | 0.0% |
| Irish | 73,795 | 6.6% |
| Iroquois | 50 | 0.0% |
| Israeli | 249 | 0.0% |
| Italian | 17,271 | 1.5% |
| Jamaican | 333 | 0.0% |
| Japanese | 296 | 0.0% |
| Jordanian | 98 | 0.0% |
| Kenyan | 328 | 0.0% |
| Korean | 3,912 | 0.4% |
| Laotian | 26 | 0.0% |
| Latvian | 35 | 0.0% |
| Lebanese | 659 | 0.1% |
| Liberian | 38 | 0.0% |
| Lithuanian | 265 | 0.0% |
| Lumbee | 11 | 0.0% |
| Malaysian | 301 | 0.0% |
| Maltese | 13 | 0.0% |
| Mexican | 21,848 | 1.9% |
| Mexican American Indian | 268 | 0.0% |
| Mongolian | 5 | 0.0% |
| Moroccan | 115 | 0.0% |
| Native Hawaiian | 396 | 0.0% |
| Navajo | 239 | 0.0% |
| Nepalese | 83 | 0.0% |
| Nicaraguan | 451 | 0.0% |
| Nigerian | 421 | 0.0% |
| Northern European | 1,054 | 0.1% |
| Norwegian | 2,980 | 0.3% |
| Osage | 38 | 0.0% |
| Pakistani | 561 | 0.1% |
| Palestinian | 504 | 0.0% |
| Panamanian | 296 | 0.0% |
| Pennsylvania German | 19 | 0.0% |
| Peruvian | 106 | 0.0% |
| Polish | 3,220 | 0.3% |
| Portuguese | 633 | 0.1% |
| Potawatomi | 23 | 0.0% |
| Pueblo | 27 | 0.0% |
| Puerto Rican | 2,040 | 0.2% |
| Romanian | 150 | 0.0% |
| Russian | 900 | 0.1% |
| Salvadoran | 433 | 0.0% |
| Samoan | 212 | 0.0% |
| Scandinavian | 1,780 | 0.2% |
| Scotch-Irish | 8,500 | 0.8% |
| Scottish | 13,769 | 1.2% |
| Seminole | 47 | 0.0% |
| Senegalese | 20 | 0.0% |
| Serbian | 88 | 0.0% |
| Shoshone | 10 | 0.0% |
| Sioux | 115 | 0.0% |
| Slavic | 123 | 0.0% |
| Slovak | 175 | 0.0% |
| Slovene | 39 | 0.0% |
| South African | 56 | 0.0% |
| South American | 1,026 | 0.1% |
| South American Indian | 29 | 0.0% |
| Spaniard | 944 | 0.1% |
| Spanish | 2,056 | 0.2% |
| Spanish American | 10 | 0.0% |
| Spanish American Indian | 9 | 0.0% |
| Sri Lankan | 2,411 | 0.2% |
| Subsaharan African | 8,194 | 0.7% |
| Swedish | 2,070 | 0.2% |
| Swiss | 489 | 0.0% |
| Syrian | 320 | 0.0% |
| Thai | 2,279 | 0.2% |
| Tlingit-Haida | 33 | 0.0% |
| Trinidadian and Tobagonian | 91 | 0.0% |
| Turkish | 111 | 0.0% |
| Ukrainian | 269 | 0.0% |
| Uruguayan | 44 | 0.0% |
| Venezuelan | 117 | 0.0% |
| Vietnamese | 141 | 0.0% |
| Welsh | 3,661 | 0.3% |
| West Indian | 275 | 0.0% |
| Yugoslavian | 123 | 0.0% | View All 157 Rows |
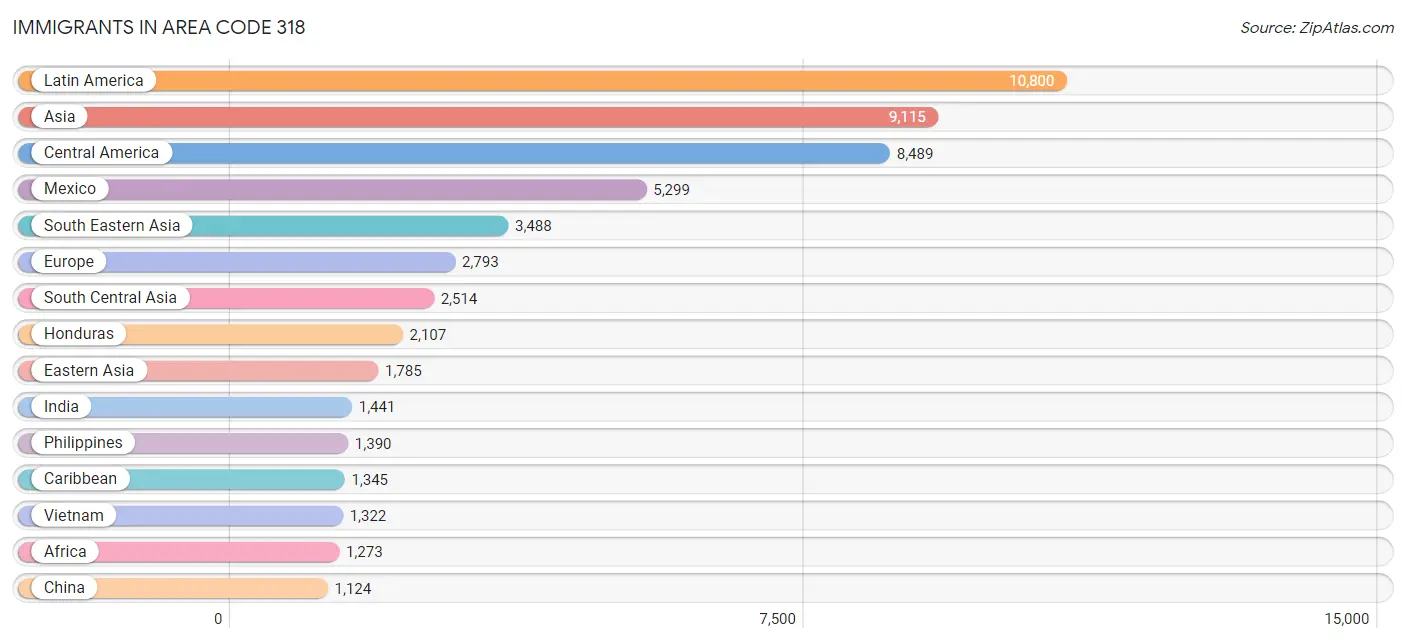
Immigrants in Area Code 318
The most numerous immigrant groups reported in Area Code 318 came from Latin America (10,800 | 1.0%), Asia (9,115 | 0.8%), Central America (8,489 | 0.8%), Mexico (5,299 | 0.5%), and South Eastern Asia (3,488 | 0.3%), together accounting for 3.3% of all Area Code 318 residents.
| Immigration Origin | # Population | % Population |
| Africa | 1,273 | 0.1% |
| Argentina | 78 | 0.0% |
| Asia | 9,115 | 0.8% |
| Australia | 36 | 0.0% |
| Austria | 38 | 0.0% |
| Azores | 23 | 0.0% |
| Bahamas | 20 | 0.0% |
| Bangladesh | 161 | 0.0% |
| Barbados | 21 | 0.0% |
| Belgium | 62 | 0.0% |
| Belize | 200 | 0.0% |
| Bosnia and Herzegovina | 18 | 0.0% |
| Brazil | 162 | 0.0% |
| Bulgaria | 20 | 0.0% |
| Cambodia | 10 | 0.0% |
| Cameroon | 147 | 0.0% |
| Canada | 417 | 0.0% |
| Caribbean | 1,345 | 0.1% |
| Central America | 8,489 | 0.8% |
| Chile | 7 | 0.0% |
| China | 1,124 | 0.1% |
| Colombia | 293 | 0.0% |
| Costa Rica | 123 | 0.0% |
| Croatia | 17 | 0.0% |
| Cuba | 435 | 0.0% |
| Dominica | 211 | 0.0% |
| Dominican Republic | 284 | 0.0% |
| Eastern Africa | 460 | 0.0% |
| Eastern Asia | 1,785 | 0.2% |
| Eastern Europe | 797 | 0.1% |
| Ecuador | 52 | 0.0% |
| Egypt | 73 | 0.0% |
| El Salvador | 129 | 0.0% |
| England | 371 | 0.0% |
| Eritrea | 8 | 0.0% |
| Ethiopia | 90 | 0.0% |
| Europe | 2,793 | 0.3% |
| Fiji | 7 | 0.0% |
| France | 82 | 0.0% |
| Germany | 833 | 0.1% |
| Ghana | 44 | 0.0% |
| Greece | 38 | 0.0% |
| Guatemala | 302 | 0.0% |
| Haiti | 85 | 0.0% |
| Honduras | 2,107 | 0.2% |
| Hong Kong | 70 | 0.0% |
| India | 1,441 | 0.1% |
| Indonesia | 5 | 0.0% |
| Iran | 92 | 0.0% |
| Iraq | 28 | 0.0% |
| Ireland | 25 | 0.0% |
| Israel | 219 | 0.0% |
| Italy | 136 | 0.0% |
| Jamaica | 134 | 0.0% |
| Japan | 354 | 0.0% |
| Jordan | 97 | 0.0% |
| Kenya | 255 | 0.0% |
| Korea | 307 | 0.0% |
| Kuwait | 9 | 0.0% |
| Laos | 226 | 0.0% |
| Latin America | 10,800 | 1.0% |
| Latvia | 35 | 0.0% |
| Lebanon | 2 | 0.0% |
| Lithuania | 1 | 0.0% |
| Malaysia | 20 | 0.0% |
| Mexico | 5,299 | 0.5% |
| Middle Africa | 147 | 0.0% |
| Morocco | 58 | 0.0% |
| Nepal | 407 | 0.0% |
| Netherlands | 54 | 0.0% |
| Nicaragua | 250 | 0.0% |
| Nigeria | 237 | 0.0% |
| North Macedonia | 14 | 0.0% |
| Northern Africa | 163 | 0.0% |
| Northern Europe | 689 | 0.1% |
| Norway | 20 | 0.0% |
| Oceania | 63 | 0.0% |
| Pakistan | 413 | 0.0% |
| Panama | 79 | 0.0% |
| Peru | 41 | 0.0% |
| Philippines | 1,390 | 0.1% |
| Poland | 10 | 0.0% |
| Portugal | 23 | 0.0% |
| Romania | 158 | 0.0% |
| Russia | 419 | 0.0% |
| Saudi Arabia | 198 | 0.0% |
| Senegal | 20 | 0.0% |
| Serbia | 3 | 0.0% |
| Singapore | 152 | 0.0% |
| South Africa | 119 | 0.0% |
| South America | 966 | 0.1% |
| South Central Asia | 2,514 | 0.2% |
| South Eastern Asia | 3,488 | 0.3% |
| Southern Europe | 210 | 0.0% |
| Spain | 13 | 0.0% |
| Sweden | 18 | 0.0% |
| Switzerland | 28 | 0.0% |
| Syria | 73 | 0.0% |
| Taiwan | 140 | 0.0% |
| Thailand | 348 | 0.0% |
| Trinidad and Tobago | 84 | 0.0% |
| Turkey | 110 | 0.0% |
| Uganda | 21 | 0.0% |
| Ukraine | 80 | 0.0% |
| Uruguay | 77 | 0.0% |
| Venezuela | 256 | 0.0% |
| Vietnam | 1,322 | 0.1% |
| Western Africa | 301 | 0.0% |
| Western Asia | 996 | 0.1% |
| Western Europe | 1,097 | 0.1% |
| Yemen | 225 | 0.0% |
| Zimbabwe | 34 | 0.0% | View All 112 Rows |
Sex and Age in Area Code 318
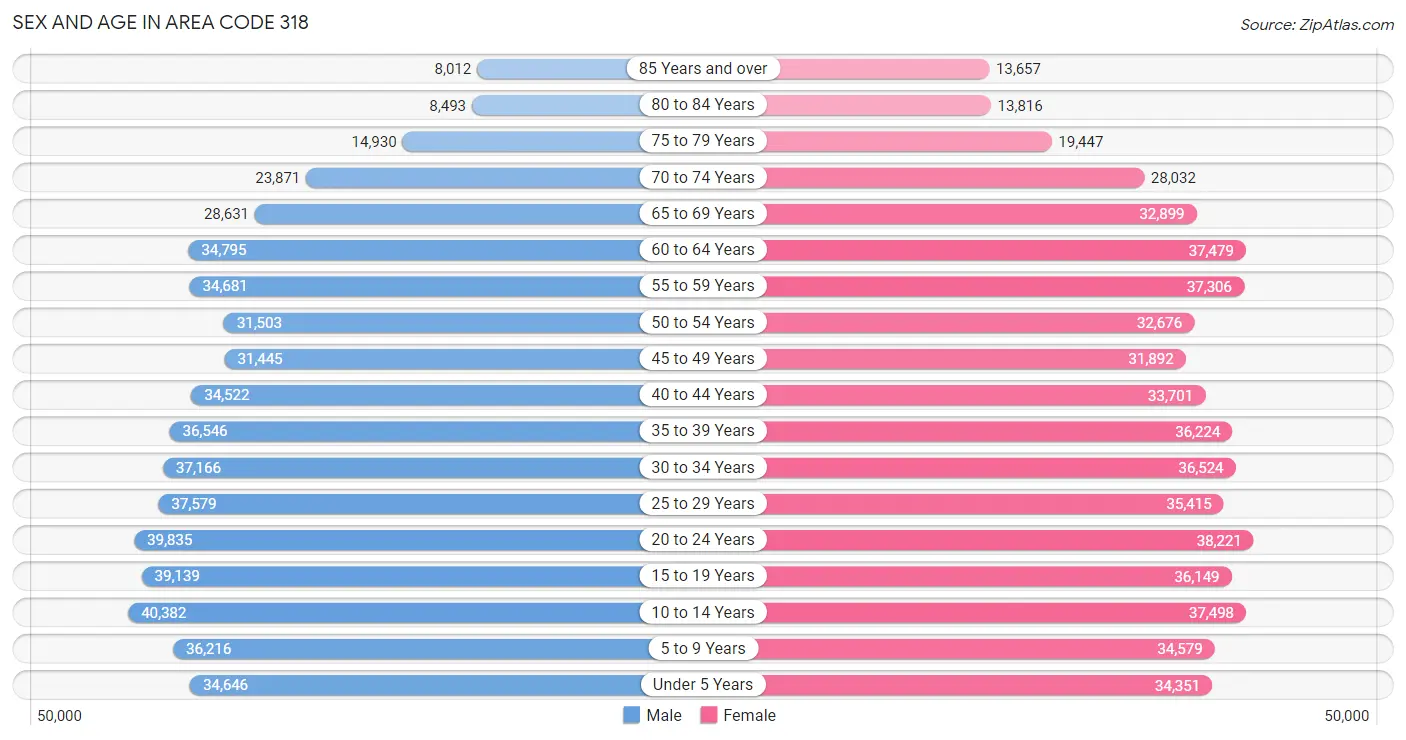
Sex and Age in Area Code 318
The most populous age groups in Area Code 318 are 10 to 14 Years (40,382 | 7.3%) for men and 20 to 24 Years (38,221 | 6.7%) for women.
| Age Bracket | Male | Female |
| Under 5 Years | 34,646 (6.3%) | 34,351 (6.0%) |
| 5 to 9 Years | 36,216 (6.6%) | 34,579 (6.1%) |
| 10 to 14 Years | 40,382 (7.3%) | 37,498 (6.6%) |
| 15 to 19 Years | 39,139 (7.1%) | 36,149 (6.3%) |
| 20 to 24 Years | 39,835 (7.2%) | 38,221 (6.7%) |
| 25 to 29 Years | 37,579 (6.8%) | 35,415 (6.2%) |
| 30 to 34 Years | 37,166 (6.7%) | 36,524 (6.4%) |
| 35 to 39 Years | 36,546 (6.6%) | 36,224 (6.4%) |
| 40 to 44 Years | 34,522 (6.2%) | 33,701 (5.9%) |
| 45 to 49 Years | 31,445 (5.7%) | 31,892 (5.6%) |
| 50 to 54 Years | 31,503 (5.7%) | 32,676 (5.7%) |
| 55 to 59 Years | 34,681 (6.3%) | 37,306 (6.6%) |
| 60 to 64 Years | 34,795 (6.3%) | 37,479 (6.6%) |
| 65 to 69 Years | 28,631 (5.2%) | 32,899 (5.8%) |
| 70 to 74 Years | 23,871 (4.3%) | 28,032 (4.9%) |
| 75 to 79 Years | 14,930 (2.7%) | 19,447 (3.4%) |
| 80 to 84 Years | 8,493 (1.5%) | 13,816 (2.4%) |
| 85 Years and over | 8,012 (1.5%) | 13,657 (2.4%) |
| Total | 552,392 (100.0%) | 569,866 (100.0%) |
Families and Households in Area Code 318
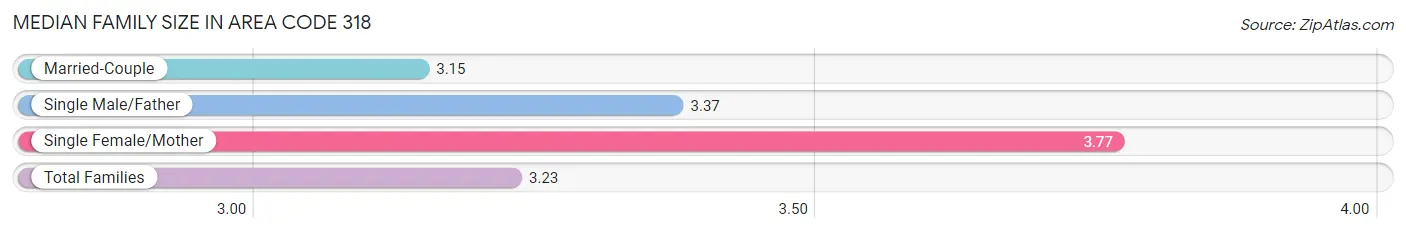
Median Family Size in Area Code 318
The median family size in Area Code 318 is 3.23 persons per family, with single female/mother families (70,816 | 26.7%) accounting for the largest median family size of 3.76625 persons per family. On the other hand, married-couple families (172,836 | 65.1%) represent the smallest median family size with 3.15 persons per family.
| Family Type | # Families | Family Size |
| Married-Couple | 172,836 (65.1%) | 3.15 |
| Single Male/Father | 21,982 (8.3%) | 3.37 |
| Single Female/Mother | 70,816 (26.7%) | 3.77 |
| Total Families | 265,634 (100.0%) | 3.23 |
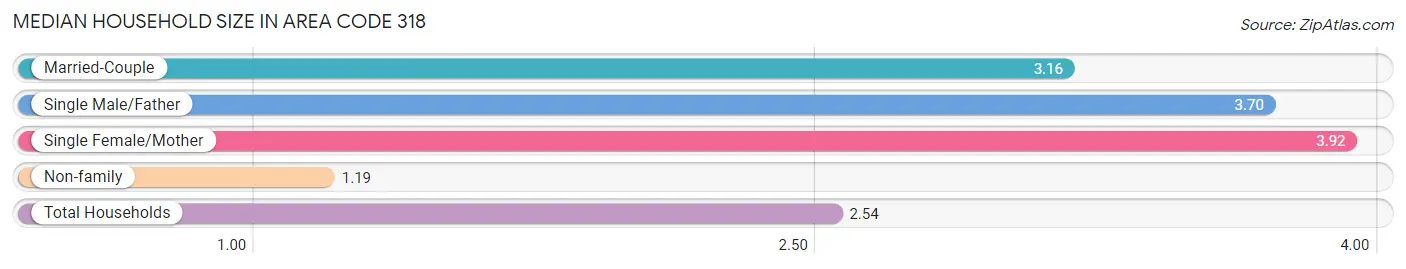
Median Household Size in Area Code 318
The median household size in Area Code 318 is 2.54 persons per household, with single female/mother households (70,816 | 16.8%) accounting for the largest median household size of 3.92122 persons per household. non-family households (156,626 | 37.1%) represent the smallest median household size with 1.19 persons per household.
| Household Type | # Households | Household Size |
| Married-Couple | 172,836 (40.9%) | 3.16 |
| Single Male/Father | 21,982 (5.2%) | 3.70 |
| Single Female/Mother | 70,816 (16.8%) | 3.92 |
| Non-family | 156,626 (37.1%) | 1.19 |
| Total Households | 422,260 (100.0%) | 2.54 |
Household Size by Marriage Status in Area Code 318
Out of a total of 422,260 households in Area Code 318, 265,634 (62.9%) are family households, while 156,626 (37.1%) are nonfamily households. The most numerous type of family households are 2-person households, comprising 122,182, and the most common type of nonfamily households are 1-person households, comprising 134,935.
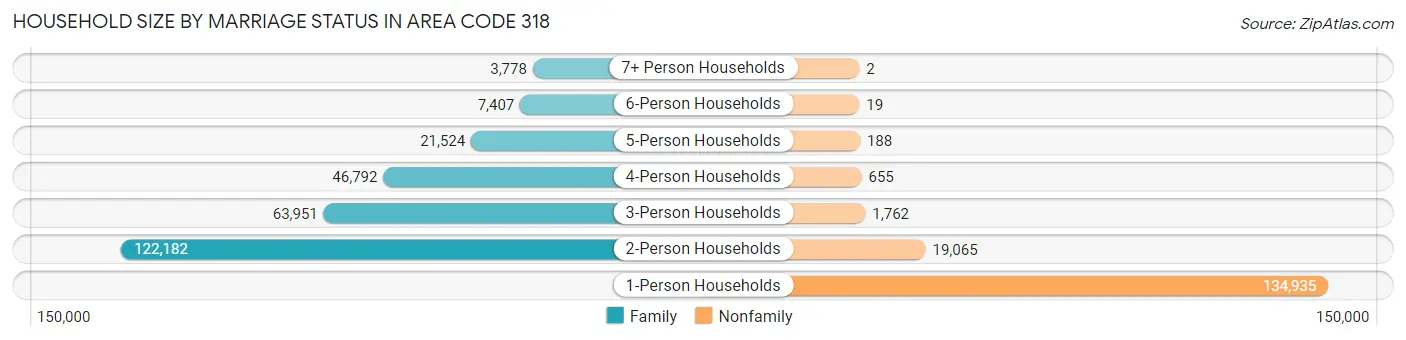
| Household Size | Family Households | Nonfamily Households |
| 1-Person Households | - | 134,935 (32.0%) |
| 2-Person Households | 122,182 (28.9%) | 19,065 (4.5%) |
| 3-Person Households | 63,951 (15.1%) | 1,762 (0.4%) |
| 4-Person Households | 46,792 (11.1%) | 655 (0.2%) |
| 5-Person Households | 21,524 (5.1%) | 188 (0.0%) |
| 6-Person Households | 7,407 (1.8%) | 19 (0.0%) |
| 7+ Person Households | 3,778 (0.9%) | 2 (0.0%) |
| Total | 265,634 (62.9%) | 156,626 (37.1%) |
Female Fertility in Area Code 318
Fertility by Age in Area Code 318
Average fertility rate in Area Code 318 is 88.9 births per 1,000 women. Women in the age bracket of 20 to 34 years have the highest fertility rate with 159.2 births per 1,000 women. Women in the age bracket of 20 to 34 years acount for 73.5% of all women with births.
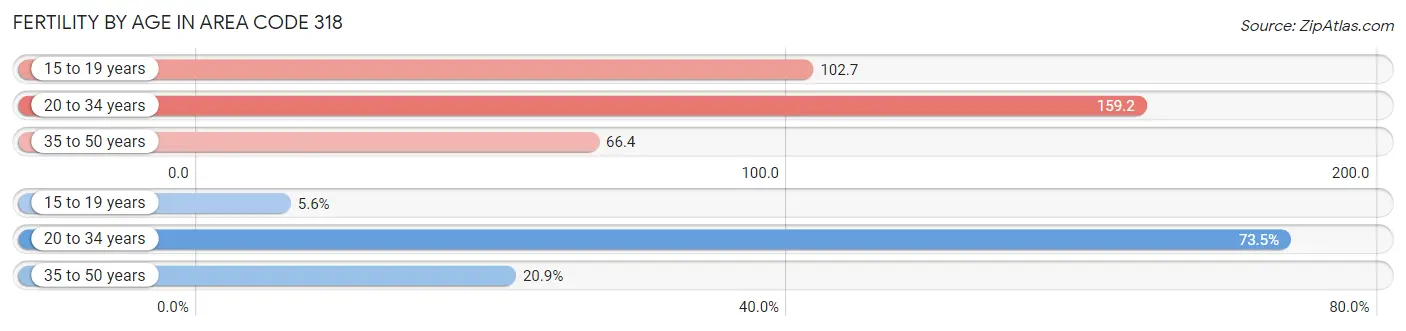
| Age Bracket | Women with Births | Births / 1,000 Women |
| 15 to 19 years | 792 (5.6%) | 102.7 |
| 20 to 34 years | 10,352 (73.5%) | 159.2 |
| 35 to 50 years | 2,944 (20.9%) | 66.4 |
| Total | 14,088 (100.0%) | 88.9 |
Fertility by Age by Marriage Status in Area Code 318
36.3% of women with births (14,088) in Area Code 318 are married. The highest percentage of unmarried women with births falls into 15 to 19 years age bracket with 100.0% of them unmarried at the time of birth, while the lowest percentage of unmarried women with births belong to 35 to 50 years age bracket with 65.5% of them unmarried.
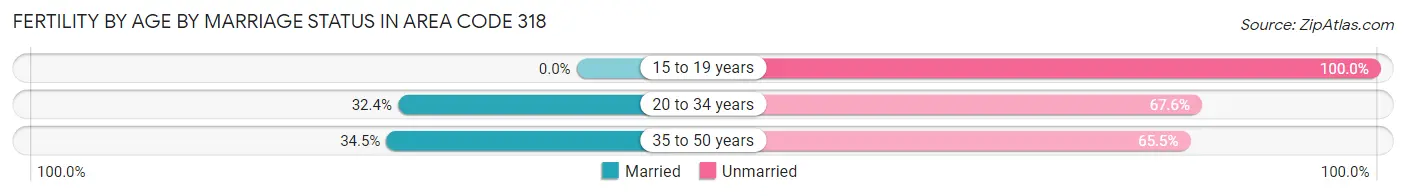
| Age Bracket | Married | Unmarried |
| 15 to 19 years | 0 (0.0%) | 792 (100.0%) |
| 20 to 34 years | 3,353 (32.4%) | 6,999 (67.6%) |
| 35 to 50 years | 1,015 (34.5%) | 1,929 (65.5%) |
| Total | 5,112 (36.3%) | 8,976 (63.7%) |
Fertility by Education in Area Code 318
Average fertility rate in Area Code 318 is 88.9 births per 1,000 women. Women with the education attainment of graduate degree have the highest fertility rate of 234.7 births per 1,000 women, while women with the education attainment of less than high school have the lowest fertility at 126.6 births per 1,000 women. Women with the education attainment of college or associate's degree represent 34.4% of all women with births.
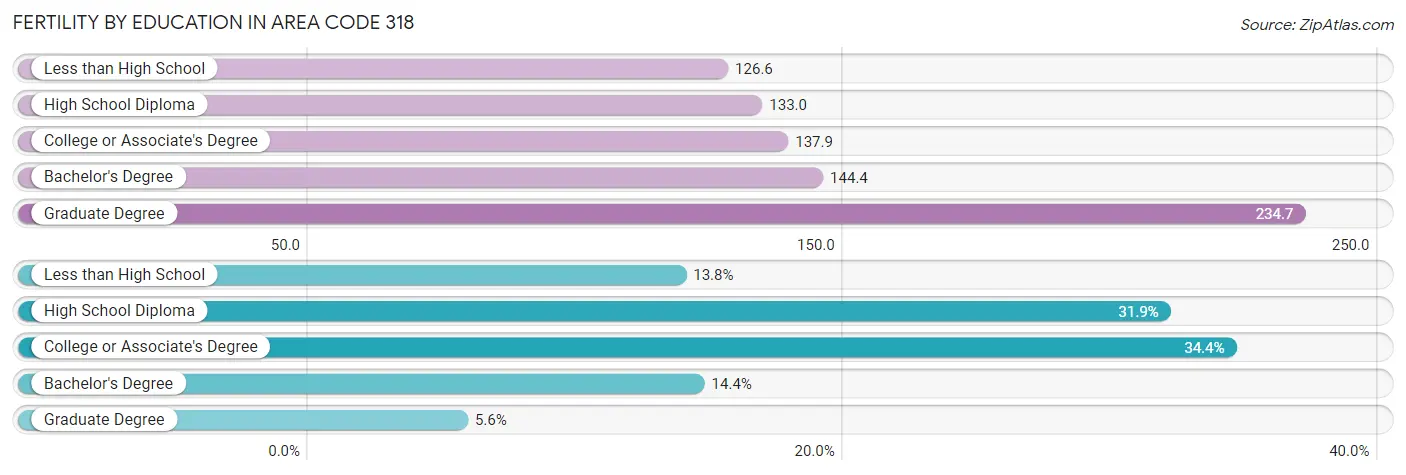
| Educational Attainment | Women with Births | Births / 1,000 Women |
| Less than High School | 1,937 (13.8%) | 126.6 |
| High School Diploma | 4,492 (31.9%) | 133.0 |
| College or Associate's Degree | 4,840 (34.4%) | 137.9 |
| Bachelor's Degree | 2,034 (14.4%) | 144.4 |
| Graduate Degree | 785 (5.6%) | 234.7 |
| Total | 14,088 (100.0%) | 88.9 |
Fertility by Education by Marriage Status in Area Code 318
63.7% of women with births in Area Code 318 are unmarried. Women with the educational attainment of bachelor's degree are most likely to be married with 33.1% of them married at childbirth, while women with the educational attainment of graduate degree are least likely to be married with 100.0% of them unmarried at childbirth.
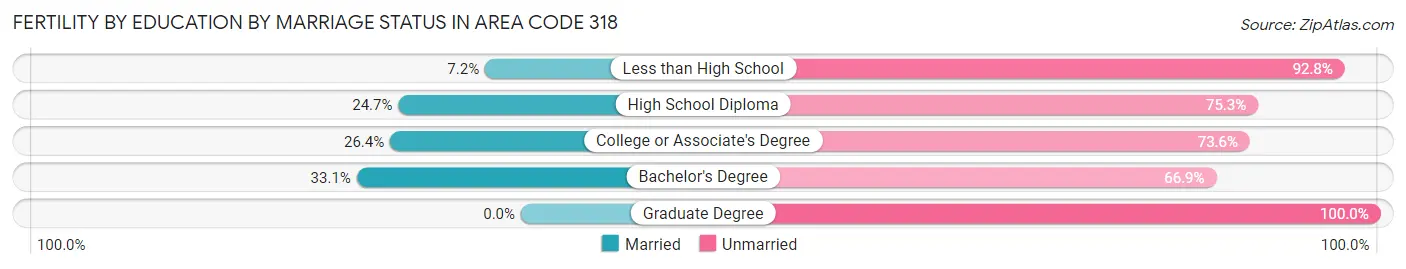
| Educational Attainment | Married | Unmarried |
| Less than High School | 140 (7.2%) | 1,797 (92.8%) |
| High School Diploma | 1,109 (24.7%) | 3,383 (75.3%) |
| College or Associate's Degree | 1,276 (26.4%) | 3,564 (73.6%) |
| Bachelor's Degree | 673 (33.1%) | 1,361 (66.9%) |
| Graduate Degree | 0 (0.0%) | 785 (100.0%) |
| Total | 5,112 (36.3%) | 8,976 (63.7%) |
Employment Characteristics in Area Code 318
Employment by Class of Employer in Area Code 318
Among the 440,571 employed individuals in Area Code 318, private company employees (284,789 | 64.6%), local government employees (35,436 | 8.0%), and state government employees (30,203 | 6.9%) make up the most common classes of employment.
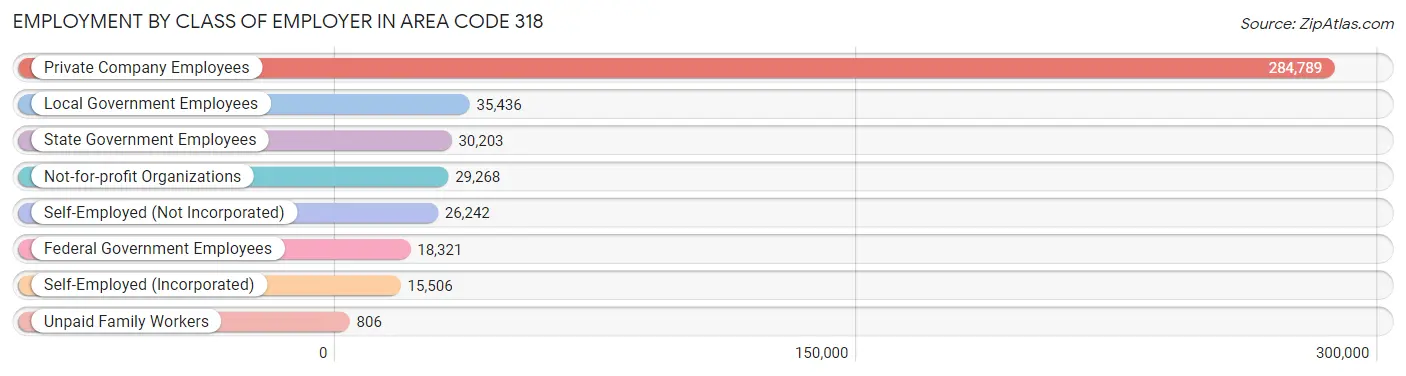
| Employer Class | # Employees | % Employees |
| Private Company Employees | 284,789 | 64.6% |
| Self-Employed (Incorporated) | 15,506 | 3.5% |
| Self-Employed (Not Incorporated) | 26,242 | 6.0% |
| Not-for-profit Organizations | 29,268 | 6.6% |
| Local Government Employees | 35,436 | 8.0% |
| State Government Employees | 30,203 | 6.9% |
| Federal Government Employees | 18,321 | 4.2% |
| Unpaid Family Workers | 806 | 0.2% |
| Total | 440,571 | 100.0% |
Employment Status by Age in Area Code 318
According to the labor force statistics for Area Code 318, out of the total population over 16 years of age (890,583), 51.3% or 457,225 individuals are in the labor force, with 8.4% or 38,453 of them unemployed. The age group with the highest labor force participation rate is 30 to 34 years, with 73.5% or 54,170 individuals in the labor force. Within the labor force, the 16 to 19 years age range has the highest percentage of unemployed individuals, with 3,440.1% or 784,687 of them being unemployed.
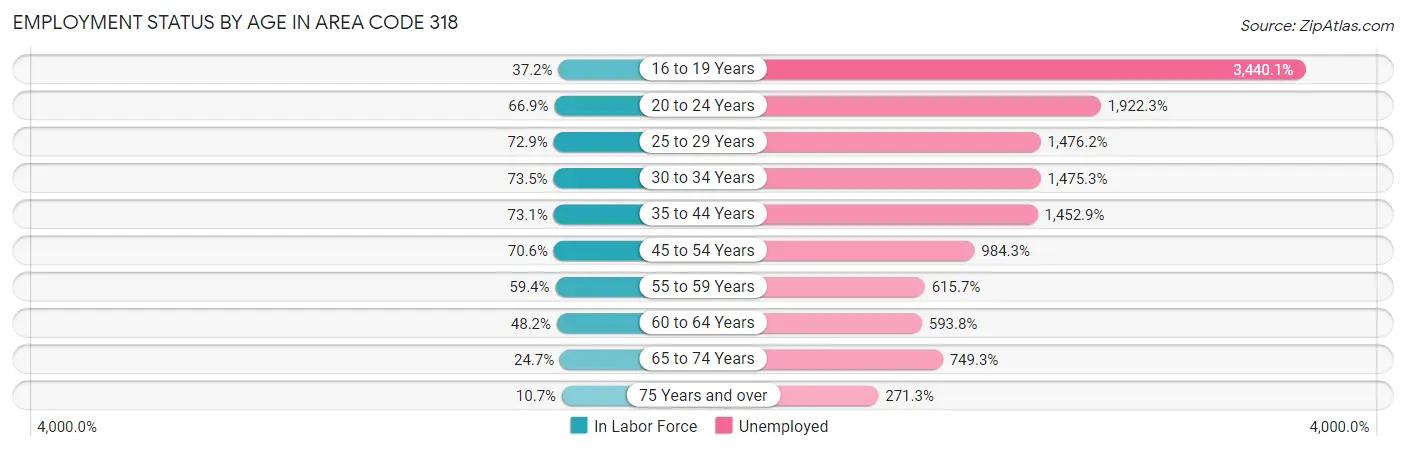
| Age Bracket | In Labor Force | Unemployed |
| 16 to 19 Years | 22,812 (37.2%) | 784,687 (3,440.1%) |
| 20 to 24 Years | 52,250 (66.9%) | 1,004,421 (1,922.3%) |
| 25 to 29 Years | 53,238 (72.9%) | 785,855 (1,476.2%) |
| 30 to 34 Years | 54,170 (73.5%) | 799,170 (1,475.3%) |
| 35 to 44 Years | 103,044 (73.1%) | 1,497,039 (1,452.9%) |
| 45 to 54 Years | 90,007 (70.6%) | 885,880 (984.3%) |
| 55 to 59 Years | 42,780 (59.4%) | 263,409 (615.7%) |
| 60 to 64 Years | 34,806 (48.2%) | 206,684 (593.8%) |
| 65 to 74 Years | 27,992 (24.7%) | 209,767 (749.3%) |
| 75 Years and over | 8,410 (10.7%) | 22,808 (271.3%) |
| Total | 457,258 (51.3%) | 38,430 (8.4%) |
Employment Status by Educational Attainment in Area Code 318
According to labor force statistics for Area Code 318, 66.1% of individuals (369,631) out of the total population between 25 and 64 years of age (559,454) are in the labor force, with 1,226.4% or 4,533,155 of them being unemployed. The group with the highest labor force participation rate are those with the educational attainment of bachelor's degree or higher, with 83.2% or 98,892 individuals in the labor force. Within the labor force, individuals with less than high school education have the highest percentage of unemployment, with 1,892.6% or 738,360 of them being unemployed.
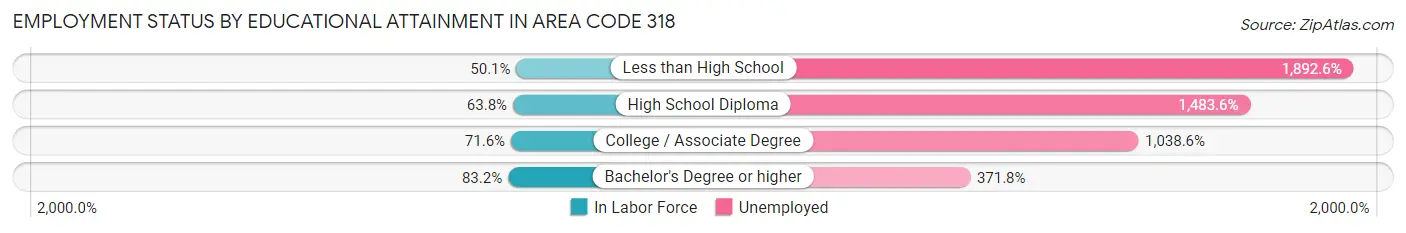
| Educational Attainment | In Labor Force | Unemployed |
| Less than High School | 39,015 (50.1%) | 1,474,052 (1,892.6%) |
| High School Diploma | 127,052 (63.7%) | 2,956,681 (1,483.6%) |
| College / Associate Degree | 117,014 (71.6%) | 1,697,851 (1,038.6%) |
| Bachelor's Degree or higher | 98,891 (83.2%) | 441,710 (371.8%) |
| Total | 369,614 (66.1%) | 6,861,144 (1,226.4%) |
Employment Occupations by Sex in Area Code 318
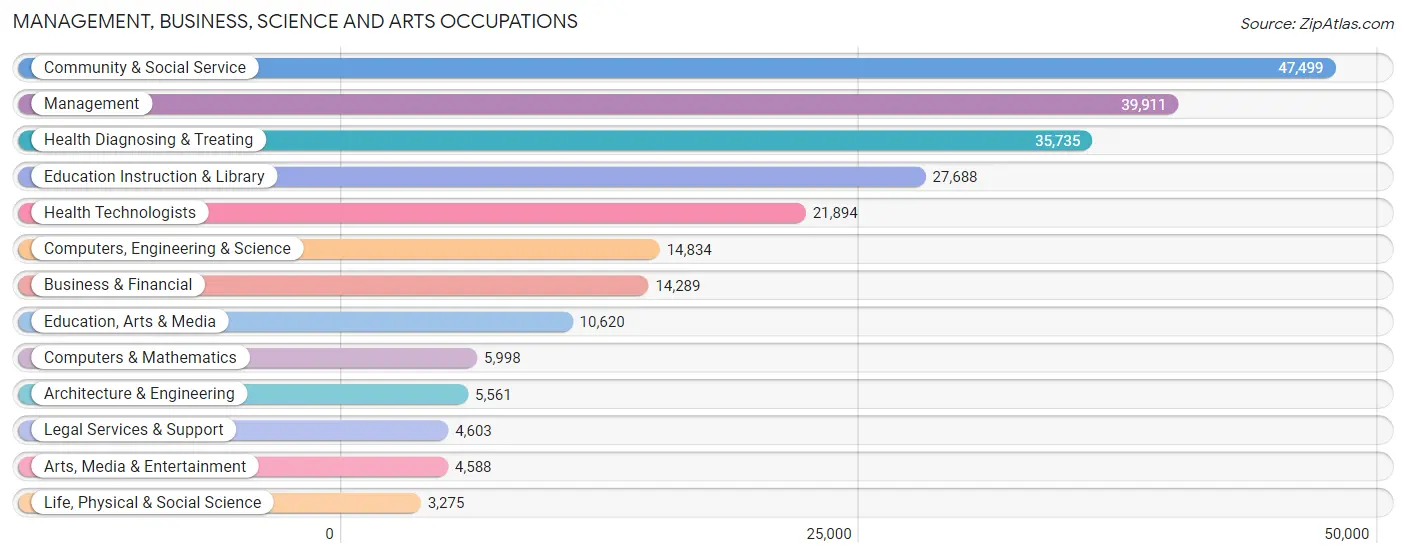
Management, Business, Science and Arts Occupations
The most common Management, Business, Science and Arts occupations in Area Code 318 are Community & Social Service (47,499 | 10.7%), Management (39,911 | 9.0%), Health Diagnosing & Treating (35,735 | 8.1%), Education Instruction & Library (27,688 | 6.2%), and Health Technologists (21,894 | 4.9%).
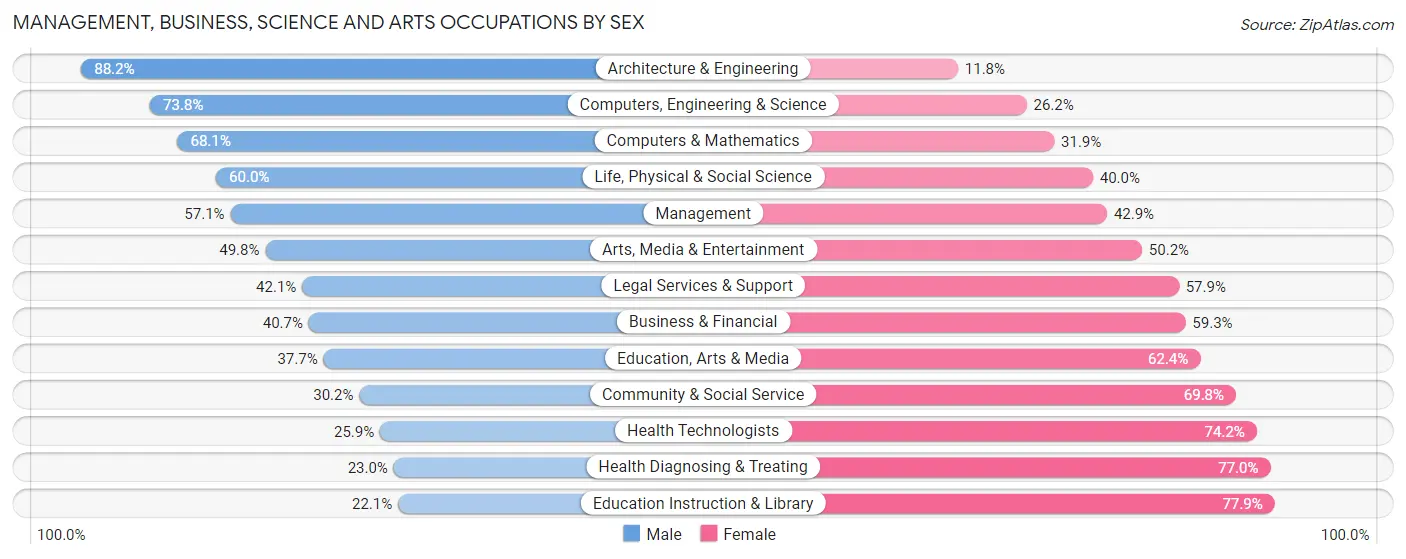
Management, Business, Science and Arts Occupations by Sex
Within the Management, Business, Science and Arts occupations in Area Code 318, the most male-oriented occupations are Architecture & Engineering (88.2%), Computers, Engineering & Science (73.8%), and Computers & Mathematics (68.1%), while the most female-oriented occupations are Education Instruction & Library (77.9%), Health Diagnosing & Treating (77.0%), and Health Technologists (74.2%).
| Occupation | Male | Female |
| Management | 22,777 (57.1%) | 17,134 (42.9%) |
| Business & Financial | 5,817 (40.7%) | 8,472 (59.3%) |
| Computers, Engineering & Science | 10,953 (73.8%) | 3,881 (26.2%) |
| Computers & Mathematics | 4,084 (68.1%) | 1,914 (31.9%) |
| Architecture & Engineering | 4,903 (88.2%) | 658 (11.8%) |
| Life, Physical & Social Science | 1,966 (60.0%) | 1,309 (40.0%) |
| Community & Social Service | 14,339 (30.2%) | 33,160 (69.8%) |
| Education, Arts & Media | 3,998 (37.7%) | 6,622 (62.4%) |
| Legal Services & Support | 1,938 (42.1%) | 2,665 (57.9%) |
| Education Instruction & Library | 6,119 (22.1%) | 21,569 (77.9%) |
| Arts, Media & Entertainment | 2,284 (49.8%) | 2,304 (50.2%) |
| Health Diagnosing & Treating | 8,220 (23.0%) | 27,515 (77.0%) |
| Health Technologists | 5,660 (25.9%) | 16,234 (74.2%) |
| Total (Category) | 62,106 (40.8%) | 90,162 (59.2%) |
| Total (Overall) | 224,573 (50.7%) | 218,319 (49.3%) |
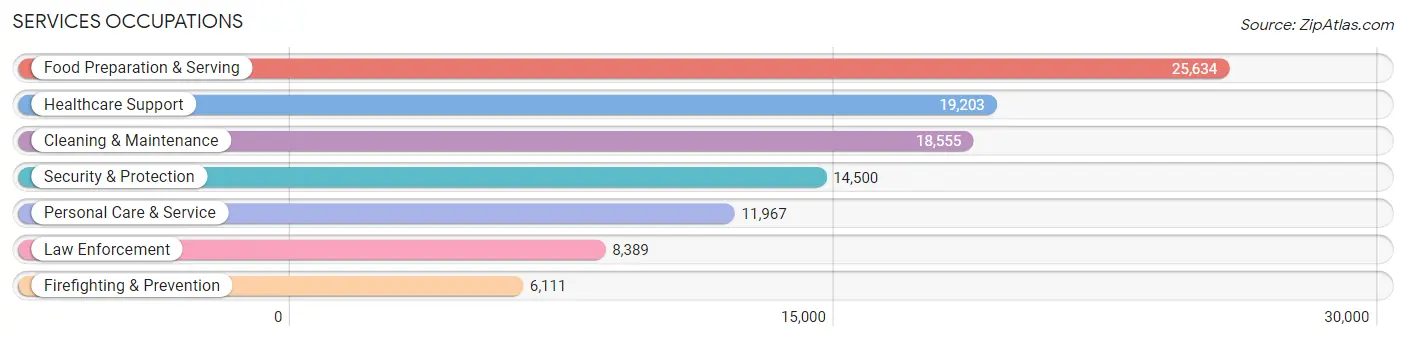
Services Occupations
The most common Services occupations in Area Code 318 are Food Preparation & Serving (25,634 | 5.8%), Healthcare Support (19,203 | 4.3%), Cleaning & Maintenance (18,555 | 4.2%), Security & Protection (14,500 | 3.3%), and Personal Care & Service (11,967 | 2.7%).
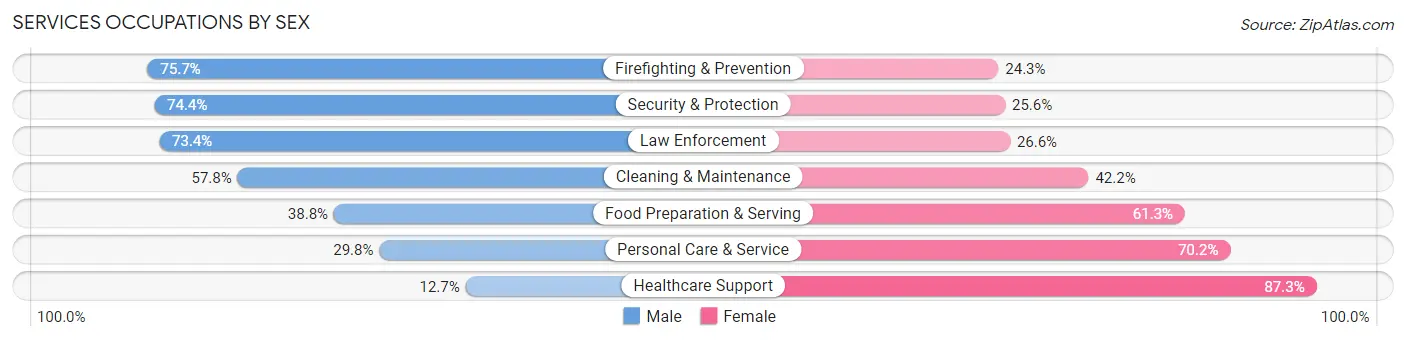
Services Occupations by Sex
Within the Services occupations in Area Code 318, the most male-oriented occupations are Firefighting & Prevention (75.7%), Security & Protection (74.4%), and Law Enforcement (73.4%), while the most female-oriented occupations are Healthcare Support (87.3%), Personal Care & Service (70.2%), and Food Preparation & Serving (61.3%).
| Occupation | Male | Female |
| Healthcare Support | 2,437 (12.7%) | 16,766 (87.3%) |
| Security & Protection | 10,782 (74.4%) | 3,718 (25.6%) |
| Firefighting & Prevention | 4,625 (75.7%) | 1,486 (24.3%) |
| Law Enforcement | 6,157 (73.4%) | 2,232 (26.6%) |
| Food Preparation & Serving | 9,932 (38.8%) | 15,702 (61.3%) |
| Cleaning & Maintenance | 10,731 (57.8%) | 7,824 (42.2%) |
| Personal Care & Service | 3,562 (29.8%) | 8,405 (70.2%) |
| Total (Category) | 37,444 (41.7%) | 52,415 (58.3%) |
| Total (Overall) | 224,573 (50.7%) | 218,319 (49.3%) |
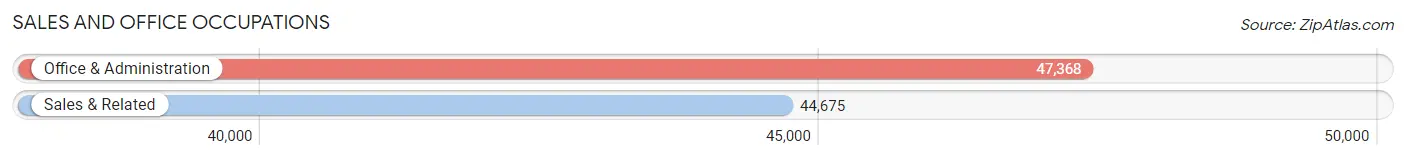
Sales and Office Occupations
The most common Sales and Office occupations in Area Code 318 are Office & Administration (47,368 | 10.7%), and Sales & Related (44,675 | 10.1%).
Sales and Office Occupations by Sex
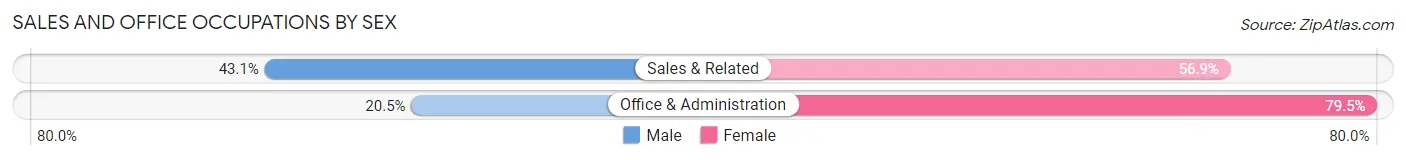
| Occupation | Male | Female |
| Sales & Related | 19,236 (43.1%) | 25,439 (56.9%) |
| Office & Administration | 9,708 (20.5%) | 37,660 (79.5%) |
| Total (Category) | 28,944 (31.5%) | 63,099 (68.5%) |
| Total (Overall) | 224,573 (50.7%) | 218,319 (49.3%) |
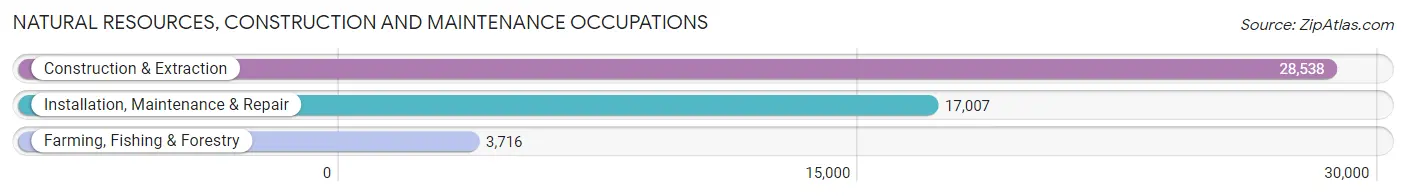
Natural Resources, Construction and Maintenance Occupations
The most common Natural Resources, Construction and Maintenance occupations in Area Code 318 are Construction & Extraction (28,538 | 6.4%), Installation, Maintenance & Repair (17,007 | 3.8%), and Farming, Fishing & Forestry (3,716 | 0.8%).
Natural Resources, Construction and Maintenance Occupations by Sex
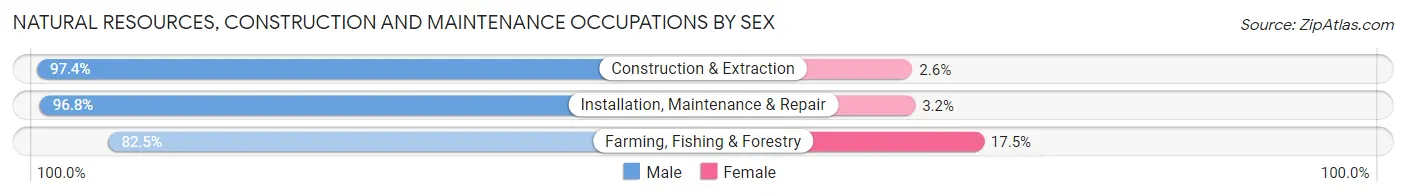
| Occupation | Male | Female |
| Farming, Fishing & Forestry | 3,067 (82.5%) | 649 (17.5%) |
| Construction & Extraction | 27,795 (97.4%) | 743 (2.6%) |
| Installation, Maintenance & Repair | 16,465 (96.8%) | 542 (3.2%) |
| Total (Category) | 47,327 (96.1%) | 1,934 (3.9%) |
| Total (Overall) | 224,573 (50.7%) | 218,319 (49.3%) |
Production, Transportation and Moving Occupations
The most common Production, Transportation and Moving occupations in Area Code 318 are Production (23,946 | 5.4%), Transportation (20,362 | 4.6%), and Material Moving (15,153 | 3.4%).
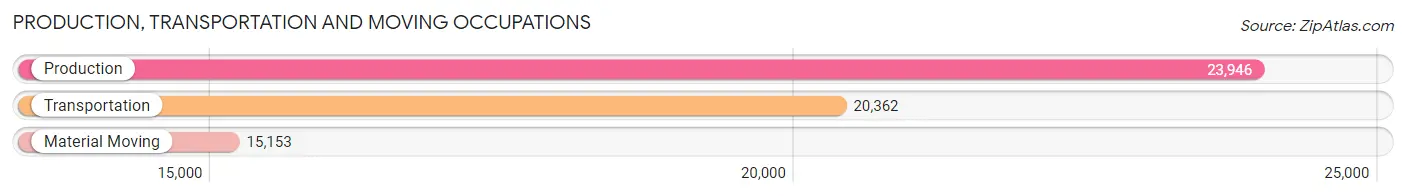
Production, Transportation and Moving Occupations by Sex
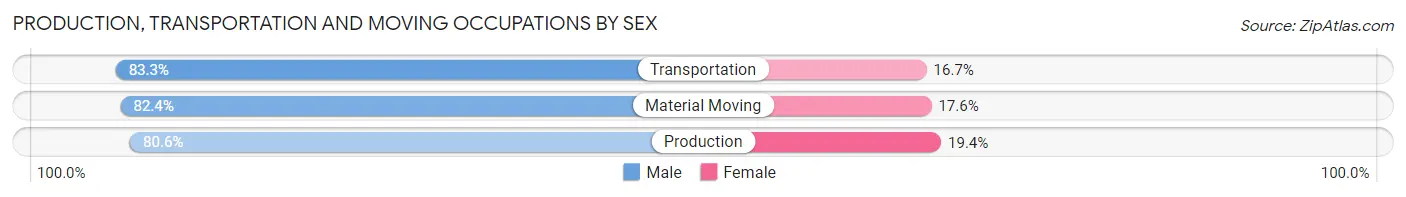
| Occupation | Male | Female |
| Production | 19,308 (80.6%) | 4,638 (19.4%) |
| Transportation | 16,958 (83.3%) | 3,404 (16.7%) |
| Material Moving | 12,486 (82.4%) | 2,667 (17.6%) |
| Total (Category) | 48,752 (82.0%) | 10,709 (18.0%) |
| Total (Overall) | 224,573 (50.7%) | 218,319 (49.3%) |
Employment Industries by Sex in Area Code 318
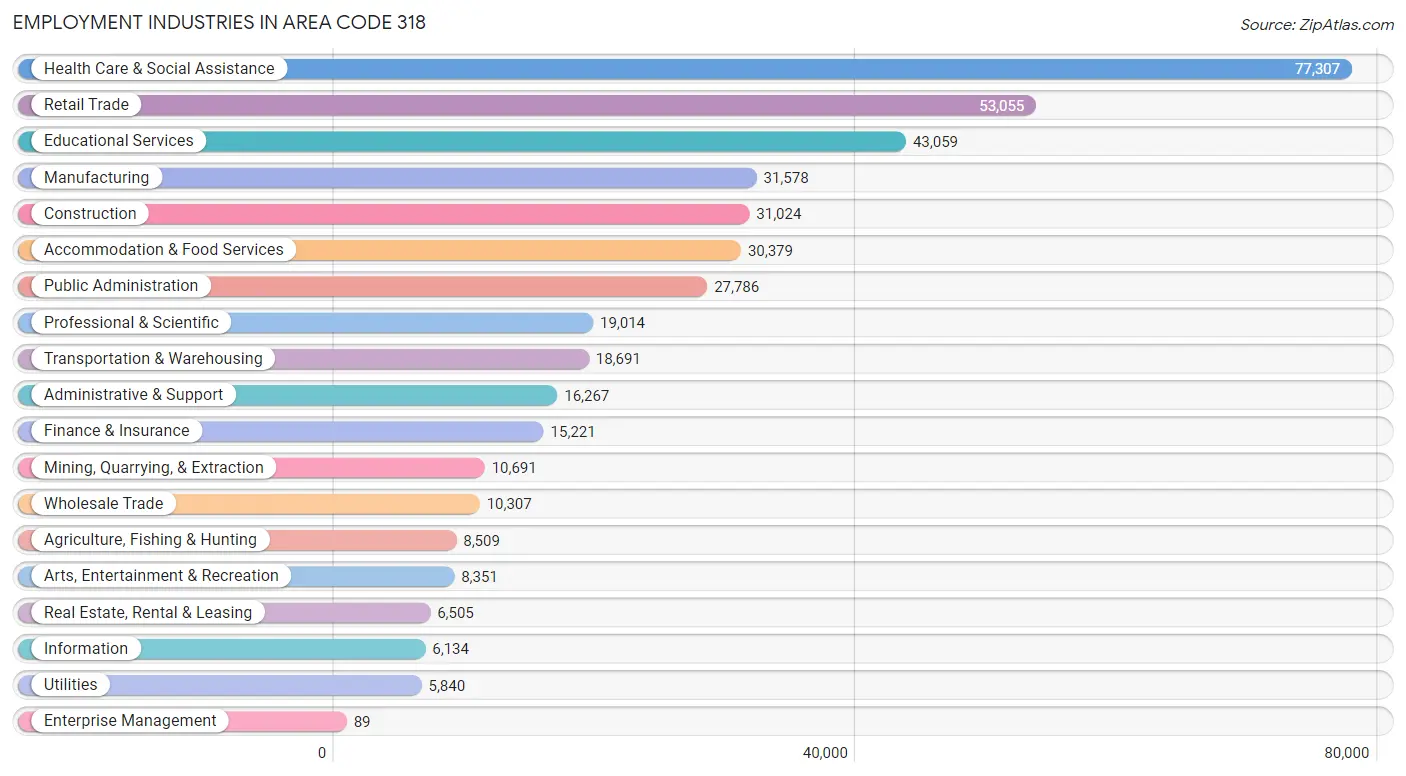
Employment Industries in Area Code 318
The major employment industries in Area Code 318 include Health Care & Social Assistance (77,307 | 17.5%), Retail Trade (53,055 | 12.0%), Educational Services (43,059 | 9.7%), Manufacturing (31,578 | 7.1%), and Construction (31,024 | 7.0%).
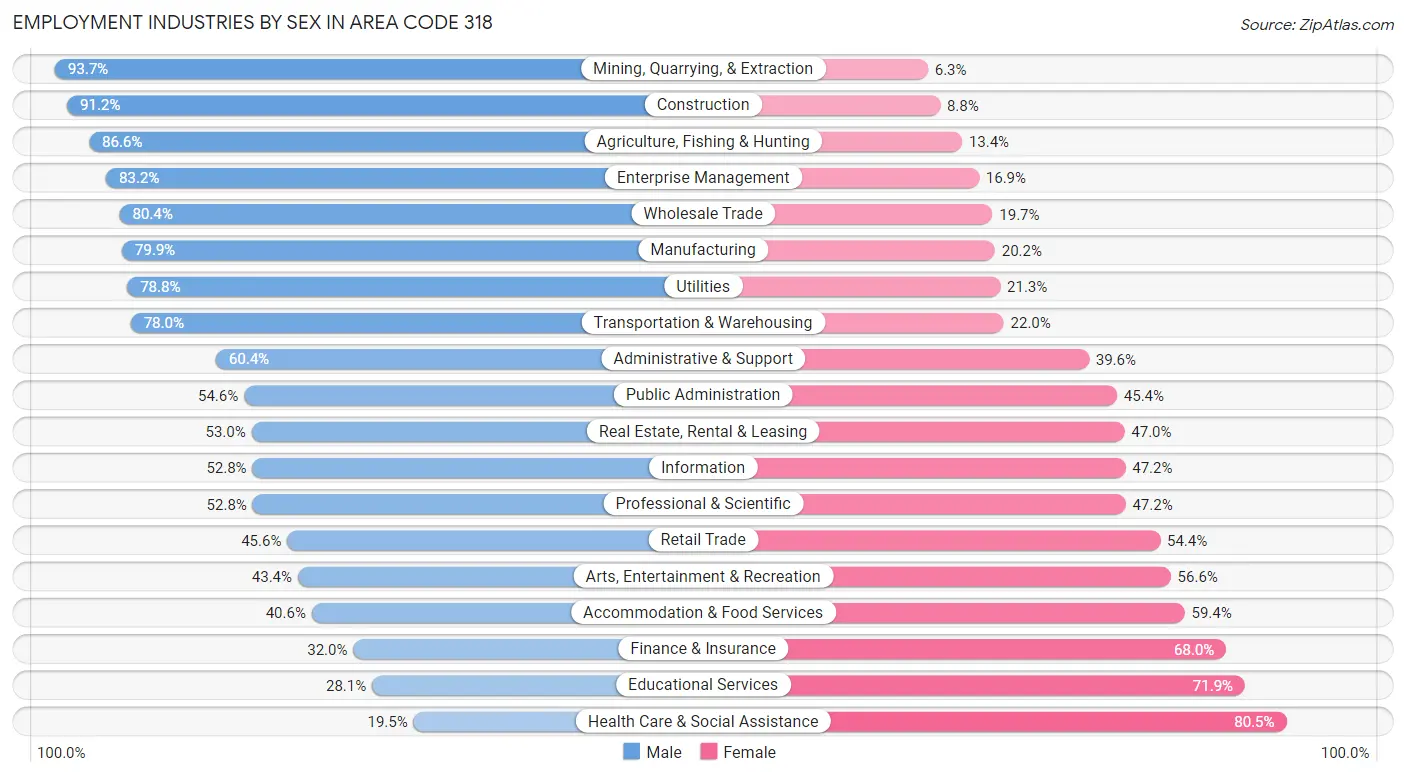
Employment Industries by Sex in Area Code 318
The Area Code 318 industries that see more men than women are Mining, Quarrying, & Extraction (93.7%), Construction (91.2%), and Agriculture, Fishing & Hunting (86.6%), whereas the industries that tend to have a higher number of women are Health Care & Social Assistance (80.5%), Educational Services (71.9%), and Finance & Insurance (68.0%).
| Industry | Male | Female |
| Agriculture, Fishing & Hunting | 7,372 (86.6%) | 1,137 (13.4%) |
| Mining, Quarrying, & Extraction | 10,020 (93.7%) | 671 (6.3%) |
| Construction | 28,292 (91.2%) | 2,732 (8.8%) |
| Manufacturing | 25,216 (79.8%) | 6,362 (20.2%) |
| Wholesale Trade | 8,282 (80.3%) | 2,025 (19.7%) |
| Retail Trade | 24,214 (45.6%) | 28,841 (54.4%) |
| Transportation & Warehousing | 14,582 (78.0%) | 4,109 (22.0%) |
| Utilities | 4,599 (78.7%) | 1,241 (21.2%) |
| Information | 3,241 (52.8%) | 2,893 (47.2%) |
| Finance & Insurance | 4,865 (32.0%) | 10,356 (68.0%) |
| Real Estate, Rental & Leasing | 3,449 (53.0%) | 3,056 (47.0%) |
| Professional & Scientific | 10,038 (52.8%) | 8,976 (47.2%) |
| Enterprise Management | 74 (83.2%) | 15 (16.9%) |
| Administrative & Support | 9,824 (60.4%) | 6,443 (39.6%) |
| Educational Services | 12,089 (28.1%) | 30,970 (71.9%) |
| Health Care & Social Assistance | 15,073 (19.5%) | 62,234 (80.5%) |
| Arts, Entertainment & Recreation | 3,628 (43.4%) | 4,723 (56.6%) |
| Accommodation & Food Services | 12,324 (40.6%) | 18,055 (59.4%) |
| Public Administration | 15,166 (54.6%) | 12,620 (45.4%) |
| Total | 224,573 (50.7%) | 218,319 (49.3%) |
Education in Area Code 318
School Enrollment in Area Code 318
The most common levels of schooling among the 275,059 students in Area Code 318 are middle school (60,840 | 22.1%), high school (60,516 | 22.0%), and elementary school (57,125 | 20.8%).
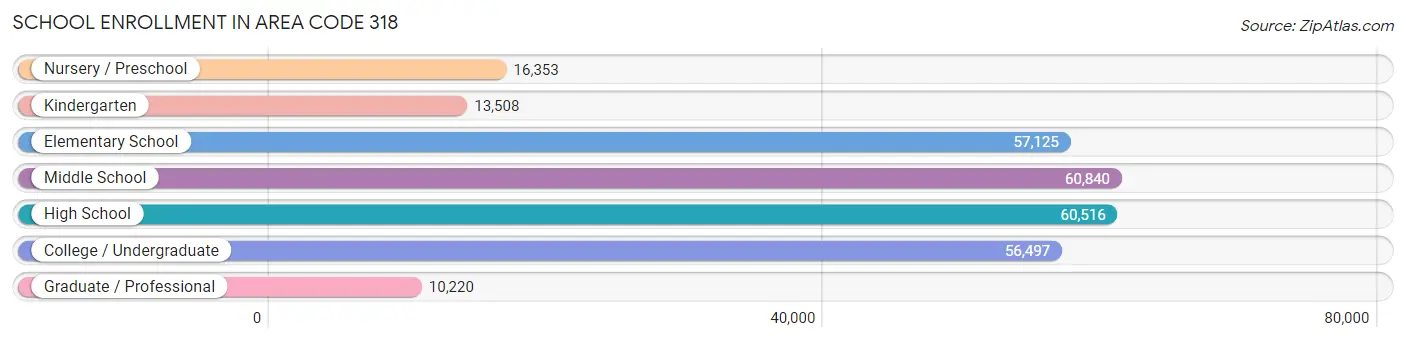
| School Level | # Students | % Students |
| Nursery / Preschool | 16,353 | 5.9% |
| Kindergarten | 13,508 | 4.9% |
| Elementary School | 57,125 | 20.8% |
| Middle School | 60,840 | 22.1% |
| High School | 60,516 | 22.0% |
| College / Undergraduate | 56,497 | 20.5% |
| Graduate / Professional | 10,220 | 3.7% |
| Total | 275,059 | 100.0% |
School Enrollment by Age by Funding Source in Area Code 318
Out of a total of 275,059 students who are enrolled in schools in Area Code 318, 37,347 (13.6%) attend a private institution, while the remaining 237,712 (86.4%) are enrolled in public schools. The age group of 3 to 4 year olds has the highest likelihood of being enrolled in private schools, with 3,420 (25.0% in the age bracket) enrolled. Conversely, the age group of 18 to 19 year olds has the lowest likelihood of being enrolled in a private school, with 18,005 (89.6% in the age bracket) attending a public institution.
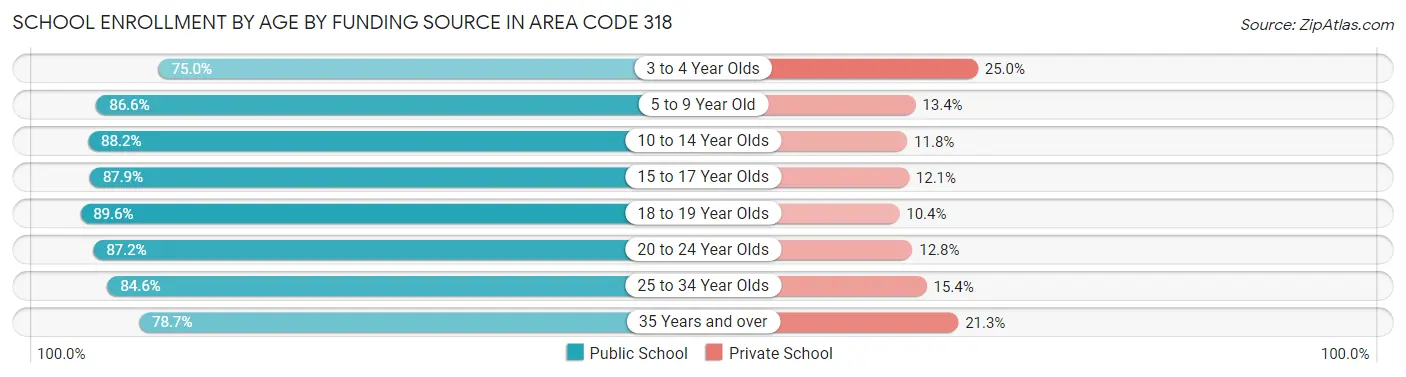
| Age Bracket | Public School | Private School |
| 3 to 4 Year Olds | 10,271 (75.0%) | 3,420 (25.0%) |
| 5 to 9 Year Old | 57,650 (86.6%) | 8,890 (13.4%) |
| 10 to 14 Year Olds | 66,071 (88.2%) | 8,859 (11.8%) |
| 15 to 17 Year Olds | 37,545 (87.9%) | 5,189 (12.1%) |
| 18 to 19 Year Olds | 18,005 (89.6%) | 2,080 (10.4%) |
| 20 to 24 Year Olds | 24,562 (87.2%) | 3,602 (12.8%) |
| 25 to 34 Year Olds | 12,552 (84.6%) | 2,291 (15.4%) |
| 35 Years and over | 11,070 (78.7%) | 3,002 (21.3%) |
| Total | 237,712 (86.4%) | 37,347 (13.6%) |
Educational Attainment by Field of Study in Area Code 318
Education (30,548 | 18.0%), business (30,394 | 17.9%), science & technology (23,453 | 13.8%), arts & humanities (14,850 | 8.7%), and liberal arts & history (13,717 | 8.1%) are the most common fields of study among 170,105 individuals in Area Code 318 who have obtained a bachelor's degree or higher.
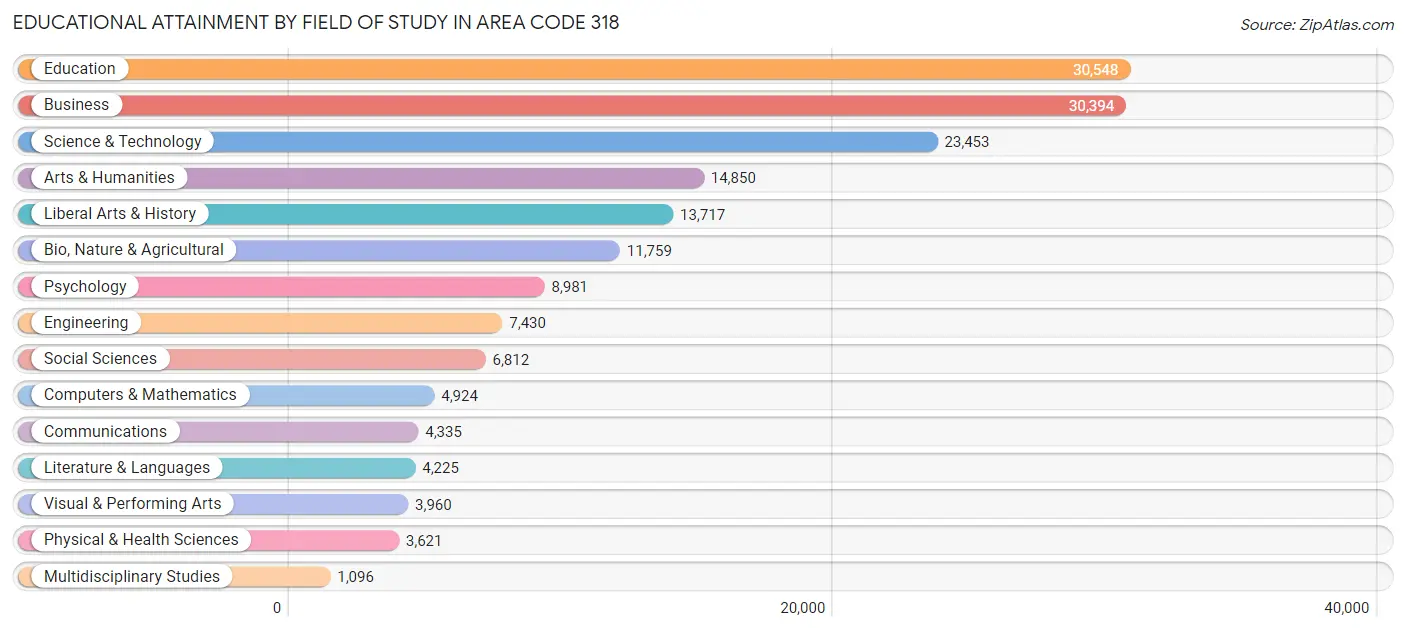
| Field of Study | # Graduates | % Graduates |
| Computers & Mathematics | 4,924 | 2.9% |
| Bio, Nature & Agricultural | 11,759 | 6.9% |
| Physical & Health Sciences | 3,621 | 2.1% |
| Psychology | 8,981 | 5.3% |
| Social Sciences | 6,812 | 4.0% |
| Engineering | 7,430 | 4.4% |
| Multidisciplinary Studies | 1,096 | 0.6% |
| Science & Technology | 23,453 | 13.8% |
| Business | 30,394 | 17.9% |
| Education | 30,548 | 18.0% |
| Literature & Languages | 4,225 | 2.5% |
| Liberal Arts & History | 13,717 | 8.1% |
| Visual & Performing Arts | 3,960 | 2.3% |
| Communications | 4,335 | 2.5% |
| Arts & Humanities | 14,850 | 8.7% |
| Total | 170,105 | 100.0% |
Transportation & Commute in Area Code 318
Vehicle Availability by Sex in Area Code 318
The most prevalent vehicle ownership categories in Area Code 318 are males with 2 vehicles (96,081, accounting for 42.9%) and females with 2 vehicles (83,306, making up 45.2%).
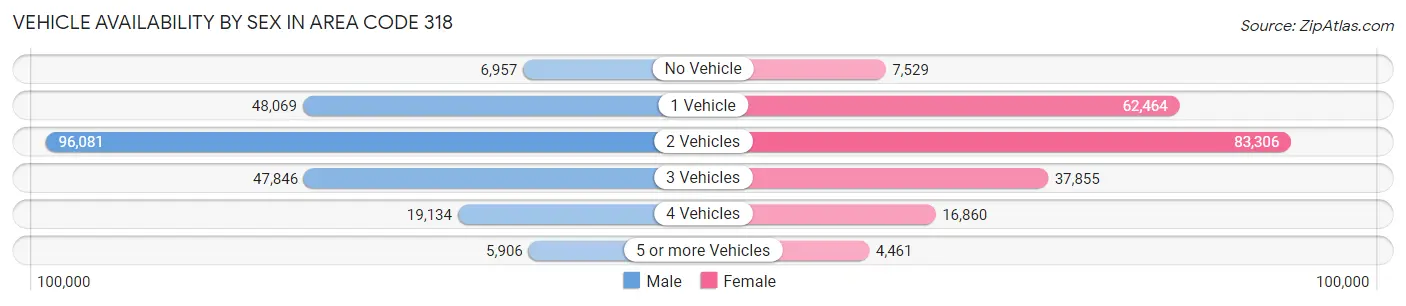
| Vehicles Available | Male | Female |
| No Vehicle | 6,957 (3.1%) | 7,529 (3.5%) |
| 1 Vehicle | 48,069 (21.5%) | 62,464 (29.4%) |
| 2 Vehicles | 96,081 (42.9%) | 83,306 (39.2%) |
| 3 Vehicles | 47,846 (21.4%) | 37,855 (17.8%) |
| 4 Vehicles | 19,134 (8.5%) | 16,860 (7.9%) |
| 5 or more Vehicles | 5,906 (2.6%) | 4,461 (2.1%) |
| Total | 223,993 (100.0%) | 212,475 (100.0%) |
Commute Time in Area Code 318
The most frequently occuring commute durations in Area Code 318 are 15 to 19 minutes (81,835 commuters, 19.5%), 10 to 14 minutes (71,156 commuters, 17.0%), and 20 to 24 minutes (62,040 commuters, 14.8%).
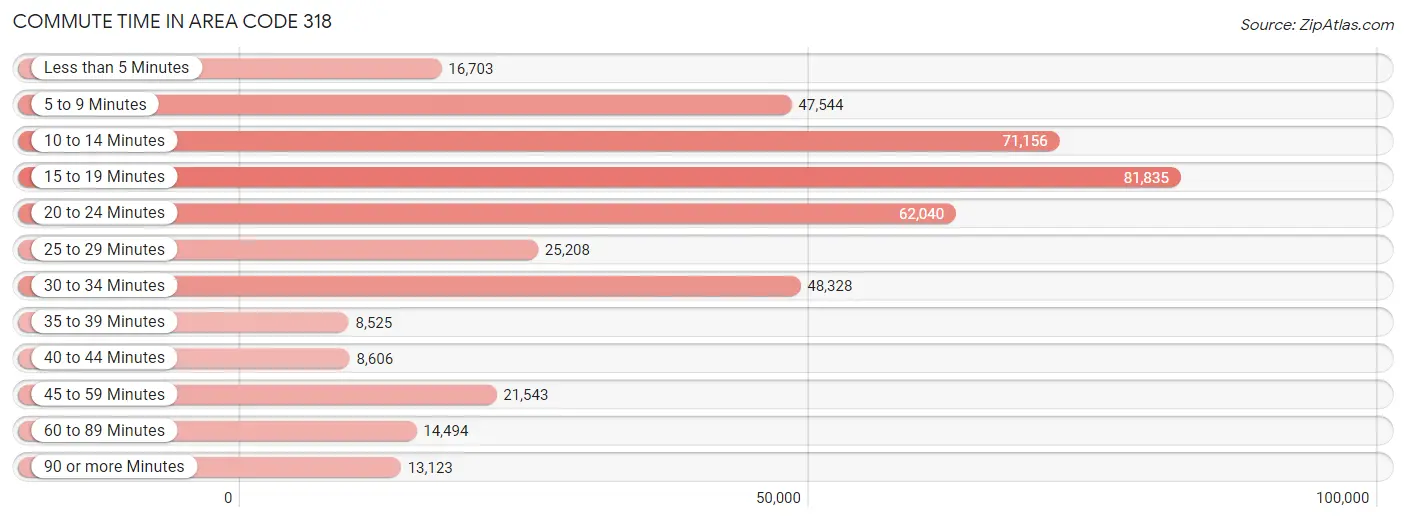
| Commute Time | # Commuters | % Commuters |
| Less than 5 Minutes | 16,703 | 4.0% |
| 5 to 9 Minutes | 47,544 | 11.3% |
| 10 to 14 Minutes | 71,156 | 17.0% |
| 15 to 19 Minutes | 81,835 | 19.5% |
| 20 to 24 Minutes | 62,040 | 14.8% |
| 25 to 29 Minutes | 25,208 | 6.0% |
| 30 to 34 Minutes | 48,328 | 11.5% |
| 35 to 39 Minutes | 8,525 | 2.0% |
| 40 to 44 Minutes | 8,606 | 2.1% |
| 45 to 59 Minutes | 21,543 | 5.1% |
| 60 to 89 Minutes | 14,494 | 3.5% |
| 90 or more Minutes | 13,123 | 3.1% |
Commute Time by Sex in Area Code 318
The most common commute times in Area Code 318 are 15 to 19 minutes (39,982 commuters, 18.5%) for males and 15 to 19 minutes (41,853 commuters, 20.6%) for females.
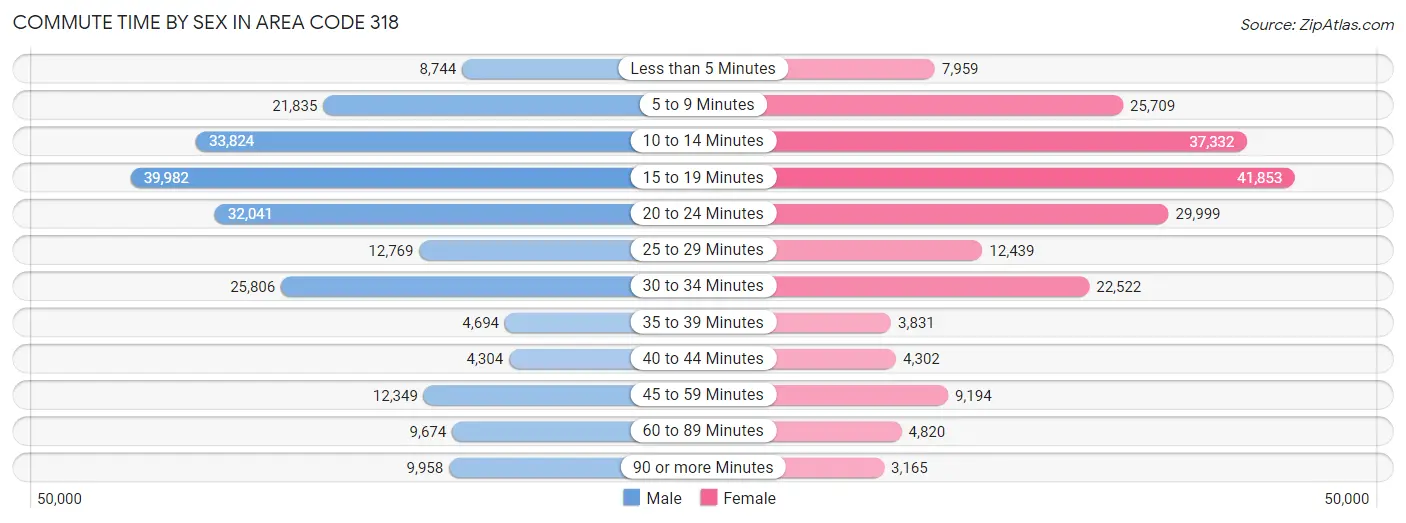
| Commute Time | Male | Female |
| Less than 5 Minutes | 8,744 (4.1%) | 7,959 (3.9%) |
| 5 to 9 Minutes | 21,835 (10.1%) | 25,709 (12.7%) |
| 10 to 14 Minutes | 33,824 (15.7%) | 37,332 (18.4%) |
| 15 to 19 Minutes | 39,982 (18.5%) | 41,853 (20.6%) |
| 20 to 24 Minutes | 32,041 (14.8%) | 29,999 (14.8%) |
| 25 to 29 Minutes | 12,769 (5.9%) | 12,439 (6.1%) |
| 30 to 34 Minutes | 25,806 (11.9%) | 22,522 (11.1%) |
| 35 to 39 Minutes | 4,694 (2.2%) | 3,831 (1.9%) |
| 40 to 44 Minutes | 4,304 (2.0%) | 4,302 (2.1%) |
| 45 to 59 Minutes | 12,349 (5.7%) | 9,194 (4.5%) |
| 60 to 89 Minutes | 9,674 (4.5%) | 4,820 (2.4%) |
| 90 or more Minutes | 9,958 (4.6%) | 3,165 (1.6%) |
Time of Departure to Work by Sex in Area Code 318
The most frequent times of departure to work in Area Code 318 are 7:00 AM to 7:29 AM (34,667, 16.1%) for males and 7:00 AM to 7:29 AM (35,225, 17.3%) for females.
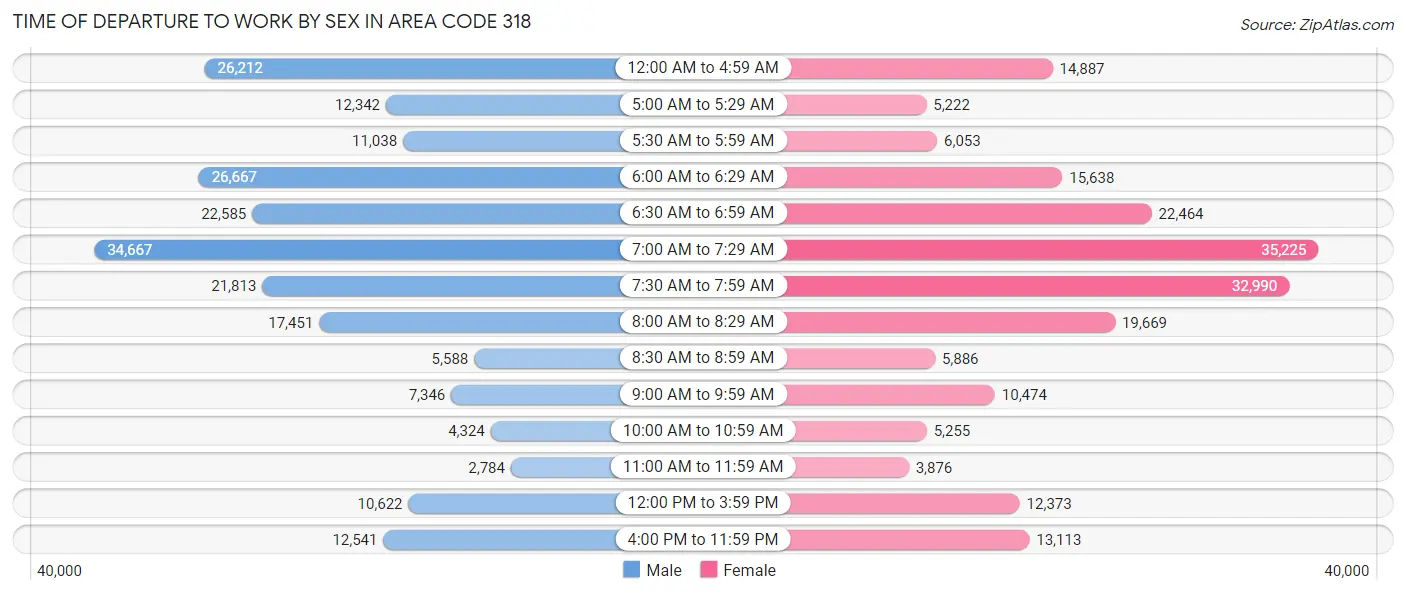
| Time of Departure | Male | Female |
| 12:00 AM to 4:59 AM | 26,212 (12.1%) | 14,887 (7.3%) |
| 5:00 AM to 5:29 AM | 12,342 (5.7%) | 5,222 (2.6%) |
| 5:30 AM to 5:59 AM | 11,038 (5.1%) | 6,053 (3.0%) |
| 6:00 AM to 6:29 AM | 26,667 (12.3%) | 15,638 (7.7%) |
| 6:30 AM to 6:59 AM | 22,585 (10.5%) | 22,464 (11.1%) |
| 7:00 AM to 7:29 AM | 34,667 (16.1%) | 35,225 (17.3%) |
| 7:30 AM to 7:59 AM | 21,813 (10.1%) | 32,990 (16.2%) |
| 8:00 AM to 8:29 AM | 17,451 (8.1%) | 19,669 (9.7%) |
| 8:30 AM to 8:59 AM | 5,588 (2.6%) | 5,886 (2.9%) |
| 9:00 AM to 9:59 AM | 7,346 (3.4%) | 10,474 (5.2%) |
| 10:00 AM to 10:59 AM | 4,324 (2.0%) | 5,255 (2.6%) |
| 11:00 AM to 11:59 AM | 2,784 (1.3%) | 3,876 (1.9%) |
| 12:00 PM to 3:59 PM | 10,622 (4.9%) | 12,373 (6.1%) |
| 4:00 PM to 11:59 PM | 12,541 (5.8%) | 13,113 (6.5%) |
| Total | 215,980 (100.0%) | 203,125 (100.0%) |
Housing Occupancy in Area Code 318
Occupancy by Ownership in Area Code 318
Of the total 422,260 dwellings in Area Code 318, owner-occupied units account for 273,033 (64.7%), while renter-occupied units make up 149,227 (35.3%).
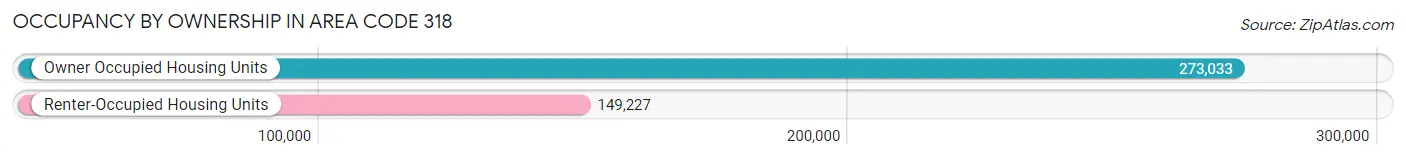
| Occupancy | # Housing Units | % Housing Units |
| Owner Occupied Housing Units | 273,033 | 64.7% |
| Renter-Occupied Housing Units | 149,227 | 35.3% |
| Total Occupied Housing Units | 422,260 | 100.0% |
Occupancy by Household Size in Area Code 318
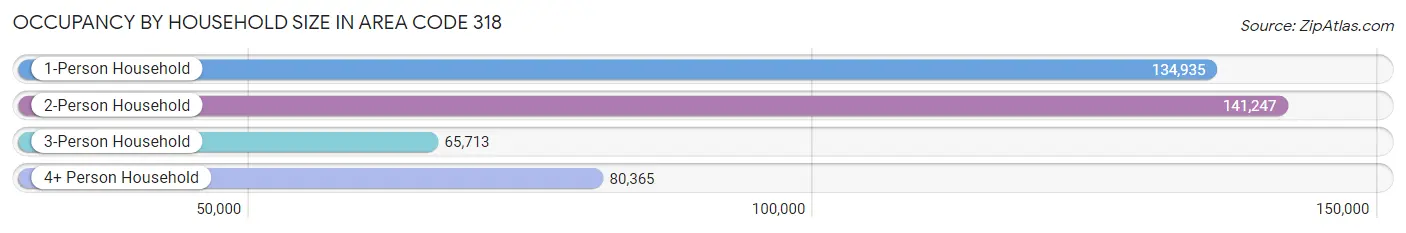
| Household Size | # Housing Units | % Housing Units |
| 1-Person Household | 134,935 | 32.0% |
| 2-Person Household | 141,247 | 33.5% |
| 3-Person Household | 65,713 | 15.6% |
| 4+ Person Household | 80,365 | 19.0% |
| Total Housing Units | 422,260 | 100.0% |
Occupancy by Ownership by Household Size in Area Code 318
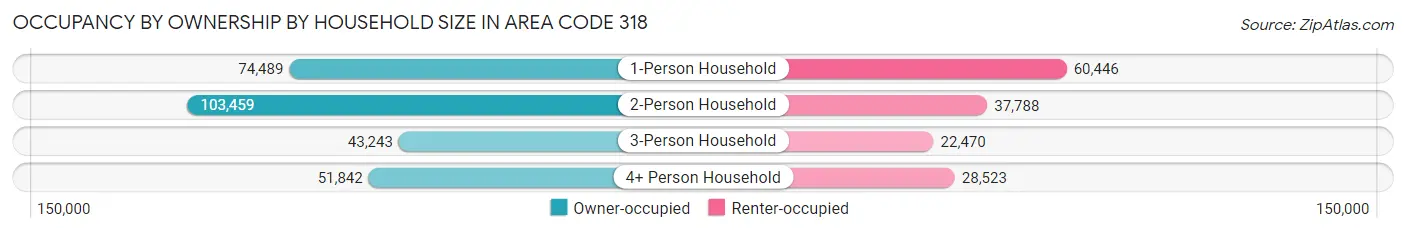
| Household Size | Owner-occupied | Renter-occupied |
| 1-Person Household | 74,489 (55.2%) | 60,446 (44.8%) |
| 2-Person Household | 103,459 (73.3%) | 37,788 (26.8%) |
| 3-Person Household | 43,243 (65.8%) | 22,470 (34.2%) |
| 4+ Person Household | 51,842 (64.5%) | 28,523 (35.5%) |
| Total Housing Units | 273,033 (64.7%) | 149,227 (35.3%) |
Occupancy by Educational Attainment in Area Code 318
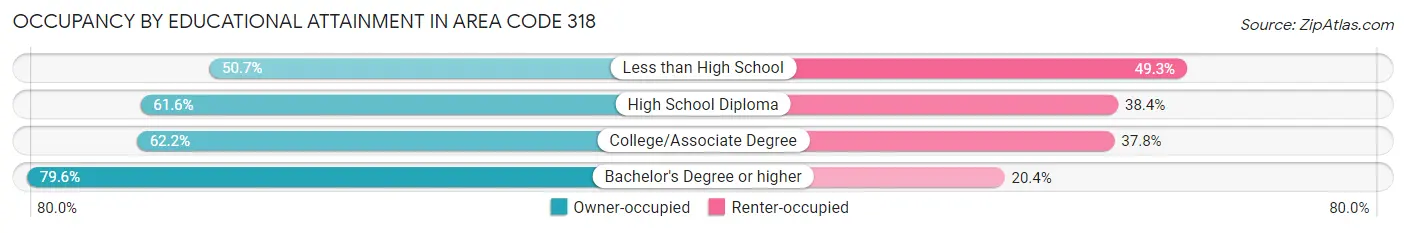
| Household Size | Owner-occupied | Renter-occupied |
| Less than High School | 26,157 (50.7%) | 25,418 (49.3%) |
| High School Diploma | 88,115 (61.6%) | 54,866 (38.4%) |
| College/Associate Degree | 80,607 (62.2%) | 48,961 (37.8%) |
| Bachelor's Degree or higher | 78,154 (79.6%) | 19,982 (20.4%) |
Occupancy by Age of Householder in Area Code 318
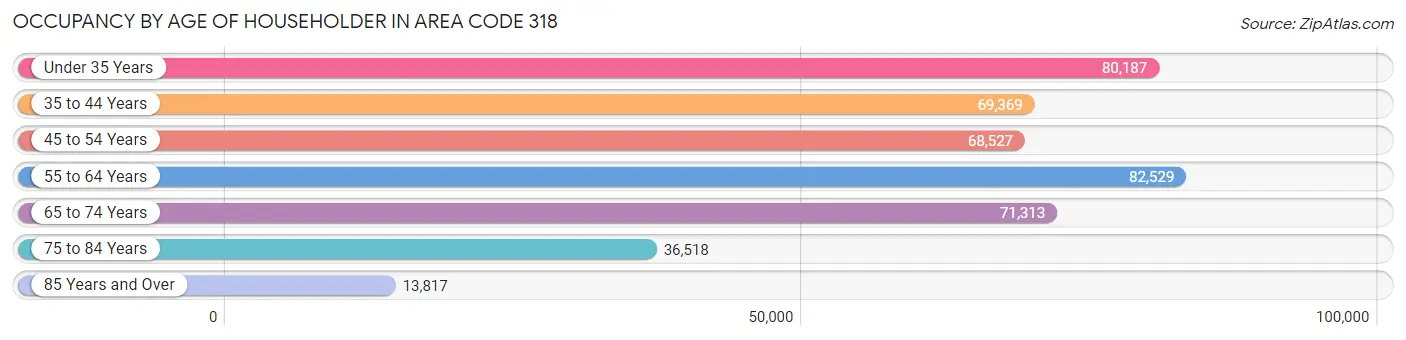
| Age Bracket | # Households | % Households |
| Under 35 Years | 80,187 | 19.0% |
| 35 to 44 Years | 69,369 | 16.4% |
| 45 to 54 Years | 68,527 | 16.2% |
| 55 to 64 Years | 82,529 | 19.5% |
| 65 to 74 Years | 71,313 | 16.9% |
| 75 to 84 Years | 36,518 | 8.6% |
| 85 Years and Over | 13,817 | 3.3% |
| Total | 422,260 | 100.0% |
Housing Finances in Area Code 318
Median Income by Occupancy in Area Code 318
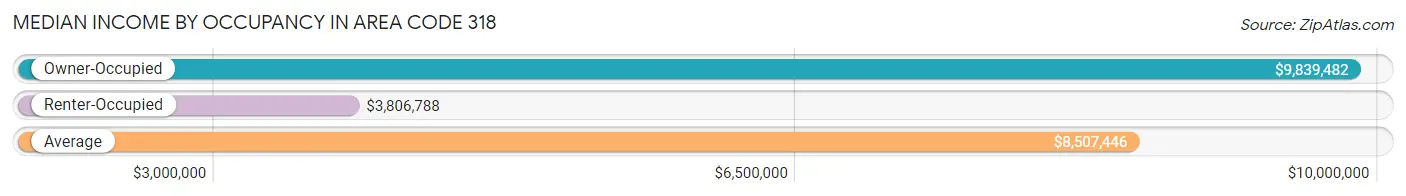
| Occupancy Type | # Households | Median Income |
| Owner-Occupied | 273,033 (64.7%) | $9,839,482 |
| Renter-Occupied | 149,227 (35.3%) | $3,806,788 |
| Average | 422,260 (100.0%) | $8,507,446 |
Occupancy by Householder Income Bracket in Area Code 318
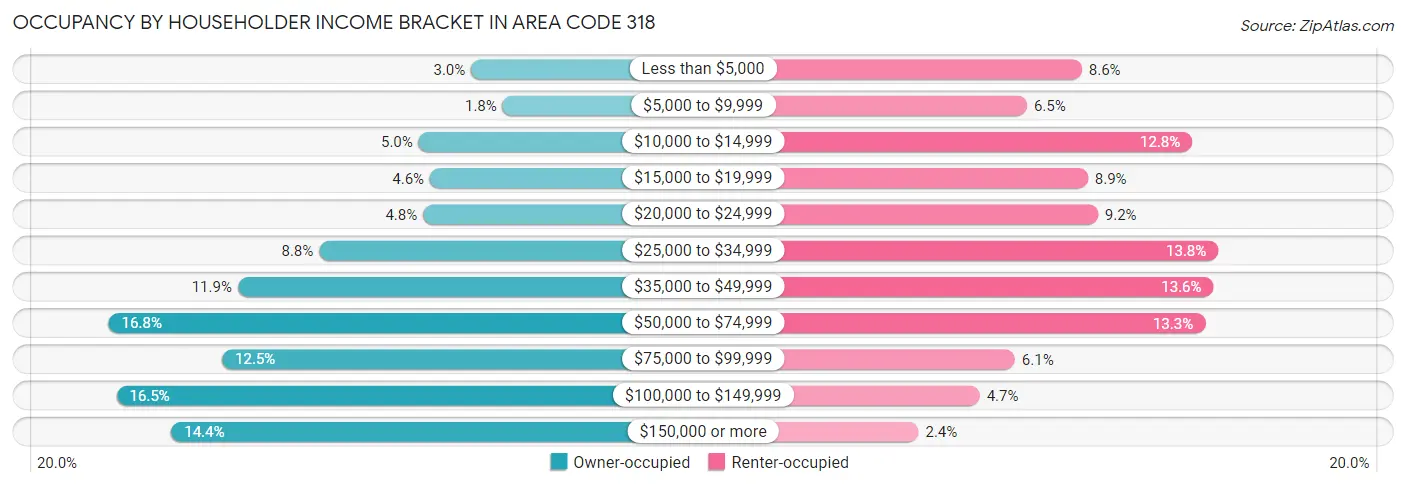
| Income Bracket | Owner-occupied | Renter-occupied |
| Less than $5,000 | 8,167 (3.0%) | 12,868 (8.6%) |
| $5,000 to $9,999 | 4,890 (1.8%) | 9,742 (6.5%) |
| $10,000 to $14,999 | 13,625 (5.0%) | 19,127 (12.8%) |
| $15,000 to $19,999 | 12,439 (4.6%) | 13,202 (8.8%) |
| $20,000 to $24,999 | 13,165 (4.8%) | 13,773 (9.2%) |
| $25,000 to $34,999 | 23,979 (8.8%) | 20,606 (13.8%) |
| $35,000 to $49,999 | 32,436 (11.9%) | 20,335 (13.6%) |
| $50,000 to $74,999 | 45,879 (16.8%) | 19,869 (13.3%) |
| $75,000 to $99,999 | 34,081 (12.5%) | 9,062 (6.1%) |
| $100,000 to $149,999 | 45,039 (16.5%) | 7,065 (4.7%) |
| $150,000 or more | 39,333 (14.4%) | 3,578 (2.4%) |
| Total | 273,033 (100.0%) | 149,227 (100.0%) |
Monthly Housing Cost Tiers in Area Code 318
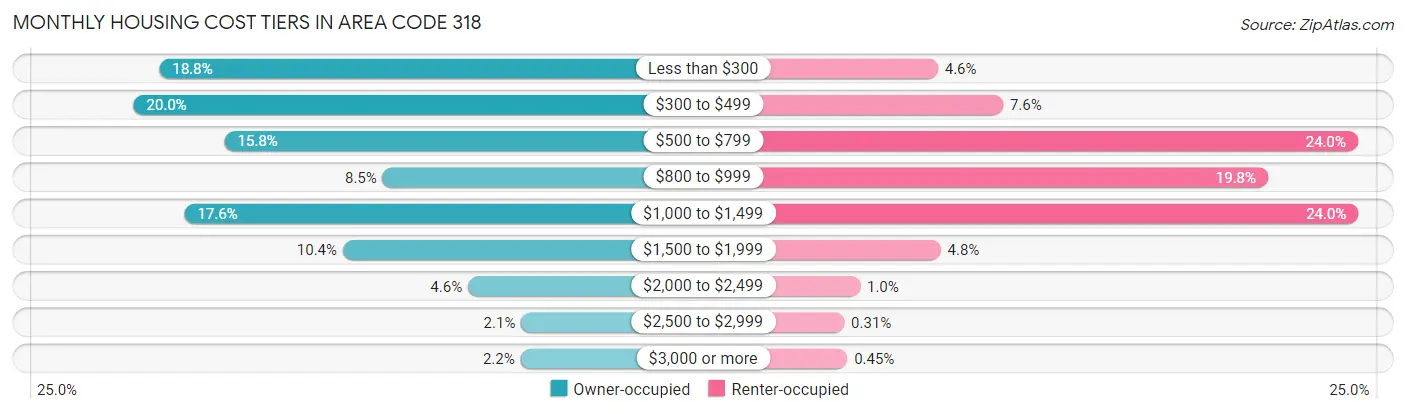
| Monthly Cost | Owner-occupied | Renter-occupied |
| Less than $300 | 51,337 (18.8%) | 6,896 (4.6%) |
| $300 to $499 | 54,572 (20.0%) | 11,374 (7.6%) |
| $500 to $799 | 43,141 (15.8%) | 35,733 (23.9%) |
| $800 to $999 | 23,256 (8.5%) | 29,569 (19.8%) |
| $1,000 to $1,499 | 48,176 (17.6%) | 35,775 (24.0%) |
| $1,500 to $1,999 | 28,267 (10.3%) | 7,081 (4.8%) |
| $2,000 to $2,499 | 12,520 (4.6%) | 1,550 (1.0%) |
| $2,500 to $2,999 | 5,837 (2.1%) | 468 (0.3%) |
| $3,000 or more | 5,927 (2.2%) | 670 (0.4%) |
| Total | 273,033 (100.0%) | 149,227 (100.0%) |
Physical Housing Characteristics in Area Code 318
Housing Structures in Area Code 318
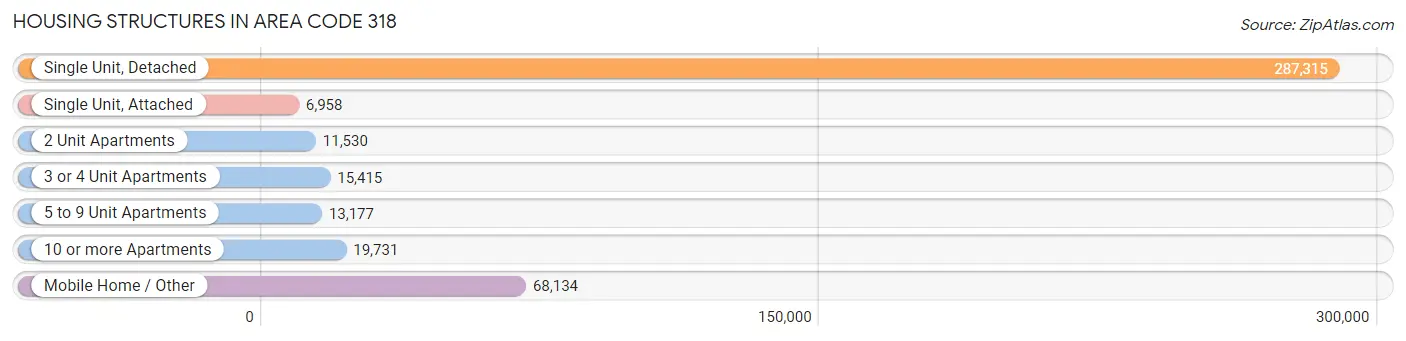
| Structure Type | # Housing Units | % Housing Units |
| Single Unit, Detached | 287,315 | 68.0% |
| Single Unit, Attached | 6,958 | 1.7% |
| 2 Unit Apartments | 11,530 | 2.7% |
| 3 or 4 Unit Apartments | 15,415 | 3.6% |
| 5 to 9 Unit Apartments | 13,177 | 3.1% |
| 10 or more Apartments | 19,731 | 4.7% |
| Mobile Home / Other | 68,134 | 16.1% |
| Total | 422,260 | 100.0% |
Housing Structures by Occupancy in Area Code 318
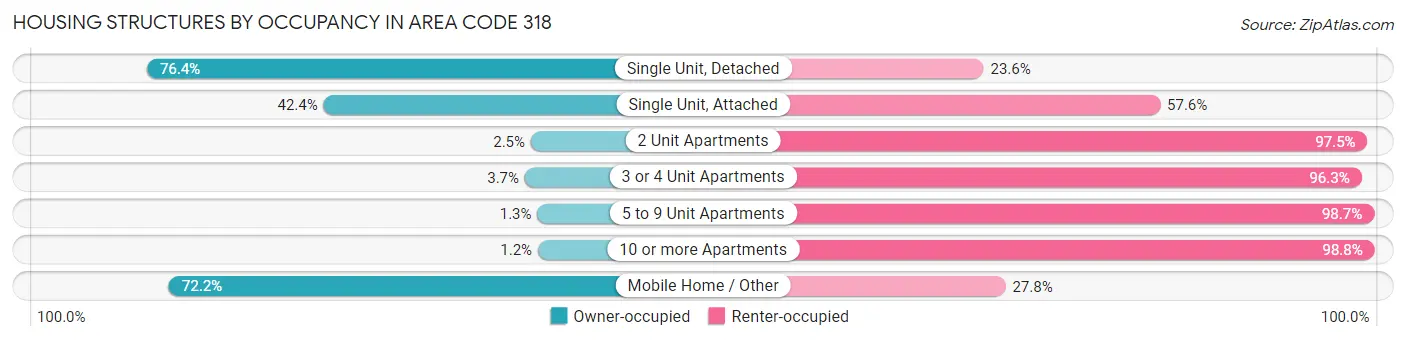
| Structure Type | Owner-occupied | Renter-occupied |
| Single Unit, Detached | 219,623 (76.4%) | 67,692 (23.6%) |
| Single Unit, Attached | 2,953 (42.4%) | 4,005 (57.6%) |
| 2 Unit Apartments | 292 (2.5%) | 11,238 (97.5%) |
| 3 or 4 Unit Apartments | 568 (3.7%) | 14,847 (96.3%) |
| 5 to 9 Unit Apartments | 168 (1.3%) | 13,009 (98.7%) |
| 10 or more Apartments | 229 (1.2%) | 19,502 (98.8%) |
| Mobile Home / Other | 49,200 (72.2%) | 18,934 (27.8%) |
| Total | 273,033 (64.7%) | 149,227 (35.3%) |
Housing Structures by Number of Rooms in Area Code 318
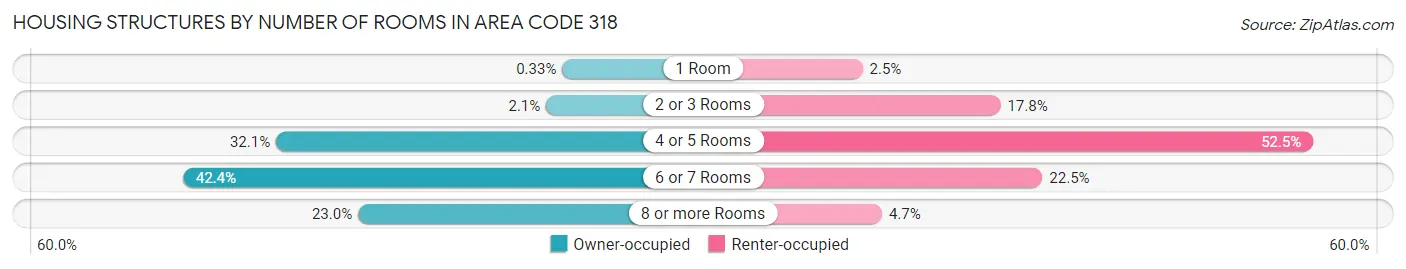
| Number of Rooms | Owner-occupied | Renter-occupied |
| 1 Room | 908 (0.3%) | 3,759 (2.5%) |
| 2 or 3 Rooms | 5,784 (2.1%) | 26,594 (17.8%) |
| 4 or 5 Rooms | 87,651 (32.1%) | 78,371 (52.5%) |
| 6 or 7 Rooms | 115,882 (42.4%) | 33,536 (22.5%) |
| 8 or more Rooms | 62,808 (23.0%) | 6,967 (4.7%) |
| Total | 273,033 (100.0%) | 149,227 (100.0%) |
Housing Structure by Heating Type in Area Code 318
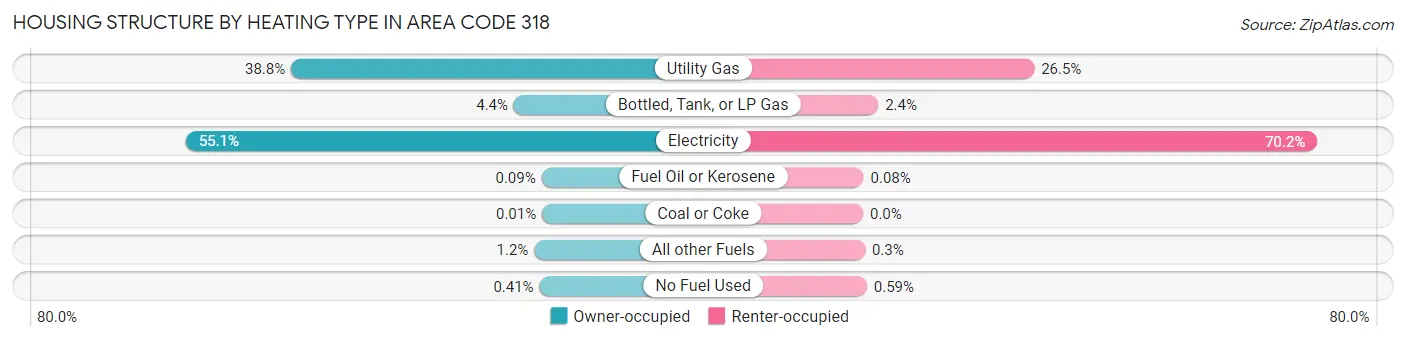
| Heating Type | Owner-occupied | Renter-occupied |
| Utility Gas | 105,970 (38.8%) | 39,481 (26.5%) |
| Bottled, Tank, or LP Gas | 11,904 (4.4%) | 3,512 (2.4%) |
| Electricity | 150,405 (55.1%) | 104,774 (70.2%) |
| Fuel Oil or Kerosene | 258 (0.1%) | 126 (0.1%) |
| Coal or Coke | 24 (0.0%) | 1 (0.0%) |
| All other Fuels | 3,339 (1.2%) | 446 (0.3%) |
| No Fuel Used | 1,133 (0.4%) | 887 (0.6%) |
| Total | 273,033 (100.0%) | 149,227 (100.0%) |
Household Vehicle Usage in Area Code 318

| Vehicles per Household | Owner-occupied | Renter-occupied |
| No Vehicle | 10,360 (3.8%) | 27,175 (18.2%) |
| 1 Vehicle | 80,823 (29.6%) | 77,529 (51.9%) |
| 2 Vehicles | 113,928 (41.7%) | 34,655 (23.2%) |
| 3 or more Vehicles | 67,922 (24.9%) | 9,868 (6.6%) |
| Total | 273,033 (100.0%) | 149,227 (100.0%) |
Real Estate & Mortgages in Area Code 318
Real Estate and Mortgage Overview in Area Code 318
| Characteristic | Without Mortgage | With Mortgage |
| Housing Units | 142,140 | 130,893 |
| Median Property Value | $17,425,400 | $24,629,900 |
| Median Household Income | $7,927,838 | $26,280 |
| Monthly Housing Costs | $64,857 | $5,410 |
| Real Estate Taxes | $63,413 | $25,374 |
Property Value by Mortgage Status in Area Code 318
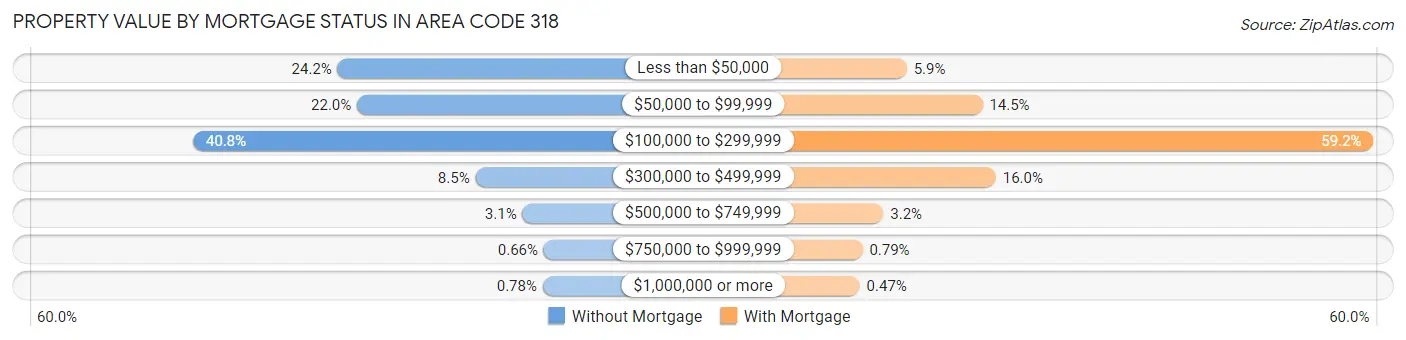
| Property Value | Without Mortgage | With Mortgage |
| Less than $50,000 | 34,425 (24.2%) | 7,653 (5.9%) |
| $50,000 to $99,999 | 31,265 (22.0%) | 18,979 (14.5%) |
| $100,000 to $299,999 | 57,957 (40.8%) | 77,465 (59.2%) |
| $300,000 to $499,999 | 12,038 (8.5%) | 20,986 (16.0%) |
| $500,000 to $749,999 | 4,409 (3.1%) | 4,159 (3.2%) |
| $750,000 to $999,999 | 937 (0.7%) | 1,039 (0.8%) |
| $1,000,000 or more | 1,109 (0.8%) | 612 (0.5%) |
| Total | 142,140 (100.0%) | 130,893 (100.0%) |
Household Income by Mortgage Status in Area Code 318
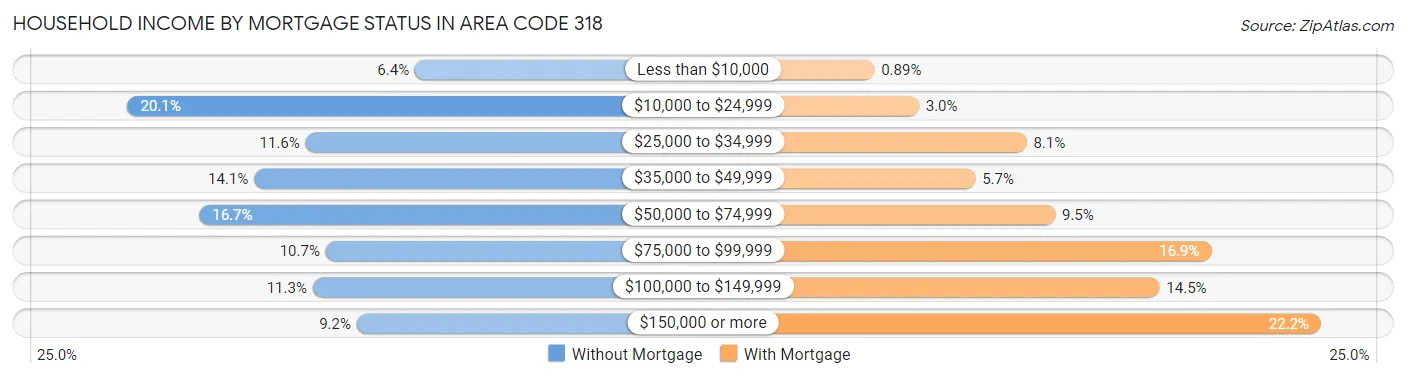
| Household Income | Without Mortgage | With Mortgage |
| Less than $10,000 | 9,115 (6.4%) | 1,164 (0.9%) |
| $10,000 to $24,999 | 28,568 (20.1%) | 3,942 (3.0%) |
| $25,000 to $34,999 | 16,521 (11.6%) | 10,661 (8.1%) |
| $35,000 to $49,999 | 19,996 (14.1%) | 7,458 (5.7%) |
| $50,000 to $74,999 | 23,702 (16.7%) | 12,440 (9.5%) |
| $75,000 to $99,999 | 15,146 (10.7%) | 22,177 (16.9%) |
| $100,000 to $149,999 | 16,039 (11.3%) | 18,935 (14.5%) |
| $150,000 or more | 13,053 (9.2%) | 29,000 (22.2%) |
| Total | 142,140 (100.0%) | 130,893 (100.0%) |
Property Value to Household Income Ratio in Area Code 318
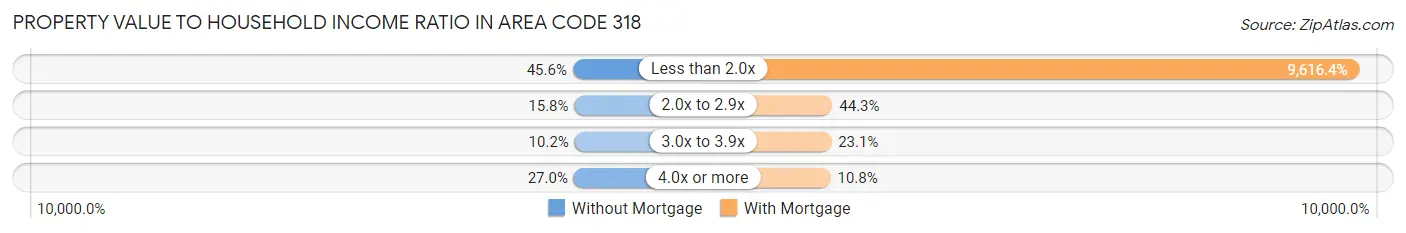
| Value-to-Income Ratio | Without Mortgage | With Mortgage |
| Less than 2.0x | 64,740 (45.6%) | 12,587,178 (9,616.4%) |
| 2.0x to 2.9x | 22,390 (15.8%) | 57,949 (44.3%) |
| 3.0x to 3.9x | 14,536 (10.2%) | 30,192 (23.1%) |
| 4.0x or more | 38,323 (27.0%) | 14,156 (10.8%) |
| Total | 142,140 (100.0%) | 130,893 (100.0%) |
Real Estate Taxes by Mortgage Status in Area Code 318
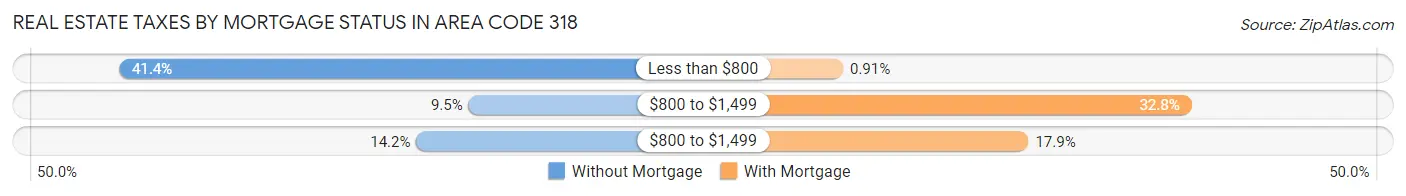
| Property Taxes | Without Mortgage | With Mortgage |
| Less than $800 | 58,818 (41.4%) | 1,195 (0.9%) |
| $800 to $1,499 | 13,445 (9.5%) | 42,872 (32.8%) |
| $800 to $1,499 | 20,225 (14.2%) | 23,363 (17.8%) |
| Total | 142,140 (100.0%) | 130,893 (100.0%) |
Health & Disability in Area Code 318
Health Insurance Coverage by Age in Area Code 318
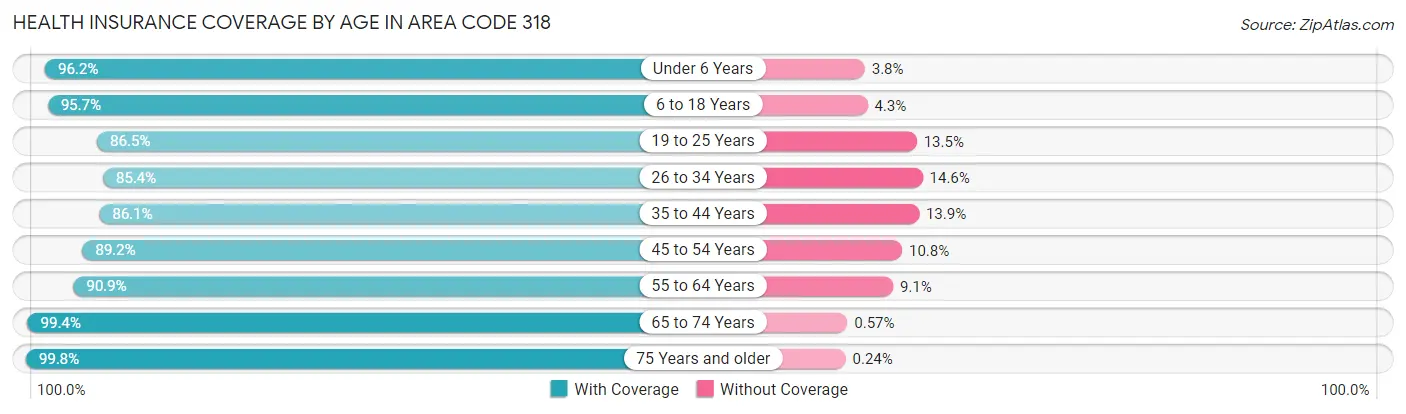
| Age Bracket | With Coverage | Without Coverage |
| Under 6 Years | 79,460 (96.2%) | 3,154 (3.8%) |
| 6 to 18 Years | 186,178 (95.7%) | 8,406 (4.3%) |
| 19 to 25 Years | 88,298 (86.5%) | 13,794 (13.5%) |
| 26 to 34 Years | 103,726 (85.4%) | 17,738 (14.6%) |
| 35 to 44 Years | 112,199 (86.1%) | 18,153 (13.9%) |
| 45 to 54 Years | 109,354 (89.2%) | 13,193 (10.8%) |
| 55 to 64 Years | 127,903 (90.9%) | 12,777 (9.1%) |
| 65 to 74 Years | 110,156 (99.4%) | 637 (0.6%) |
| 75 Years and older | 73,348 (99.8%) | 175 (0.2%) |
| Total | 990,622 (91.8%) | 88,027 (8.2%) |
Health Insurance Coverage by Citizenship Status in Area Code 318
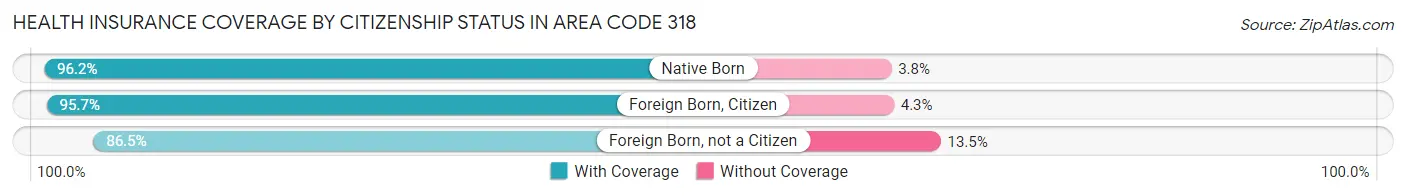
| Citizenship Status | With Coverage | Without Coverage |
| Native Born | 79,460 (96.2%) | 3,154 (3.8%) |
| Foreign Born, Citizen | 186,178 (95.7%) | 8,406 (4.3%) |
| Foreign Born, not a Citizen | 88,298 (86.5%) | 13,794 (13.5%) |
Health Insurance Coverage by Household Income in Area Code 318
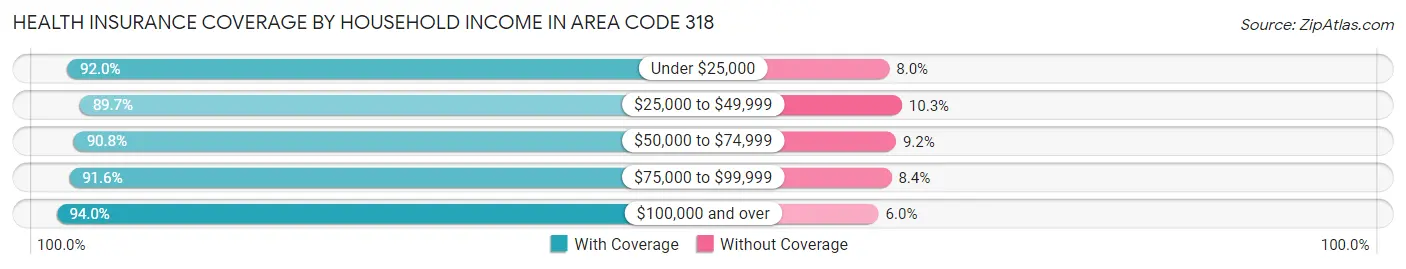
| Household Income | With Coverage | Without Coverage |
| Under $25,000 | 217,437 (92.0%) | 18,845 (8.0%) |
| $25,000 to $49,999 | 211,295 (89.7%) | 24,334 (10.3%) |
| $50,000 to $74,999 | 158,521 (90.8%) | 16,085 (9.2%) |
| $75,000 to $99,999 | 112,741 (91.6%) | 10,296 (8.4%) |
| $100,000 and over | 280,216 (94.0%) | 17,776 (6.0%) |
Public vs Private Health Insurance Coverage by Age in Area Code 318
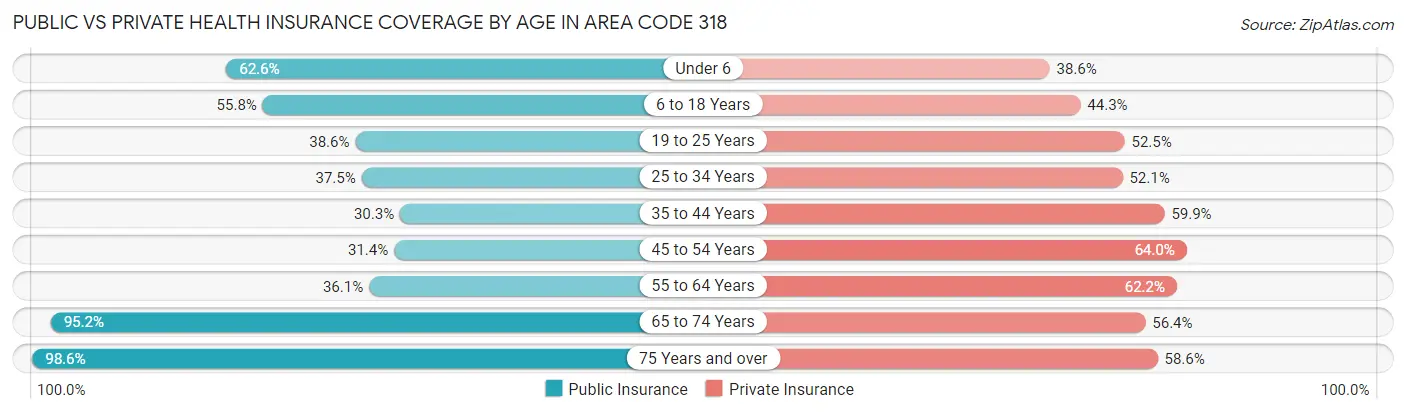
| Age Bracket | Public Insurance | Private Insurance |
| Under 6 | 51,676 (62.5%) | 31,852 (38.6%) |
| 6 to 18 Years | 108,599 (55.8%) | 86,187 (44.3%) |
| 19 to 25 Years | 39,424 (38.6%) | 53,581 (52.5%) |
| 25 to 34 Years | 45,486 (37.4%) | 63,277 (52.1%) |
| 35 to 44 Years | 39,523 (30.3%) | 78,069 (59.9%) |
| 45 to 54 Years | 38,502 (31.4%) | 78,440 (64.0%) |
| 55 to 64 Years | 50,764 (36.1%) | 87,457 (62.2%) |
| 65 to 74 Years | 105,419 (95.2%) | 62,428 (56.4%) |
| 75 Years and over | 72,462 (98.6%) | 43,093 (58.6%) |
| Total | 551,855 (51.2%) | 584,384 (54.2%) |
Disability Status by Sex by Age in Area Code 318
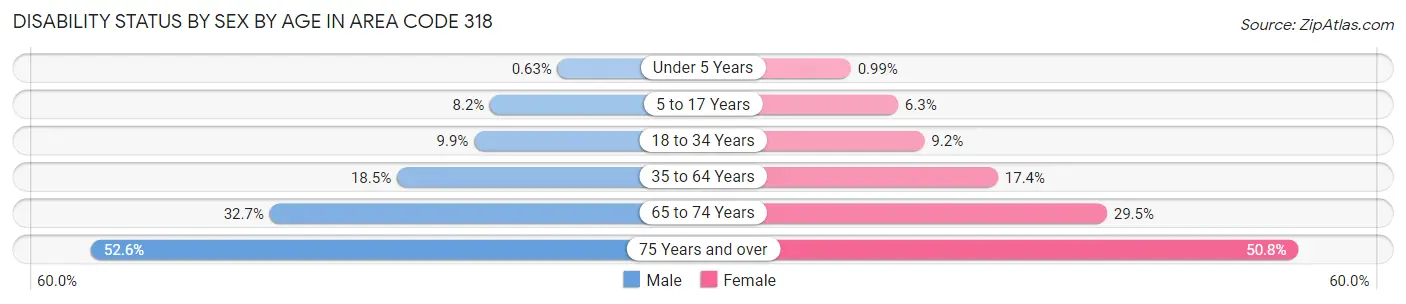
| Age Bracket | Male | Female |
| Under 5 Years | 220 (0.6%) | 339 (1.0%) |
| 5 to 17 Years | 8,118 (8.2%) | 5,844 (6.2%) |
| 18 to 34 Years | 11,493 (9.9%) | 11,316 (9.2%) |
| 35 to 64 Years | 34,487 (18.5%) | 36,055 (17.4%) |
| 65 to 74 Years | 16,640 (32.7%) | 17,676 (29.5%) |
| 75 Years and over | 15,794 (52.6%) | 22,117 (50.8%) |
Disability Class by Sex by Age in Area Code 318
Disability Class: Hearing Difficulty
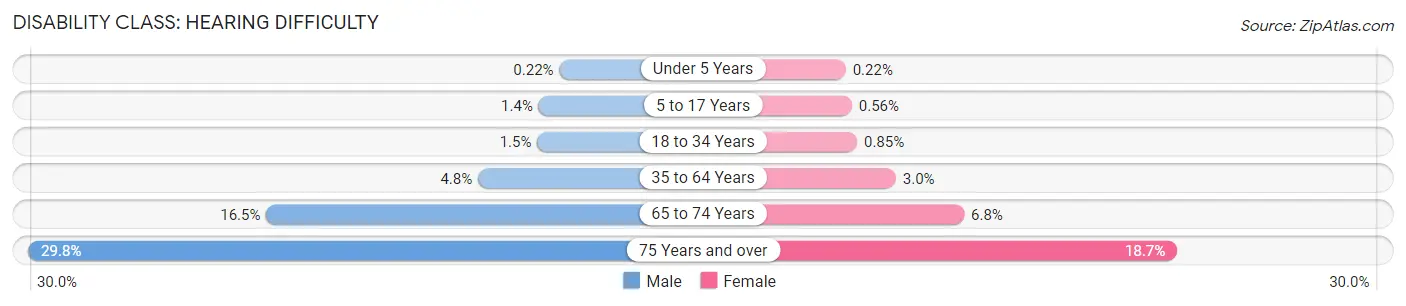
| Age Bracket | Male | Female |
| Under 5 Years | 75 (0.2%) | 77 (0.2%) |
| 5 to 17 Years | 1,364 (1.4%) | 528 (0.6%) |
| 18 to 34 Years | 1,679 (1.5%) | 1,043 (0.9%) |
| 35 to 64 Years | 8,844 (4.8%) | 6,235 (3.0%) |
| 65 to 74 Years | 8,419 (16.5%) | 4,078 (6.8%) |
| 75 Years and over | 8,951 (29.8%) | 8,121 (18.7%) |
Disability Class: Vision Difficulty
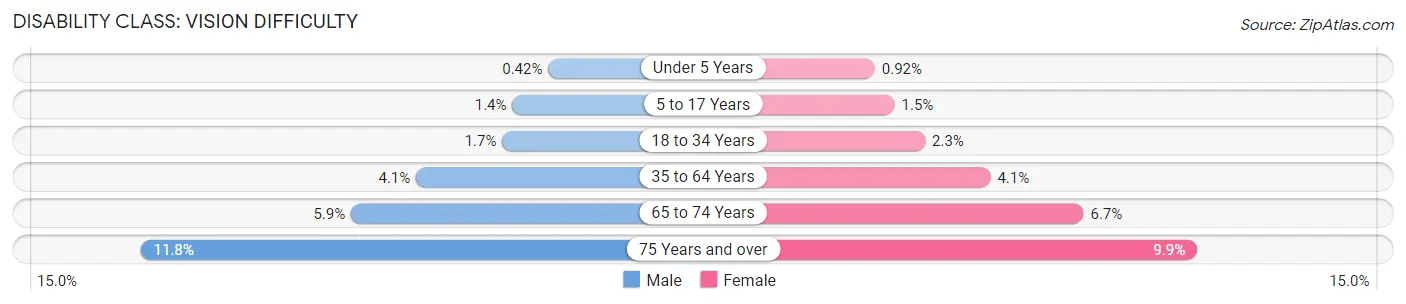
| Age Bracket | Male | Female |
| Under 5 Years | 145 (0.4%) | 317 (0.9%) |
| 5 to 17 Years | 1,411 (1.4%) | 1,378 (1.5%) |
| 18 to 34 Years | 1,973 (1.7%) | 2,850 (2.3%) |
| 35 to 64 Years | 7,628 (4.1%) | 8,577 (4.1%) |
| 65 to 74 Years | 3,007 (5.9%) | 4,033 (6.7%) |
| 75 Years and over | 3,535 (11.8%) | 4,302 (9.9%) |
Disability Class: Cognitive Difficulty
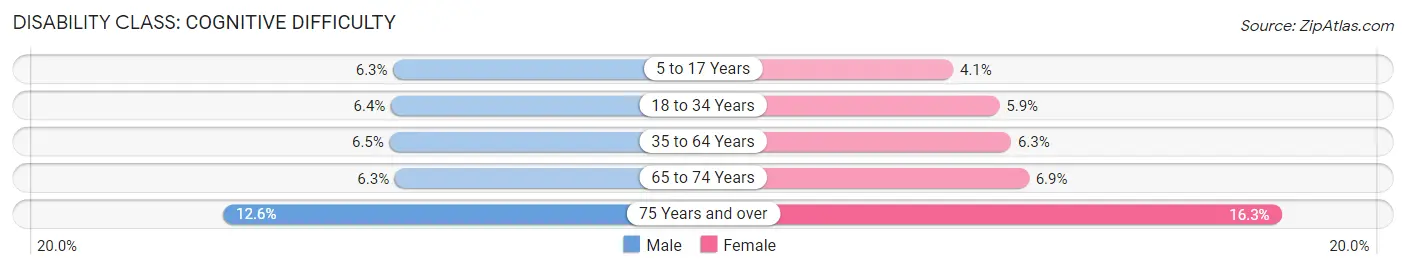
| Age Bracket | Male | Female |
| 5 to 17 Years | 6,286 (6.3%) | 3,865 (4.1%) |
| 18 to 34 Years | 7,393 (6.4%) | 7,191 (5.9%) |
| 35 to 64 Years | 11,998 (6.5%) | 13,030 (6.3%) |
| 65 to 74 Years | 3,179 (6.2%) | 4,157 (6.9%) |
| 75 Years and over | 3,792 (12.6%) | 7,101 (16.3%) |
Disability Class: Ambulatory Difficulty
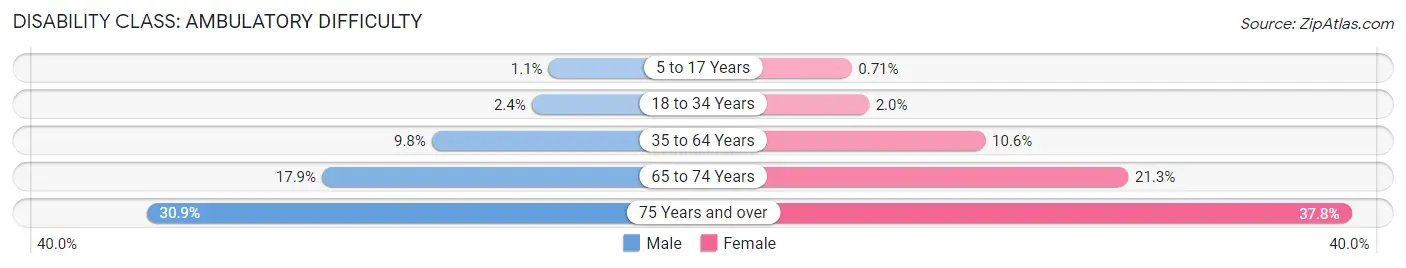
| Age Bracket | Male | Female |
| 5 to 17 Years | 1,108 (1.1%) | 663 (0.7%) |
| 18 to 34 Years | 2,728 (2.4%) | 2,453 (2.0%) |
| 35 to 64 Years | 18,206 (9.8%) | 22,070 (10.6%) |
| 65 to 74 Years | 9,126 (17.9%) | 12,731 (21.2%) |
| 75 Years and over | 9,288 (30.9%) | 16,451 (37.8%) |
Disability Class: Self-Care Difficulty
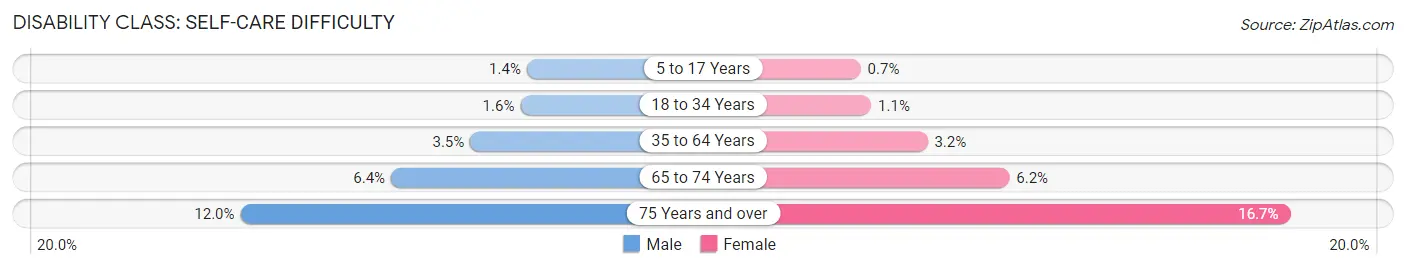
| Age Bracket | Male | Female |
| 5 to 17 Years | 1,352 (1.4%) | 652 (0.7%) |
| 18 to 34 Years | 1,853 (1.6%) | 1,342 (1.1%) |
| 35 to 64 Years | 6,437 (3.5%) | 6,600 (3.2%) |
| 65 to 74 Years | 3,258 (6.4%) | 3,726 (6.2%) |
| 75 Years and over | 3,600 (12.0%) | 7,241 (16.7%) |
Technology Access in Area Code 318
Computing Device Access in Area Code 318
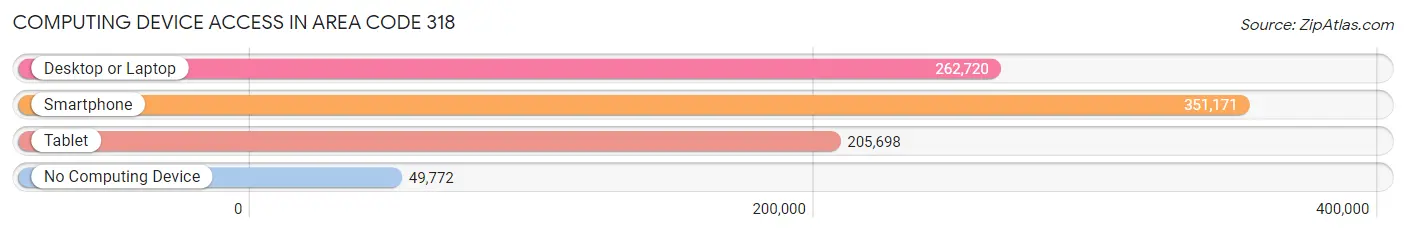
| Device Type | # Households | % Households |
| Desktop or Laptop | 262,720 | 62.2% |
| Smartphone | 351,171 | 83.2% |
| Tablet | 205,698 | 48.7% |
| No Computing Device | 49,772 | 11.8% |
| Total | 422,260 | 100.0% |
Internet Access in Area Code 318
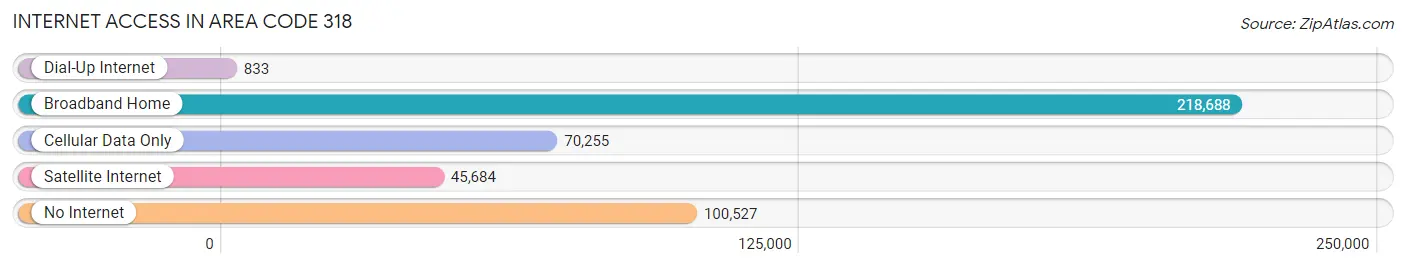
| Internet Type | # Households | % Households |
| Dial-Up Internet | 833 | 0.2% |
| Broadband Home | 218,688 | 51.8% |
| Cellular Data Only | 70,255 | 16.6% |
| Satellite Internet | 45,684 | 10.8% |
| No Internet | 100,527 | 23.8% |
| Total | 422,260 | 100.0% |
Area Code 318 Summary
Geography
Area code 318 is located in the state of Louisiana. It covers the northern and central parts of the state, including the cities of Shreveport, Monroe, Alexandria, and Ruston.
Social
Area code 318 is home to a diverse population of people from all walks of life. The area is known for its vibrant music and art scene, as well as its rich cultural heritage.
Economics
Area code 318 is an important economic hub for the state of Louisiana. It is home to a number of major industries, including oil and gas, manufacturing, and healthcare. The area also has a strong tourism industry, with many attractions and activities for visitors to enjoy.
Demographics
Area code 318 is home to a population of over 1.5 million people. The population is largely African American, with a significant Hispanic population as well. The median household income in the area is around $45,000, and the unemployment rate is slightly higher than the national average.
Common Questions
What is Per Capita Income in Area Code 318?
Per Capita income in Area Code 318 is $26,051.
What is the Median Family Income in Area Code 318?
Median Family Income in Area Code 318 is $62,180.
What is the Median Household income in Area Code 318?
Median Household Income in Area Code 318 is $46,489.
What is Income or Wage Gap in Area Code 318?
Income or Wage Gap in Area Code 318 is 33.2%.
Women in Area Code 318 earn 66.8 cents for every dollar earned by a man.
What is Family Income Deficit in Area Code 318?
Family Income Deficit in Area Code 318 is $11,066.
Families that are below poverty line in Area Code 318 earn $11,066 less on average than the poverty threshold level.
What is Inequality or Gini Index in Area Code 318?
Inequality or Gini Index in Area Code 318 is 88.59.
What is the Total Population of Area Code 318?
Total Population of Area Code 318 is 1,122,258.
What is the Total Male Population of Area Code 318?
Total Male Population of Area Code 318 is 552,392.
What is the Total Female Population of Area Code 318?
Total Female Population of Area Code 318 is 569,866.
What is the Ratio of Males per 100 Females in Area Code 318?
There are 96.93 Males per 100 Females in Area Code 318.
What is the Ratio of Females per 100 Males in Area Code 318?
There are 103.16 Females per 100 Males in Area Code 318.
What is the Median Population Age in Area Code 318?
Median Population Age in Area Code 318 is 40.9 Years.
What is the Average Family Size in Area Code 318
Average Family Size in Area Code 318 is 3.2 People.
What is the Average Household Size in Area Code 318
Average Household Size in Area Code 318 is 2.5 People.
How Large is the Labor Force in Area Code 318?
There are 457,258 People in the Labor Forcein in Area Code 318.
What is the Percentage of People in the Labor Force in Area Code 318?
51.3% of People are in the Labor Force in Area Code 318.
What is the Unemployment Rate in Area Code 318?
Unemployment Rate in Area Code 318 is 8.4%.