Area Code 478 Map & Demographics
Area Code 478 Map
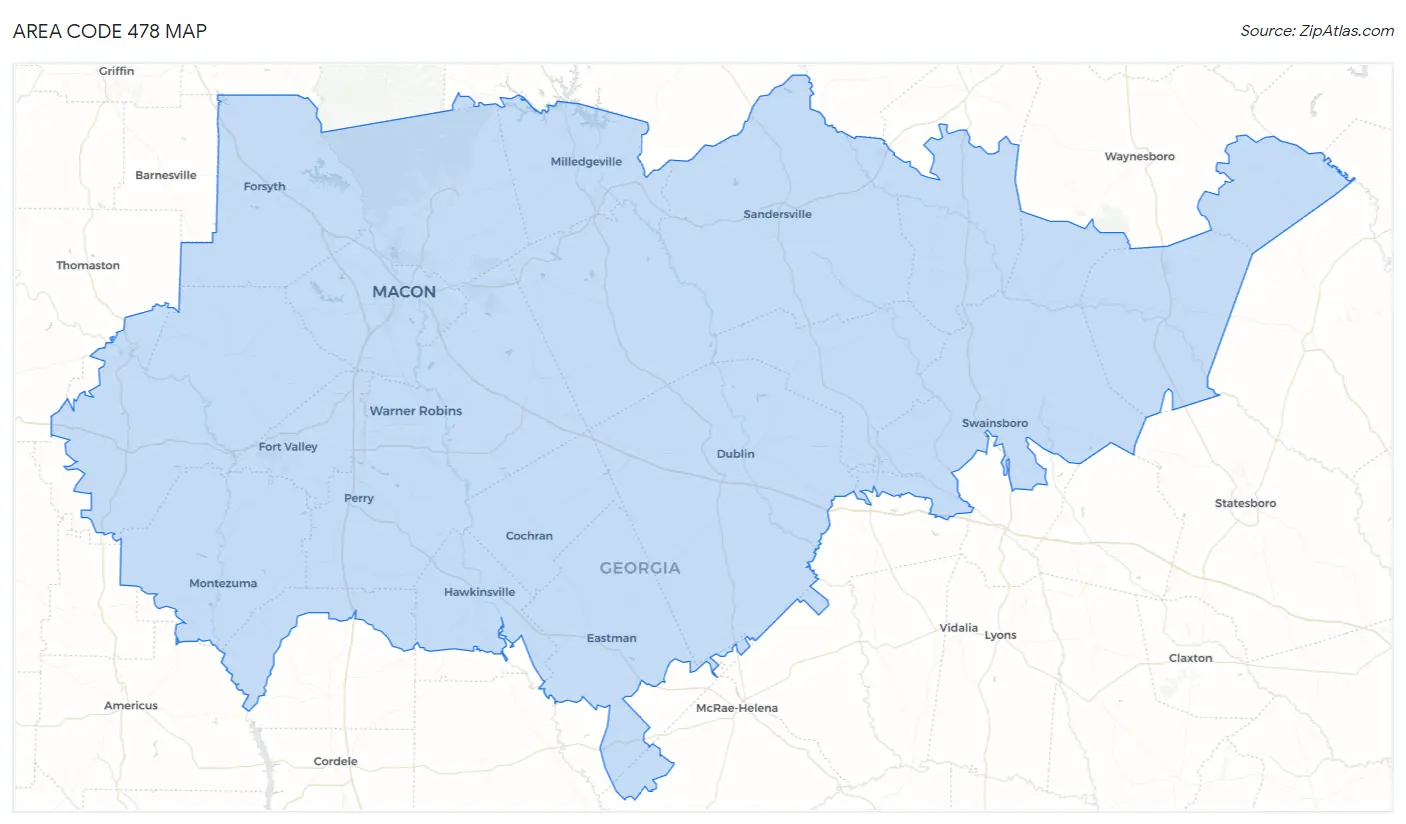
Area Code 478 Overview
$27,651
PER CAPITA INCOME
$68,858
AVG FAMILY INCOME
$54,665
AVG HOUSEHOLD INCOME
25.7%
WAGE / INCOME GAP [ % ]
74.3¢/ $1
WAGE / INCOME GAP [ $ ]
$10,977
FAMILY INCOME DEFICIT
35.61
INEQUALITY / GINI INDEX
684,380
TOTAL POPULATION
337,164
MALE POPULATION
347,216
FEMALE POPULATION
97.10
MALES / 100 FEMALES
102.98
FEMALES / 100 MALES
42.3
MEDIAN AGE
3.4
AVG FAMILY SIZE
2.6
AVG HOUSEHOLD SIZE
276,484
LABOR FORCE [ PEOPLE ]
50.6%
PERCENT IN LABOR FORCE
6.5%
UNEMPLOYMENT RATE
Income in Area Code 478
Income Overview in Area Code 478
Per Capita Income in Area Code 478 is $27,651, while median incomes of families and households are $68,858 and $54,665 respectively.
| Characteristic | Number | Measure |
| Per Capita Income | 684,380 | $27,651 |
| Median Family Income | 165,283 | $68,858 |
| Mean Family Income | 165,283 | $6,653,333 |
| Median Household Income | 251,645 | $54,665 |
| Mean Household Income | 251,645 | $5,757,919 |
| Income Deficit | 165,283 | $10,977 |
| Wage / Income Gap (%) | 684,380 | 25.74% |
| Wage / Income Gap ($) | 684,380 | 74.26¢ per $1 |
| Gini / Inequality Index | 684,380 | 35.61 |
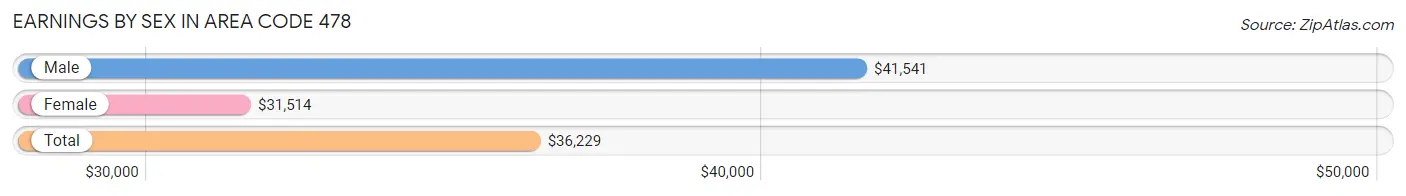
Earnings by Sex in Area Code 478
Average Earnings in Area Code 478 are $36,229, $41,541 for men and $31,514 for women, a difference of 24.1%.
| Sex | Number | Average Earnings |
| Male | 164,352 (51.6%) | $41,541 |
| Female | 153,977 (48.4%) | $31,514 |
| Total | 318,329 (100.0%) | $36,229 |
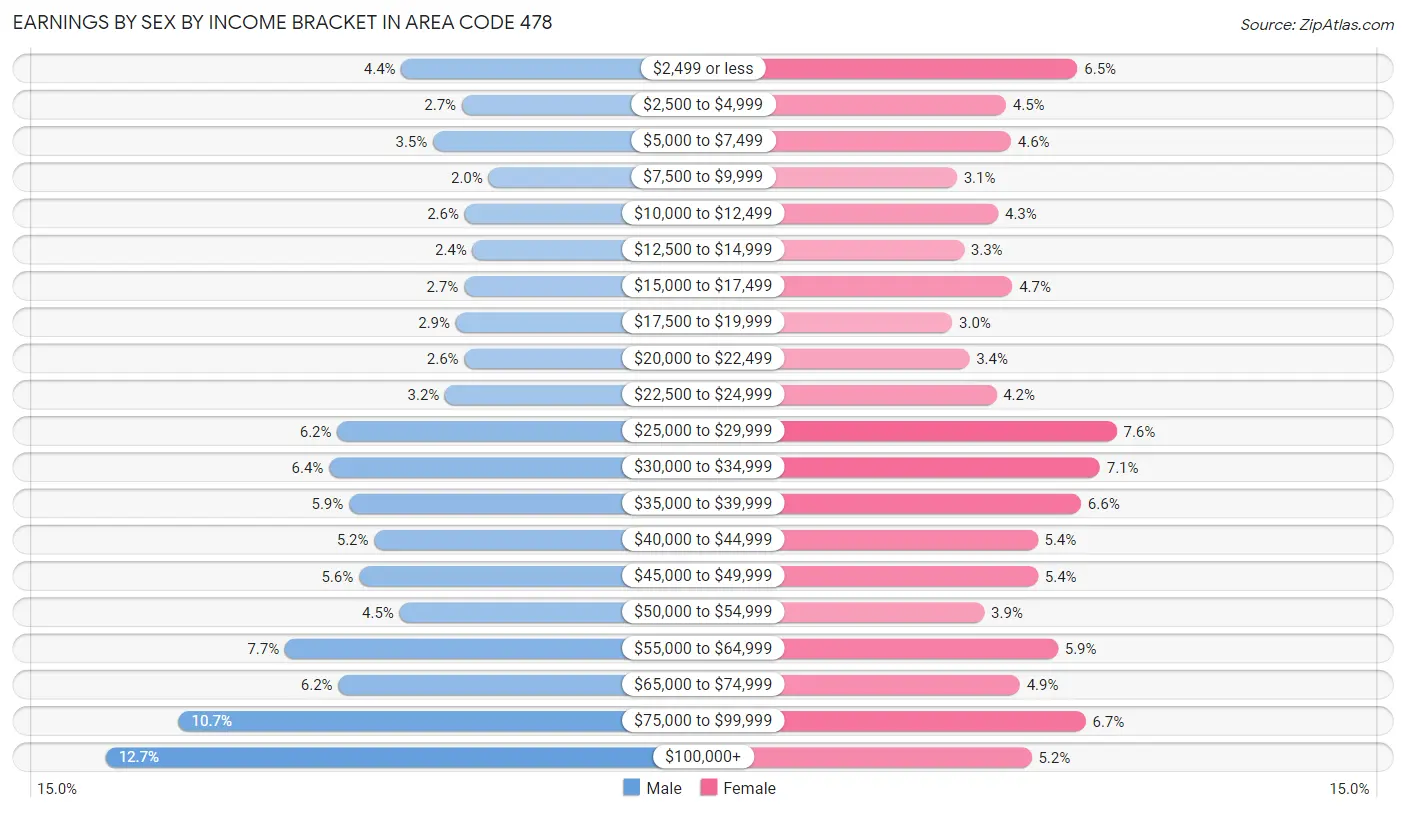
Earnings by Sex by Income Bracket in Area Code 478
The most common earnings brackets in Area Code 478 are $100,000+ for men (20,902 | 12.7%) and $25,000 to $29,999 for women (11,668 | 7.6%).
| Income | Male | Female |
| $2,499 or less | 7,254 (4.4%) | 9,977 (6.5%) |
| $2,500 to $4,999 | 4,450 (2.7%) | 6,888 (4.5%) |
| $5,000 to $7,499 | 5,783 (3.5%) | 7,101 (4.6%) |
| $7,500 to $9,999 | 3,224 (2.0%) | 4,765 (3.1%) |
| $10,000 to $12,499 | 4,323 (2.6%) | 6,550 (4.3%) |
| $12,500 to $14,999 | 3,966 (2.4%) | 5,064 (3.3%) |
| $15,000 to $17,499 | 4,349 (2.6%) | 7,158 (4.6%) |
| $17,500 to $19,999 | 4,741 (2.9%) | 4,565 (3.0%) |
| $20,000 to $22,499 | 4,335 (2.6%) | 5,297 (3.4%) |
| $22,500 to $24,999 | 5,225 (3.2%) | 6,460 (4.2%) |
| $25,000 to $29,999 | 10,206 (6.2%) | 11,668 (7.6%) |
| $30,000 to $34,999 | 10,582 (6.4%) | 10,952 (7.1%) |
| $35,000 to $39,999 | 9,665 (5.9%) | 10,128 (6.6%) |
| $40,000 to $44,999 | 8,501 (5.2%) | 8,248 (5.4%) |
| $45,000 to $49,999 | 9,208 (5.6%) | 8,269 (5.4%) |
| $50,000 to $54,999 | 7,337 (4.5%) | 5,942 (3.9%) |
| $55,000 to $64,999 | 12,618 (7.7%) | 9,125 (5.9%) |
| $65,000 to $74,999 | 10,151 (6.2%) | 7,490 (4.9%) |
| $75,000 to $99,999 | 17,532 (10.7%) | 10,335 (6.7%) |
| $100,000+ | 20,902 (12.7%) | 7,995 (5.2%) |
| Total | 164,352 (100.0%) | 153,977 (100.0%) |
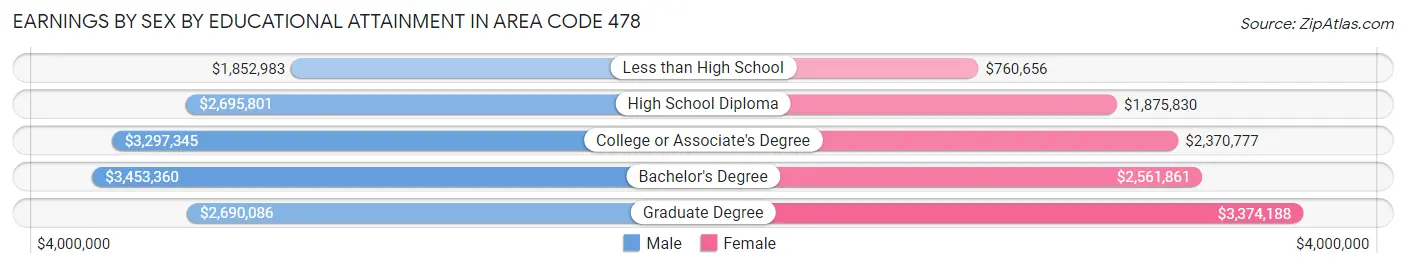
Earnings by Sex by Educational Attainment in Area Code 478
Average earnings in Area Code 478 are $3,407,697 for men and $2,572,244 for women, a difference of 24.5%. Men with an educational attainment of bachelor's degree enjoy the highest average annual earnings of $3,453,360, while those with less than high school education earn the least with $1,852,983. Women with an educational attainment of graduate degree earn the most with the average annual earnings of $3,374,188, while those with less than high school education have the smallest earnings of $760,656.
| Educational Attainment | Male Income | Female Income |
| Less than High School | $1,852,983 | $760,656 |
| High School Diploma | $2,695,801 | $1,875,830 |
| College or Associate's Degree | $3,297,345 | $2,370,777 |
| Bachelor's Degree | $3,453,360 | $2,561,861 |
| Graduate Degree | $2,690,086 | $3,374,188 |
| Total | $3,407,697 | $2,572,244 |
Family Income in Area Code 478
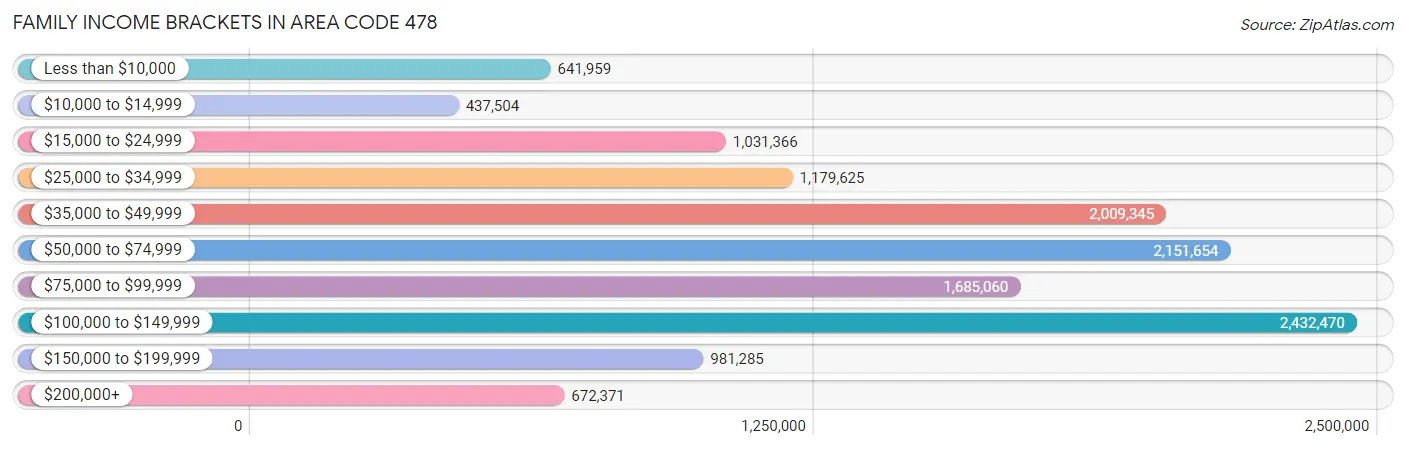
Family Income Brackets in Area Code 478
According to the Area Code 478 family income data, there are 2,432,470 families falling into the $100,000 to $149,999 income range, which is the most common income bracket and makes up 1,471.7% of all families. Conversely, the $10,000 to $14,999 income bracket is the least frequent group with only 437,504 families (264.7%) belonging to this category.
| Income Bracket | # Families | % Families |
| Less than $10,000 | 641,959 | 388.4% |
| $10,000 to $14,999 | 437,504 | 264.7% |
| $15,000 to $24,999 | 1,031,366 | 624.0% |
| $25,000 to $34,999 | 1,179,625 | 713.7% |
| $35,000 to $49,999 | 2,009,345 | 1,215.7% |
| $50,000 to $74,999 | 2,151,654 | 1,301.8% |
| $75,000 to $99,999 | 1,685,060 | 1,019.5% |
| $100,000 to $149,999 | 2,432,470 | 1,471.7% |
| $150,000 to $199,999 | 981,285 | 593.7% |
| $200,000+ | 672,371 | 406.8% |
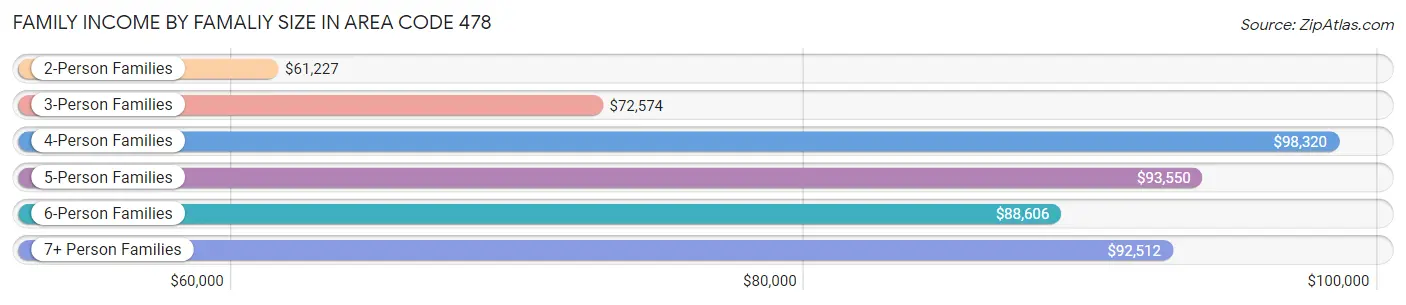
Family Income by Famaliy Size in Area Code 478
4-person families (26,047 | 15.8%) account for the highest median family income in Area Code 478 with $98,320 per family, while 2-person families (80,145 | 48.5%) have the highest median income of $30,613 per family member.
| Income Bracket | # Families | Median Income |
| 2-Person Families | 80,145 (48.5%) | $61,227 |
| 3-Person Families | 38,684 (23.4%) | $72,574 |
| 4-Person Families | 26,047 (15.8%) | $98,320 |
| 5-Person Families | 13,650 (8.3%) | $93,550 |
| 6-Person Families | 3,956 (2.4%) | $88,606 |
| 7+ Person Families | 2,801 (1.7%) | $92,512 |
| Total | 165,283 (100.0%) | $68,858 |
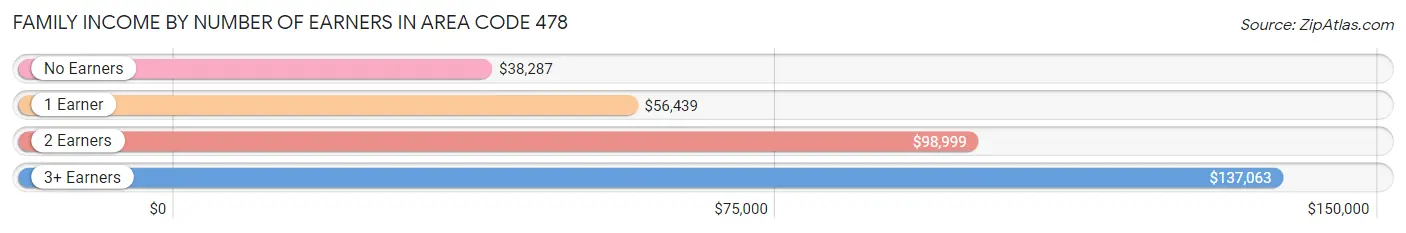
Family Income by Number of Earners in Area Code 478
The median family income in Area Code 478 is $68,858, with families comprising 3+ earners (13,761) having the highest median family income of $137,063, while families with no earners (31,089) have the lowest median family income of $38,287, accounting for 8.3% and 18.8% of families, respectively.
| Number of Earners | # Families | Median Income |
| No Earners | 31,089 (18.8%) | $38,287 |
| 1 Earner | 59,689 (36.1%) | $56,439 |
| 2 Earners | 60,744 (36.7%) | $98,999 |
| 3+ Earners | 13,761 (8.3%) | $137,063 |
| Total | 165,283 (100.0%) | $68,858 |
Household Income in Area Code 478
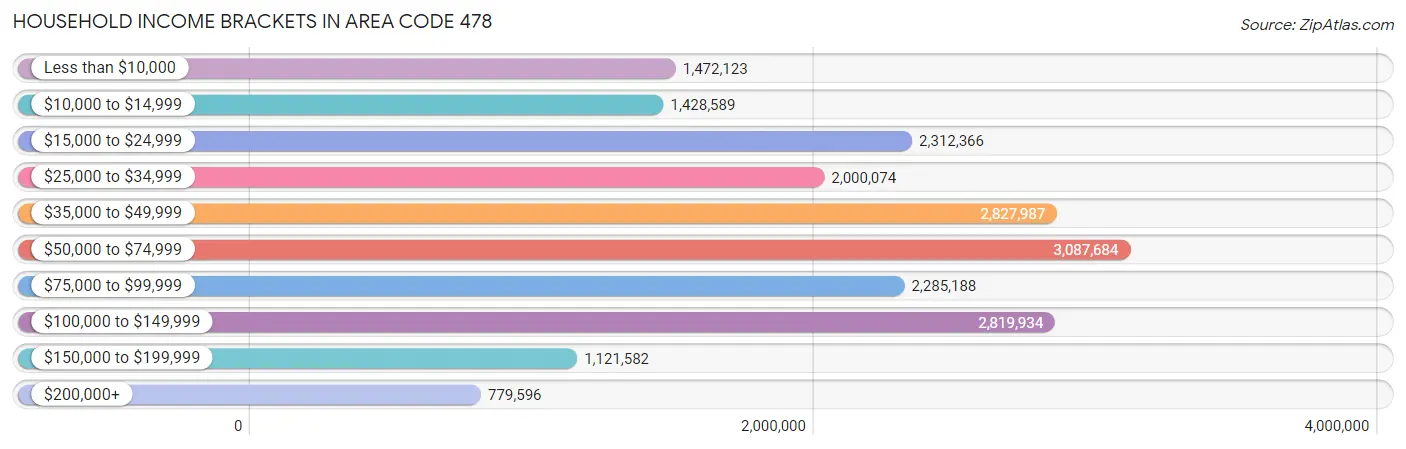
Household Income Brackets in Area Code 478
With 3,087,684 households falling in the category, the $50,000 to $74,999 income range is the most frequent in Area Code 478, accounting for 1,227.0% of all households. In contrast, only 779,596 households (309.8%) fall into the $200,000+ income bracket, making it the least populous group.
| Income Bracket | # Households | % Households |
| Less than $10,000 | 1,472,123 | 585.0% |
| $10,000 to $14,999 | 1,428,589 | 567.7% |
| $15,000 to $24,999 | 2,312,366 | 918.9% |
| $25,000 to $34,999 | 2,000,074 | 794.8% |
| $35,000 to $49,999 | 2,827,987 | 1,123.8% |
| $50,000 to $74,999 | 3,087,684 | 1,227.0% |
| $75,000 to $99,999 | 2,285,188 | 908.1% |
| $100,000 to $149,999 | 2,819,934 | 1,120.6% |
| $150,000 to $199,999 | 1,121,582 | 445.7% |
| $200,000+ | 779,596 | 309.8% |
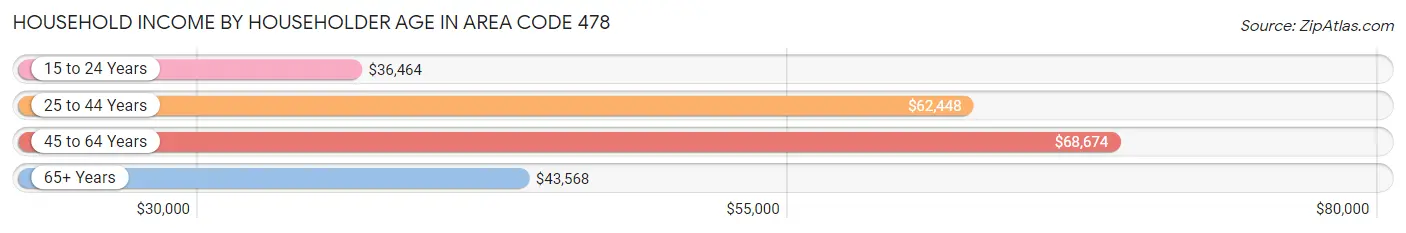
Household Income by Householder Age in Area Code 478
The median household income in Area Code 478 is $54,665, with the highest median household income of $68,674 found in the 45 to 64 years age bracket for the primary householder. A total of 93,972 households (37.3%) fall into this category. Meanwhile, the 15 to 24 years age bracket for the primary householder has the lowest median household income of $36,464, with 9,328 households (3.7%) in this group.
| Income Bracket | # Households | Median Income |
| 15 to 24 Years | 9,328 (3.7%) | $36,464 |
| 25 to 44 Years | 77,728 (30.9%) | $62,448 |
| 45 to 64 Years | 93,972 (37.3%) | $68,674 |
| 65+ Years | 70,617 (28.1%) | $43,568 |
| Total | 251,645 (100.0%) | $54,665 |
Poverty in Area Code 478
Income Below Poverty by Sex and Age in Area Code 478
With 17.0% poverty level for males and 20.4% for females among the residents of Area Code 478, under 5 year old males and 6 to 11 year old females are the most vulnerable to poverty, with 5,907 males (30.0%) and 6,869 females (28.1%) in their respective age groups living below the poverty level.
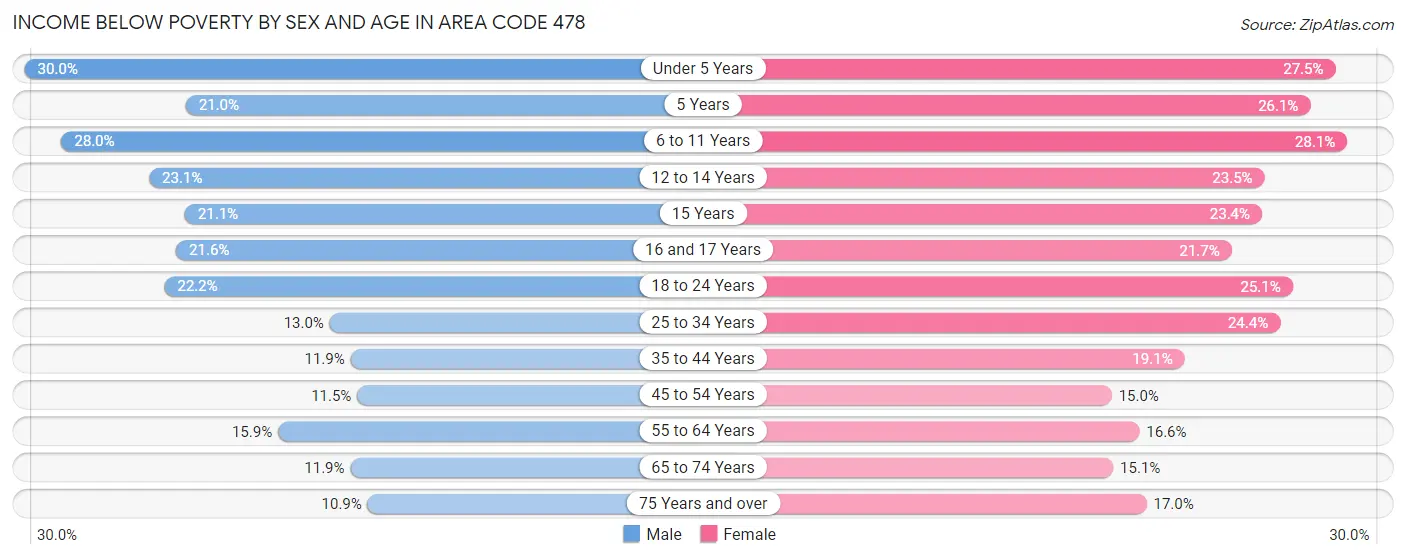
| Age Bracket | Male | Female |
| Under 5 Years | 5,907 (30.0%) | 5,194 (27.5%) |
| 5 Years | 737 (21.0%) | 906 (26.1%) |
| 6 to 11 Years | 7,453 (28.0%) | 6,869 (28.1%) |
| 12 to 14 Years | 3,401 (23.1%) | 3,446 (23.5%) |
| 15 Years | 945 (21.1%) | 1,005 (23.4%) |
| 16 and 17 Years | 1,979 (21.6%) | 1,876 (21.7%) |
| 18 to 24 Years | 6,716 (22.2%) | 6,997 (25.1%) |
| 25 to 34 Years | 5,341 (13.0%) | 10,649 (24.4%) |
| 35 to 44 Years | 4,548 (11.8%) | 7,939 (19.1%) |
| 45 to 54 Years | 4,367 (11.5%) | 6,219 (15.0%) |
| 55 to 64 Years | 6,728 (15.9%) | 7,576 (16.6%) |
| 65 to 74 Years | 3,690 (11.9%) | 5,443 (15.1%) |
| 75 Years and over | 1,788 (10.9%) | 4,373 (17.0%) |
| Total | 53,600 (17.0%) | 68,492 (20.4%) |
Income Above Poverty by Sex and Age in Area Code 478
According to the poverty statistics in Area Code 478, males aged 75 years and over and females aged 45 to 54 years are the age groups that are most secure financially, with 89.1% of males and 85.0% of females in these age groups living above the poverty line.
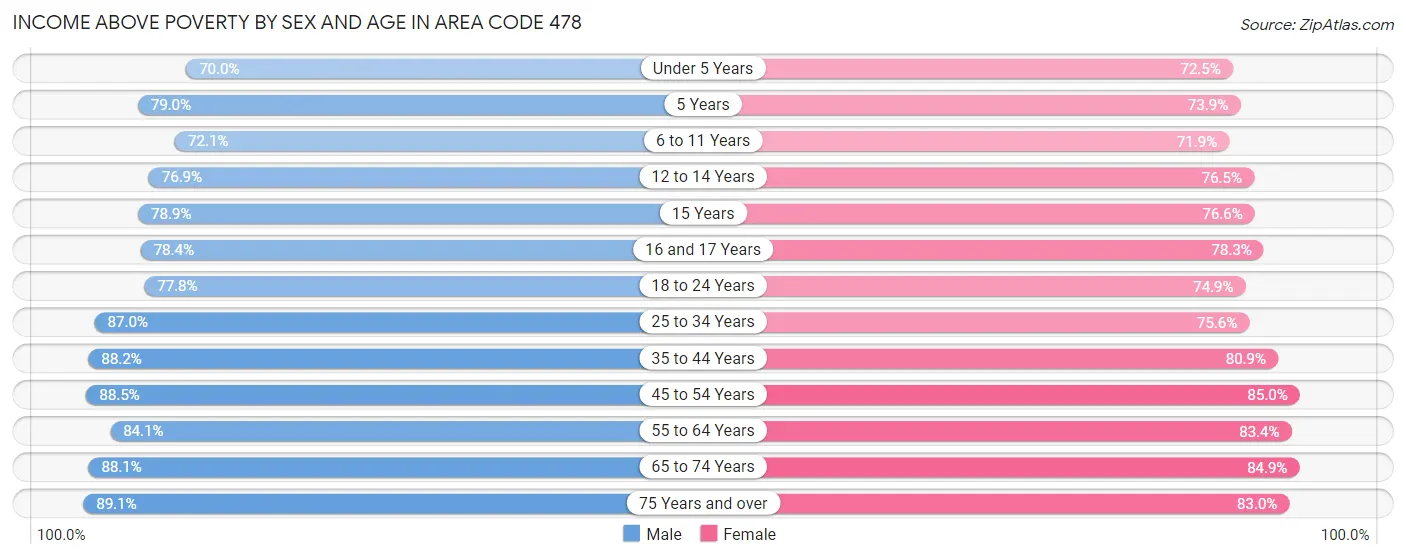
| Age Bracket | Male | Female |
| Under 5 Years | 13,780 (70.0%) | 13,706 (72.5%) |
| 5 Years | 2,770 (79.0%) | 2,568 (73.9%) |
| 6 to 11 Years | 19,212 (72.1%) | 17,540 (71.9%) |
| 12 to 14 Years | 11,339 (76.9%) | 11,197 (76.5%) |
| 15 Years | 3,541 (78.9%) | 3,291 (76.6%) |
| 16 and 17 Years | 7,198 (78.4%) | 6,768 (78.3%) |
| 18 to 24 Years | 23,508 (77.8%) | 20,879 (74.9%) |
| 25 to 34 Years | 35,719 (87.0%) | 33,002 (75.6%) |
| 35 to 44 Years | 33,831 (88.1%) | 33,663 (80.9%) |
| 45 to 54 Years | 33,689 (88.5%) | 35,171 (85.0%) |
| 55 to 64 Years | 35,623 (84.1%) | 38,139 (83.4%) |
| 65 to 74 Years | 27,424 (88.1%) | 30,579 (84.9%) |
| 75 Years and over | 14,612 (89.1%) | 21,399 (83.0%) |
| Total | 262,246 (83.0%) | 267,902 (79.6%) |
Income Below Poverty Among Married-Couple Families in Area Code 478
The poverty statistics for married-couple families in Area Code 478 show that 6.3% or 6,937 of the total 110,110 families live below the poverty line. Families with 5 or more children have the highest poverty rate of 24.0%, comprising of 344 families. On the other hand, families with no children have the lowest poverty rate of 5.5%, which includes 3,749 families.
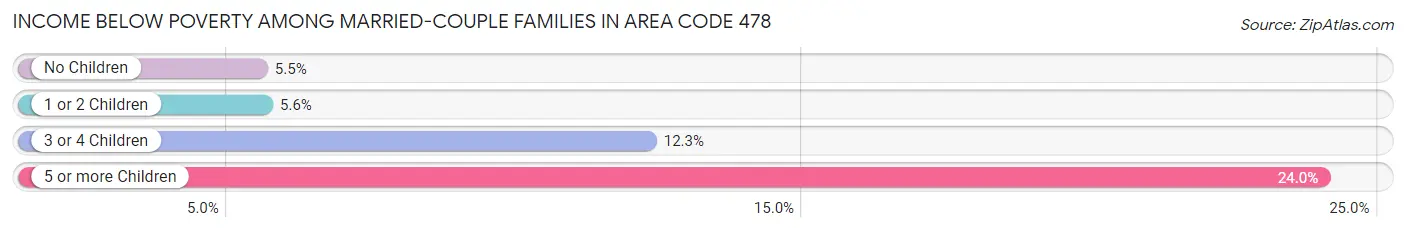
| Children | Above Poverty | Below Poverty |
| No Children | 64,214 (94.5%) | 3,749 (5.5%) |
| 1 or 2 Children | 30,532 (94.4%) | 1,816 (5.6%) |
| 3 or 4 Children | 7,338 (87.7%) | 1,028 (12.3%) |
| 5 or more Children | 1,089 (76.0%) | 344 (24.0%) |
| Total | 103,173 (93.7%) | 6,937 (6.3%) |
Income Below Poverty Among Single-Parent Households in Area Code 478
According to the poverty data in Area Code 478, 18.7% or 2,349 single-father households and 34.6% or 14,736 single-mother households are living below the poverty line. Among single-father households, those with 3 or 4 children have the highest poverty rate, with 315 households (37.9%) experiencing poverty. Likewise, among single-mother households, those with 5 or more children have the highest poverty rate, with 425 households (85.3%) falling below the poverty line.
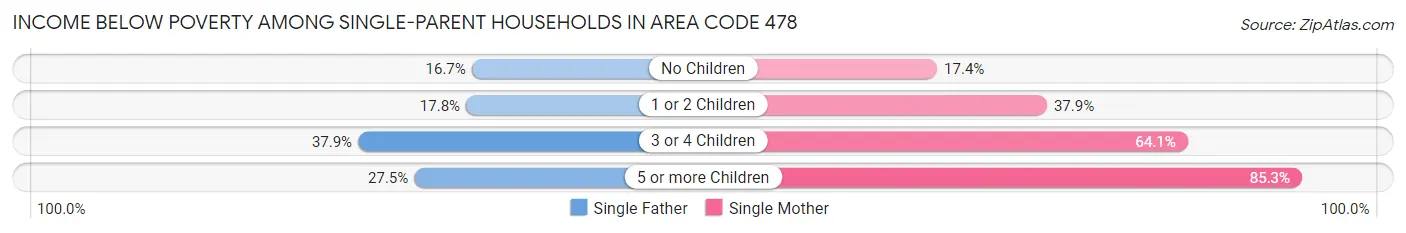
| Children | Single Father | Single Mother |
| No Children | 962 (16.7%) | 2,537 (17.4%) |
| 1 or 2 Children | 1,058 (17.8%) | 8,473 (37.9%) |
| 3 or 4 Children | 315 (37.9%) | 3,301 (64.1%) |
| 5 or more Children | 14 (27.5%) | 425 (85.3%) |
| Total | 2,349 (18.7%) | 14,736 (34.6%) |
Income Below Poverty Among Married-Couple vs Single-Parent Households in Area Code 478
The poverty data for Area Code 478 shows that 6,937 of the married-couple family households (6.3%) and 17,085 of the single-parent households (31.0%) are living below the poverty level. Within the married-couple family households, those with 5 or more children have the highest poverty rate, with 344 households (24.0%) falling below the poverty line. Among the single-parent households, those with 5 or more children have the highest poverty rate, with 439 household (80.0%) living below poverty.
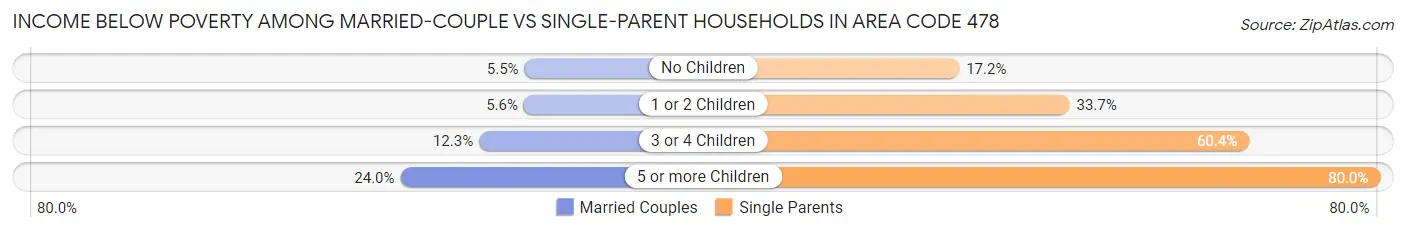
| Children | Married-Couple Families | Single-Parent Households |
| No Children | 3,749 (5.5%) | 3,499 (17.2%) |
| 1 or 2 Children | 1,816 (5.6%) | 9,531 (33.7%) |
| 3 or 4 Children | 1,028 (12.3%) | 3,616 (60.4%) |
| 5 or more Children | 344 (24.0%) | 439 (80.0%) |
| Total | 6,937 (6.3%) | 17,085 (31.0%) |
Race in Area Code 478
The most populous races in Area Code 478 are White / Caucasian (362,369 | 52.9%), Black / African American (270,471 | 39.5%), and Hispanic or Latino (31,127 | 4.5%).
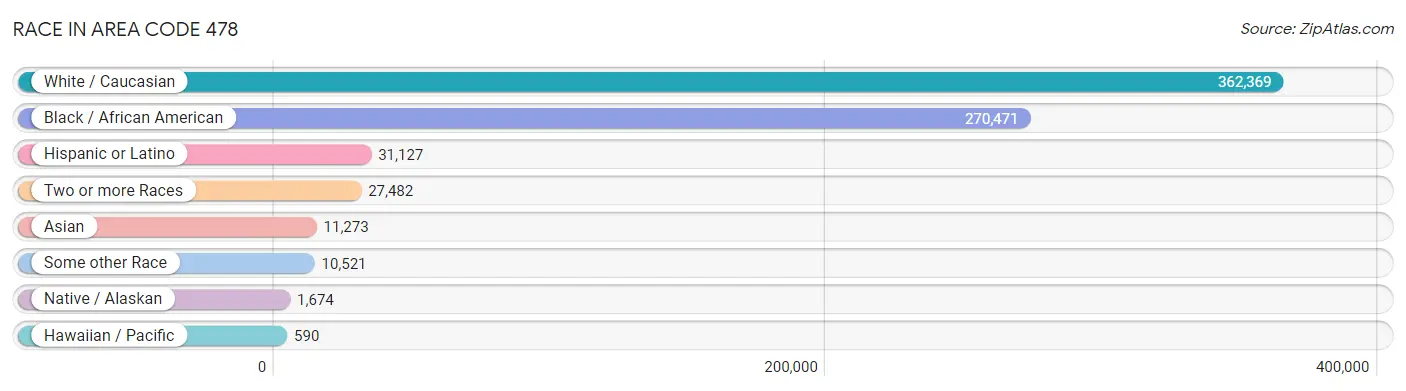
| Race | # Population | % Population |
| Asian | 11,273 | 1.7% |
| Black / African American | 270,471 | 39.5% |
| Hawaiian / Pacific | 590 | 0.1% |
| Hispanic or Latino | 31,127 | 4.5% |
| Native / Alaskan | 1,674 | 0.2% |
| White / Caucasian | 362,369 | 52.9% |
| Two or more Races | 27,482 | 4.0% |
| Some other Race | 10,521 | 1.5% |
| Total | 684,380 | 100.0% |
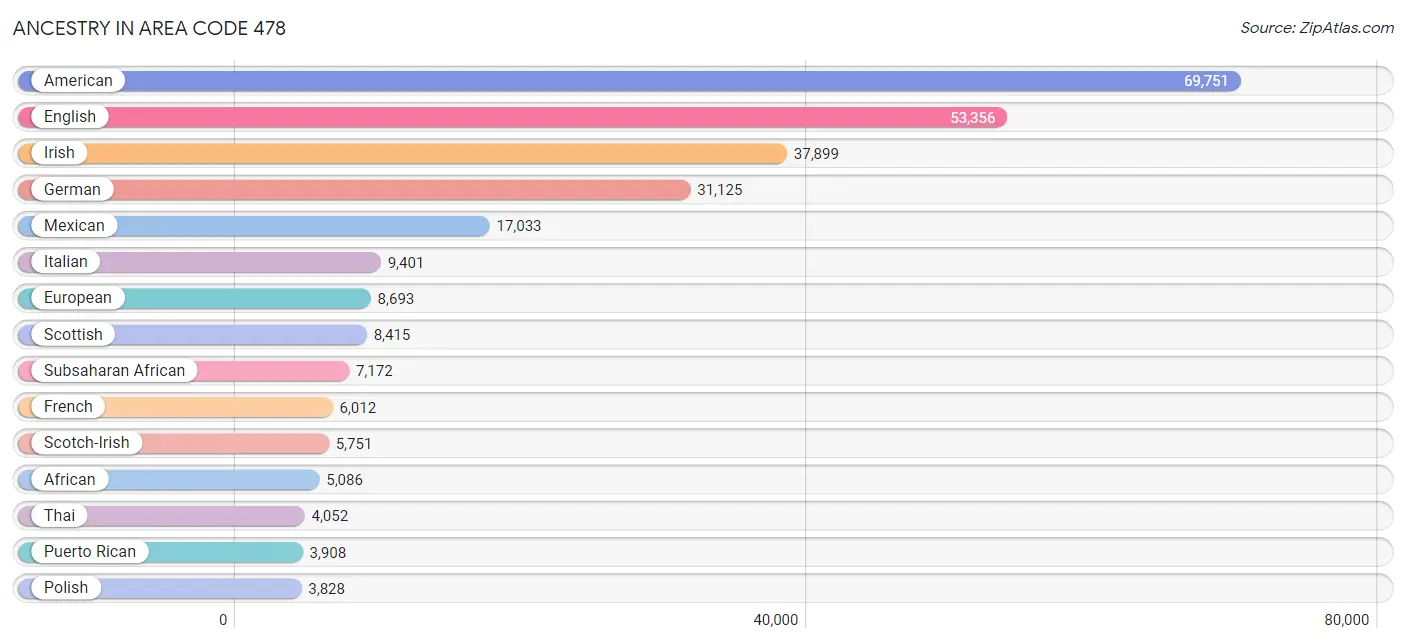
Ancestry in Area Code 478
The most populous ancestries reported in Area Code 478 are American (69,751 | 10.2%), English (53,356 | 7.8%), Irish (37,899 | 5.5%), German (31,125 | 4.5%), and Mexican (17,033 | 2.5%), together accounting for 30.6% of all Area Code 478 residents.
| Ancestry | # Population | % Population |
| African | 5,086 | 0.7% |
| Albanian | 38 | 0.0% |
| American | 69,751 | 10.2% |
| Apache | 32 | 0.0% |
| Arab | 1,358 | 0.2% |
| Argentinean | 311 | 0.1% |
| Armenian | 75 | 0.0% |
| Australian | 119 | 0.0% |
| Austrian | 269 | 0.0% |
| Bahamian | 153 | 0.0% |
| Bangladeshi | 18 | 0.0% |
| Barbadian | 17 | 0.0% |
| Belgian | 236 | 0.0% |
| Bhutanese | 485 | 0.1% |
| Blackfeet | 652 | 0.1% |
| Brazilian | 257 | 0.0% |
| British | 3,770 | 0.5% |
| British West Indian | 227 | 0.0% |
| Bulgarian | 39 | 0.0% |
| Burmese | 2,124 | 0.3% |
| Cajun | 197 | 0.0% |
| Cambodian | 25 | 0.0% |
| Canadian | 406 | 0.1% |
| Cape Verdean | 13 | 0.0% |
| Celtic | 129 | 0.0% |
| Central American | 3,089 | 0.4% |
| Central American Indian | 88 | 0.0% |
| Cherokee | 3,281 | 0.5% |
| Chilean | 45 | 0.0% |
| Choctaw | 227 | 0.0% |
| Colombian | 836 | 0.1% |
| Comanche | 51 | 0.0% |
| Costa Rican | 32 | 0.0% |
| Creek | 315 | 0.1% |
| Croatian | 110 | 0.0% |
| Cuban | 1,669 | 0.2% |
| Czech | 543 | 0.1% |
| Czechoslovakian | 71 | 0.0% |
| Danish | 322 | 0.1% |
| Delaware | 28 | 0.0% |
| Dominican | 344 | 0.1% |
| Dutch | 2,631 | 0.4% |
| Eastern European | 532 | 0.1% |
| Ecuadorian | 196 | 0.0% |
| Egyptian | 20 | 0.0% |
| English | 53,356 | 7.8% |
| Ethiopian | 601 | 0.1% |
| European | 8,693 | 1.3% |
| Fijian | 86 | 0.0% |
| Filipino | 86 | 0.0% |
| Finnish | 260 | 0.0% |
| French | 6,012 | 0.9% |
| French American Indian | 50 | 0.0% |
| French Canadian | 847 | 0.1% |
| German | 31,125 | 4.5% |
| German Russian | 35 | 0.0% |
| Ghanaian | 53 | 0.0% |
| Greek | 1,143 | 0.2% |
| Guamanian / Chamorro | 104 | 0.0% |
| Guatemalan | 1,682 | 0.3% |
| Guyanese | 89 | 0.0% |
| Haitian | 841 | 0.1% |
| Honduran | 228 | 0.0% |
| Hopi | 4 | 0.0% |
| Hungarian | 460 | 0.1% |
| Icelander | 49 | 0.0% |
| Indian (Asian) | 1,832 | 0.3% |
| Indonesian | 274 | 0.0% |
| Iranian | 62 | 0.0% |
| Irish | 37,899 | 5.5% |
| Iroquois | 151 | 0.0% |
| Israeli | 28 | 0.0% |
| Italian | 9,401 | 1.4% |
| Jamaican | 1,885 | 0.3% |
| Japanese | 78 | 0.0% |
| Jordanian | 363 | 0.1% |
| Kenyan | 43 | 0.0% |
| Korean | 3,321 | 0.5% |
| Latvian | 17 | 0.0% |
| Lebanese | 414 | 0.1% |
| Liberian | 31 | 0.0% |
| Lithuanian | 115 | 0.0% |
| Luxembourger | 38 | 0.0% |
| Macedonian | 51 | 0.0% |
| Malaysian | 338 | 0.1% |
| Mexican | 17,033 | 2.5% |
| Mexican American Indian | 316 | 0.1% |
| Moroccan | 53 | 0.0% |
| Native Hawaiian | 516 | 0.1% |
| Navajo | 37 | 0.0% |
| New Zealander | 42 | 0.0% |
| Nicaraguan | 181 | 0.0% |
| Nigerian | 536 | 0.1% |
| Northern European | 554 | 0.1% |
| Norwegian | 1,174 | 0.2% |
| Pakistani | 260 | 0.0% |
| Palestinian | 74 | 0.0% |
| Panamanian | 266 | 0.0% |
| Pennsylvania German | 57 | 0.0% |
| Peruvian | 337 | 0.1% |
| Polish | 3,828 | 0.6% |
| Portuguese | 652 | 0.1% |
| Pueblo | 39 | 0.0% |
| Puerto Rican | 3,908 | 0.6% |
| Romanian | 117 | 0.0% |
| Russian | 523 | 0.1% |
| Salvadoran | 688 | 0.1% |
| Samoan | 57 | 0.0% |
| Scandinavian | 491 | 0.1% |
| Scotch-Irish | 5,751 | 0.8% |
| Scottish | 8,415 | 1.2% |
| Seminole | 59 | 0.0% |
| Senegalese | 174 | 0.0% |
| Sioux | 137 | 0.0% |
| Slavic | 156 | 0.0% |
| Slovak | 83 | 0.0% |
| South African | 48 | 0.0% |
| South American | 2,248 | 0.3% |
| South American Indian | 95 | 0.0% |
| Spaniard | 788 | 0.1% |
| Spanish | 307 | 0.0% |
| Sri Lankan | 2,116 | 0.3% |
| Subsaharan African | 7,172 | 1.1% |
| Swedish | 1,549 | 0.2% |
| Swiss | 373 | 0.1% |
| Syrian | 154 | 0.0% |
| Thai | 4,052 | 0.6% |
| Tongan | 101 | 0.0% |
| Trinidadian and Tobagonian | 170 | 0.0% |
| Turkish | 71 | 0.0% |
| U.S. Virgin Islander | 183 | 0.0% |
| Ugandan | 29 | 0.0% |
| Ukrainian | 118 | 0.0% |
| Uruguayan | 114 | 0.0% |
| Ute | 23 | 0.0% |
| Venezuelan | 398 | 0.1% |
| Welsh | 1,725 | 0.3% |
| West Indian | 359 | 0.1% |
| Yugoslavian | 61 | 0.0% |
| Yup'ik | 4 | 0.0% | View All 140 Rows |
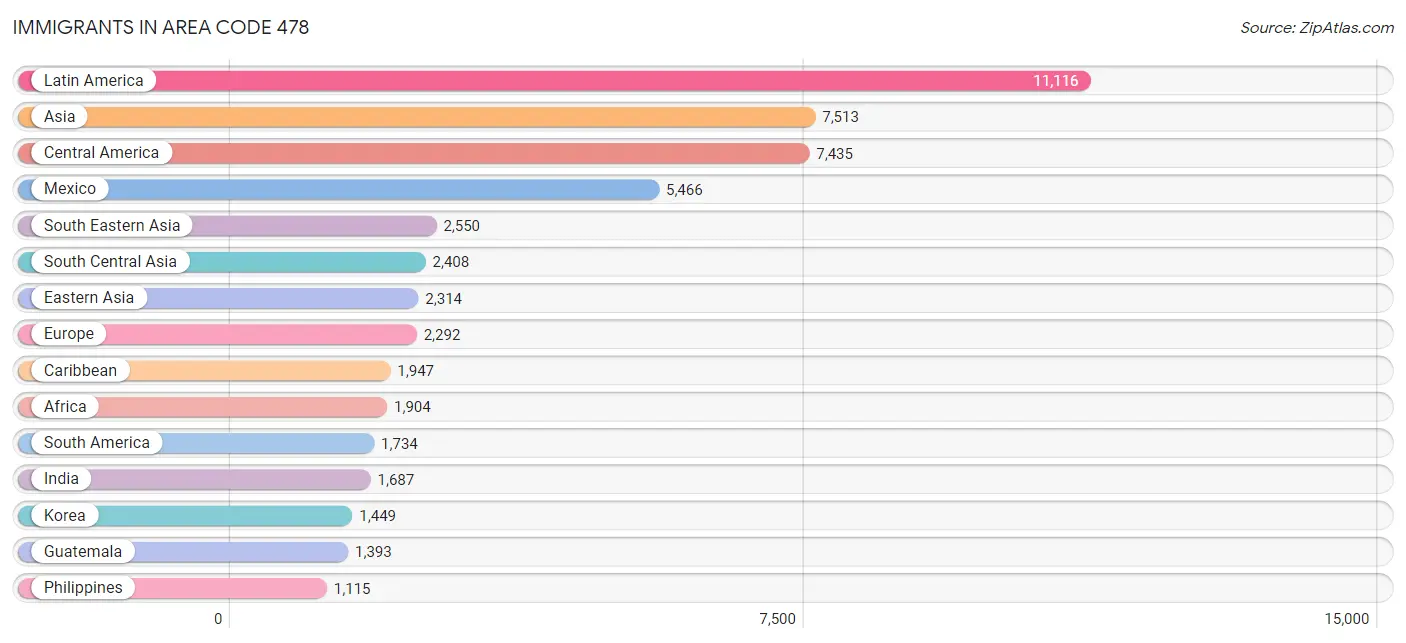
Immigrants in Area Code 478
The most numerous immigrant groups reported in Area Code 478 came from Latin America (11,116 | 1.6%), Asia (7,513 | 1.1%), Central America (7,435 | 1.1%), Mexico (5,466 | 0.8%), and South Eastern Asia (2,550 | 0.4%), together accounting for 5.0% of all Area Code 478 residents.
| Immigration Origin | # Population | % Population |
| Africa | 1,904 | 0.3% |
| Albania | 33 | 0.0% |
| Argentina | 12 | 0.0% |
| Asia | 7,513 | 1.1% |
| Australia | 86 | 0.0% |
| Austria | 62 | 0.0% |
| Bahamas | 60 | 0.0% |
| Belgium | 50 | 0.0% |
| Belize | 35 | 0.0% |
| Brazil | 101 | 0.0% |
| Cameroon | 35 | 0.0% |
| Canada | 549 | 0.1% |
| Caribbean | 1,947 | 0.3% |
| Central America | 7,435 | 1.1% |
| Chile | 20 | 0.0% |
| China | 556 | 0.1% |
| Colombia | 754 | 0.1% |
| Congo | 30 | 0.0% |
| Costa Rica | 32 | 0.0% |
| Cuba | 263 | 0.0% |
| Czechoslovakia | 28 | 0.0% |
| Dominican Republic | 133 | 0.0% |
| Eastern Africa | 810 | 0.1% |
| Eastern Asia | 2,314 | 0.3% |
| Eastern Europe | 435 | 0.1% |
| Ecuador | 105 | 0.0% |
| Egypt | 30 | 0.0% |
| El Salvador | 176 | 0.0% |
| England | 450 | 0.1% |
| Ethiopia | 654 | 0.1% |
| Europe | 2,292 | 0.3% |
| France | 106 | 0.0% |
| Germany | 576 | 0.1% |
| Ghana | 68 | 0.0% |
| Greece | 43 | 0.0% |
| Grenada | 12 | 0.0% |
| Guatemala | 1,393 | 0.2% |
| Guyana | 146 | 0.0% |
| Haiti | 49 | 0.0% |
| Honduras | 124 | 0.0% |
| Hungary | 7 | 0.0% |
| India | 1,687 | 0.3% |
| Indonesia | 18 | 0.0% |
| Iran | 52 | 0.0% |
| Iraq | 12 | 0.0% |
| Ireland | 4 | 0.0% |
| Israel | 5 | 0.0% |
| Italy | 47 | 0.0% |
| Jamaica | 1,031 | 0.2% |
| Japan | 309 | 0.1% |
| Jordan | 159 | 0.0% |
| Kazakhstan | 3 | 0.0% |
| Kenya | 99 | 0.0% |
| Korea | 1,449 | 0.2% |
| Laos | 81 | 0.0% |
| Latin America | 11,116 | 1.6% |
| Latvia | 17 | 0.0% |
| Liberia | 28 | 0.0% |
| Malaysia | 9 | 0.0% |
| Mexico | 5,466 | 0.8% |
| Middle Africa | 163 | 0.0% |
| Morocco | 25 | 0.0% |
| Netherlands | 13 | 0.0% |
| Nicaragua | 48 | 0.0% |
| Nigeria | 251 | 0.0% |
| Northern Africa | 145 | 0.0% |
| Northern Europe | 772 | 0.1% |
| Oceania | 285 | 0.0% |
| Pakistan | 496 | 0.1% |
| Panama | 161 | 0.0% |
| Peru | 100 | 0.0% |
| Philippines | 1,115 | 0.2% |
| Poland | 50 | 0.0% |
| Romania | 36 | 0.0% |
| Russia | 245 | 0.0% |
| Scotland | 32 | 0.0% |
| Senegal | 68 | 0.0% |
| Serbia | 19 | 0.0% |
| Singapore | 32 | 0.0% |
| South Africa | 52 | 0.0% |
| South America | 1,734 | 0.3% |
| South Central Asia | 2,408 | 0.4% |
| South Eastern Asia | 2,550 | 0.4% |
| Southern Europe | 278 | 0.0% |
| Spain | 188 | 0.0% |
| Sri Lanka | 170 | 0.0% |
| St. Vincent and the Grenadines | 72 | 0.0% |
| Sudan | 43 | 0.0% |
| Taiwan | 86 | 0.0% |
| Thailand | 113 | 0.0% |
| Trinidad and Tobago | 195 | 0.0% |
| Turkey | 65 | 0.0% |
| Uganda | 29 | 0.0% |
| Uruguay | 153 | 0.0% |
| Venezuela | 343 | 0.1% |
| Vietnam | 1,059 | 0.2% |
| Western Africa | 687 | 0.1% |
| Western Asia | 241 | 0.0% |
| Western Europe | 807 | 0.1% |
| Zaire | 98 | 0.0% |
| Zimbabwe | 5 | 0.0% | View All 101 Rows |
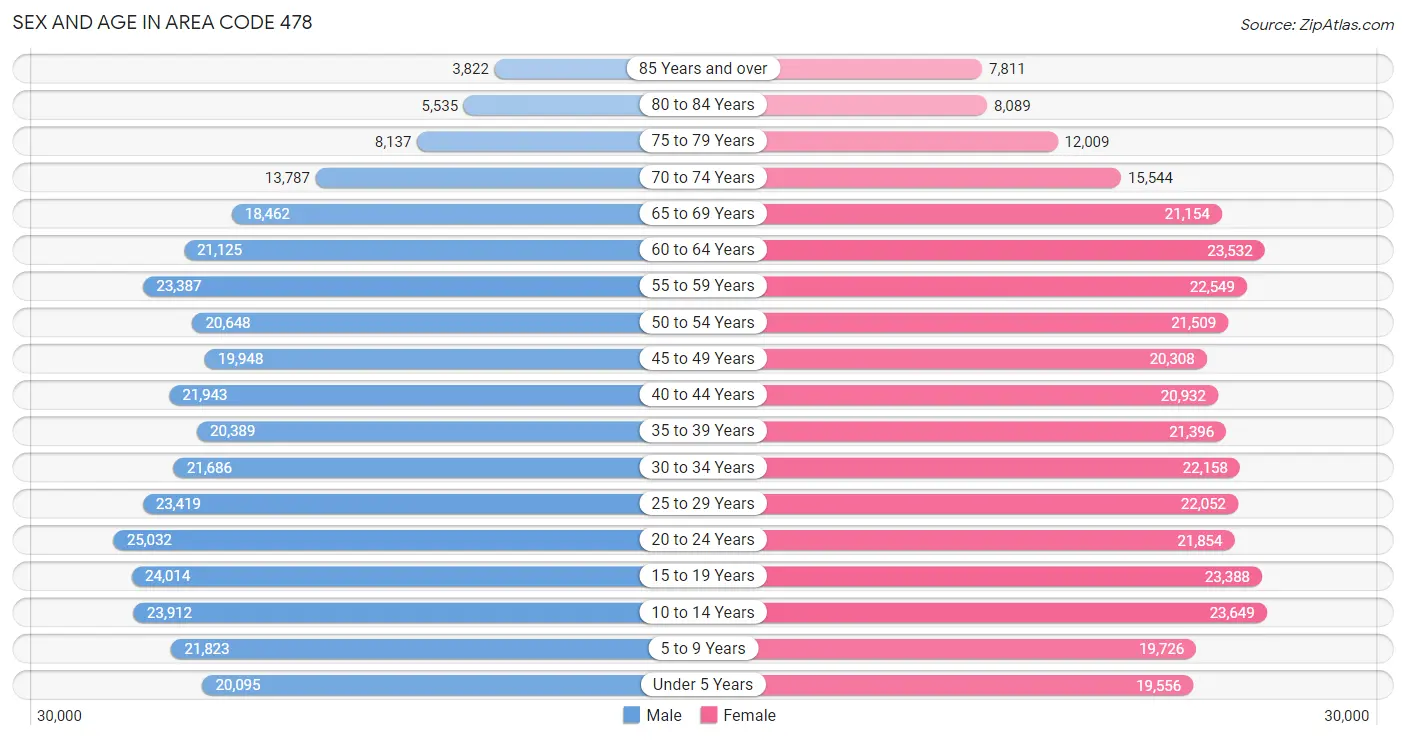
Sex and Age in Area Code 478
Sex and Age in Area Code 478
The most populous age groups in Area Code 478 are 20 to 24 Years (25,032 | 7.4%) for men and 10 to 14 Years (23,649 | 6.8%) for women.
| Age Bracket | Male | Female |
| Under 5 Years | 20,095 (6.0%) | 19,556 (5.6%) |
| 5 to 9 Years | 21,823 (6.5%) | 19,726 (5.7%) |
| 10 to 14 Years | 23,912 (7.1%) | 23,649 (6.8%) |
| 15 to 19 Years | 24,014 (7.1%) | 23,388 (6.7%) |
| 20 to 24 Years | 25,032 (7.4%) | 21,854 (6.3%) |
| 25 to 29 Years | 23,419 (7.0%) | 22,052 (6.4%) |
| 30 to 34 Years | 21,686 (6.4%) | 22,158 (6.4%) |
| 35 to 39 Years | 20,389 (6.0%) | 21,396 (6.2%) |
| 40 to 44 Years | 21,943 (6.5%) | 20,932 (6.0%) |
| 45 to 49 Years | 19,948 (5.9%) | 20,308 (5.9%) |
| 50 to 54 Years | 20,648 (6.1%) | 21,509 (6.2%) |
| 55 to 59 Years | 23,387 (6.9%) | 22,549 (6.5%) |
| 60 to 64 Years | 21,125 (6.3%) | 23,532 (6.8%) |
| 65 to 69 Years | 18,462 (5.5%) | 21,154 (6.1%) |
| 70 to 74 Years | 13,787 (4.1%) | 15,544 (4.5%) |
| 75 to 79 Years | 8,137 (2.4%) | 12,009 (3.5%) |
| 80 to 84 Years | 5,535 (1.6%) | 8,089 (2.3%) |
| 85 Years and over | 3,822 (1.1%) | 7,811 (2.2%) |
| Total | 337,164 (100.0%) | 347,216 (100.0%) |
Families and Households in Area Code 478
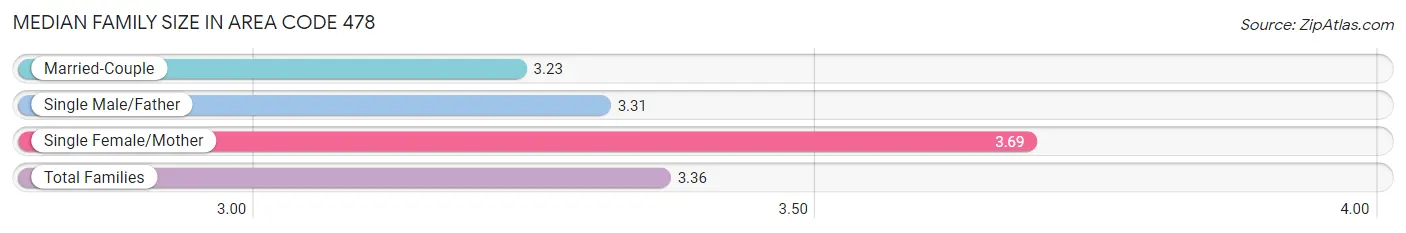
Median Family Size in Area Code 478
The median family size in Area Code 478 is 3.36 persons per family, with single female/mother families (42,602 | 25.8%) accounting for the largest median family size of 3.68736 persons per family. On the other hand, married-couple families (110,110 | 66.6%) represent the smallest median family size with 3.23 persons per family.
| Family Type | # Families | Family Size |
| Married-Couple | 110,110 (66.6%) | 3.23 |
| Single Male/Father | 12,571 (7.6%) | 3.31 |
| Single Female/Mother | 42,602 (25.8%) | 3.69 |
| Total Families | 165,283 (100.0%) | 3.36 |
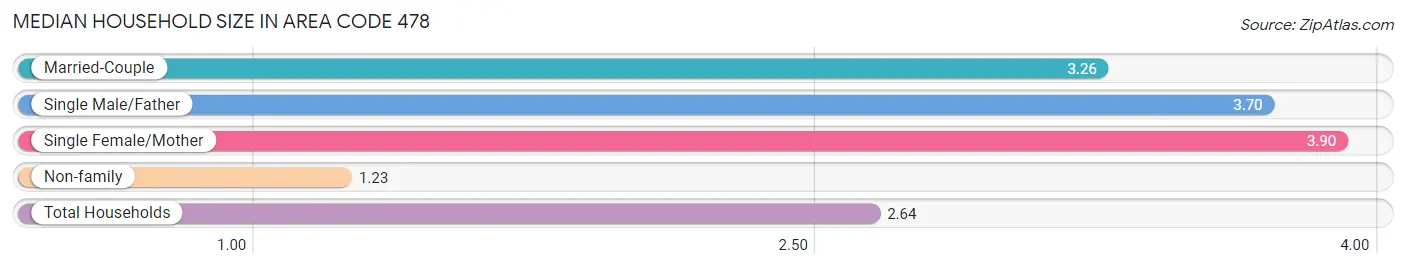
Median Household Size in Area Code 478
The median household size in Area Code 478 is 2.64 persons per household, with single female/mother households (42,602 | 16.9%) accounting for the largest median household size of 3.89631 persons per household. non-family households (86,362 | 34.3%) represent the smallest median household size with 1.23 persons per household.
| Household Type | # Households | Household Size |
| Married-Couple | 110,110 (43.8%) | 3.26 |
| Single Male/Father | 12,571 (5.0%) | 3.70 |
| Single Female/Mother | 42,602 (16.9%) | 3.90 |
| Non-family | 86,362 (34.3%) | 1.23 |
| Total Households | 251,645 (100.0%) | 2.64 |
Household Size by Marriage Status in Area Code 478
Out of a total of 251,645 households in Area Code 478, 165,283 (65.7%) are family households, while 86,362 (34.3%) are nonfamily households. The most numerous type of family households are 2-person households, comprising 75,122, and the most common type of nonfamily households are 1-person households, comprising 75,447.
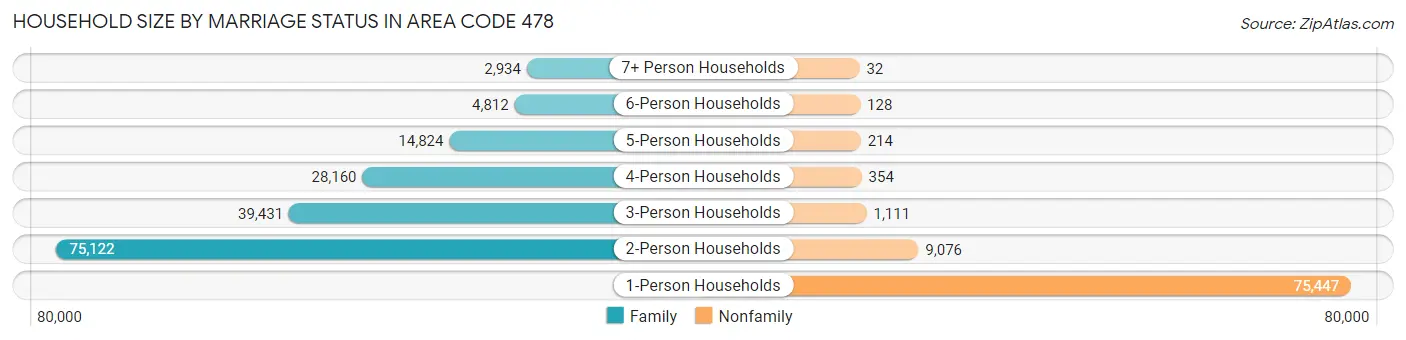
| Household Size | Family Households | Nonfamily Households |
| 1-Person Households | - | 75,447 (30.0%) |
| 2-Person Households | 75,122 (29.8%) | 9,076 (3.6%) |
| 3-Person Households | 39,431 (15.7%) | 1,111 (0.4%) |
| 4-Person Households | 28,160 (11.2%) | 354 (0.1%) |
| 5-Person Households | 14,824 (5.9%) | 214 (0.1%) |
| 6-Person Households | 4,812 (1.9%) | 128 (0.1%) |
| 7+ Person Households | 2,934 (1.2%) | 32 (0.0%) |
| Total | 165,283 (65.7%) | 86,362 (34.3%) |
Female Fertility in Area Code 478
Fertility by Age in Area Code 478
Average fertility rate in Area Code 478 is 60.5 births per 1,000 women. Women in the age bracket of 15 to 19 years have the highest fertility rate with 181.1 births per 1,000 women. Women in the age bracket of 20 to 34 years acount for 78.2% of all women with births.
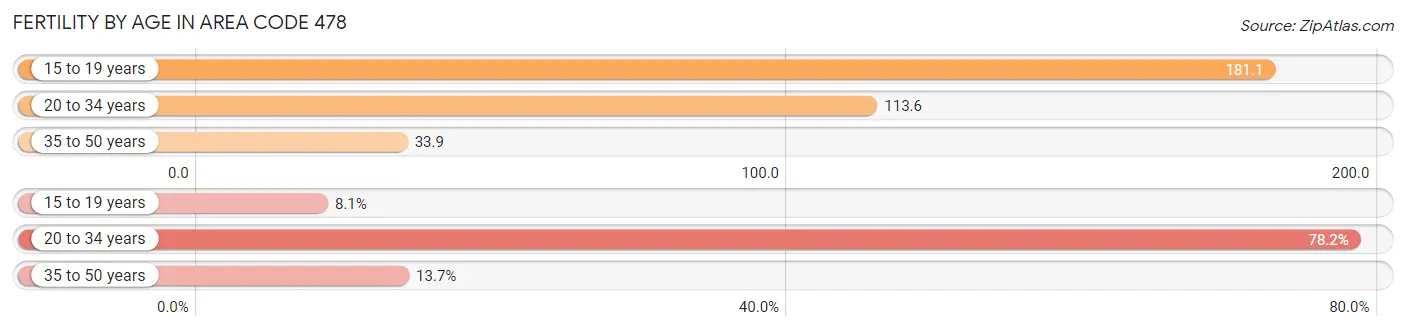
| Age Bracket | Women with Births | Births / 1,000 Women |
| 15 to 19 years | 679 (8.1%) | 181.1 |
| 20 to 34 years | 6,528 (78.2%) | 113.6 |
| 35 to 50 years | 1,139 (13.7%) | 33.9 |
| Total | 8,346 (100.0%) | 60.5 |
Fertility by Age by Marriage Status in Area Code 478
39.5% of women with births (8,346) in Area Code 478 are married. The highest percentage of unmarried women with births falls into 15 to 19 years age bracket with 97.6% of them unmarried at the time of birth, while the lowest percentage of unmarried women with births belong to 20 to 34 years age bracket with 59.1% of them unmarried.
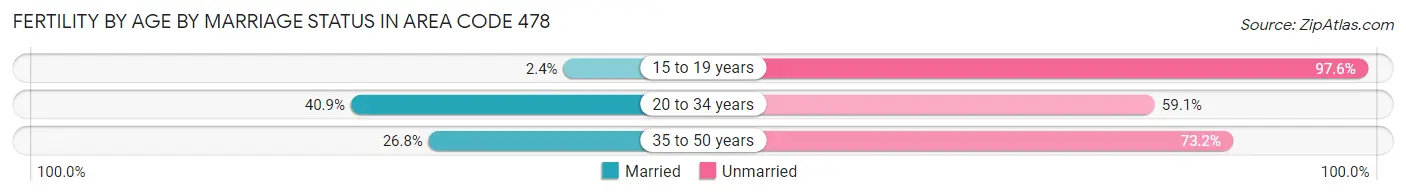
| Age Bracket | Married | Unmarried |
| 15 to 19 years | 16 (2.4%) | 663 (97.6%) |
| 20 to 34 years | 2,669 (40.9%) | 3,859 (59.1%) |
| 35 to 50 years | 305 (26.8%) | 834 (73.2%) |
| Total | 3,293 (39.5%) | 5,053 (60.5%) |
Fertility by Education in Area Code 478
Average fertility rate in Area Code 478 is 60.5 births per 1,000 women. Women with the education attainment of bachelor's degree have the highest fertility rate of 122.3 births per 1,000 women, while women with the education attainment of college or associate's degree have the lowest fertility at 81.3 births per 1,000 women. Women with the education attainment of college or associate's degree represent 32.9% of all women with births.
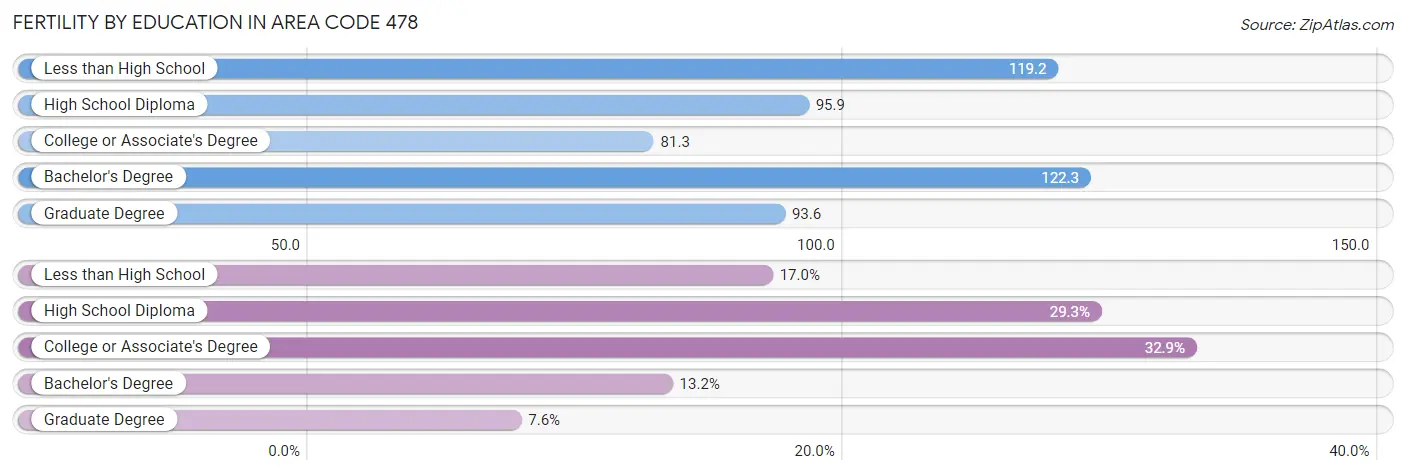
| Educational Attainment | Women with Births | Births / 1,000 Women |
| Less than High School | 1,418 (17.0%) | 119.2 |
| High School Diploma | 2,447 (29.3%) | 95.8 |
| College or Associate's Degree | 2,744 (32.9%) | 81.3 |
| Bachelor's Degree | 1,105 (13.2%) | 122.3 |
| Graduate Degree | 632 (7.6%) | 93.6 |
| Total | 8,346 (100.0%) | 60.5 |
Fertility by Education by Marriage Status in Area Code 478
60.5% of women with births in Area Code 478 are unmarried. Women with the educational attainment of bachelor's degree are most likely to be married with 76.2% of them married at childbirth, while women with the educational attainment of less than high school are least likely to be married with 89.7% of them unmarried at childbirth.
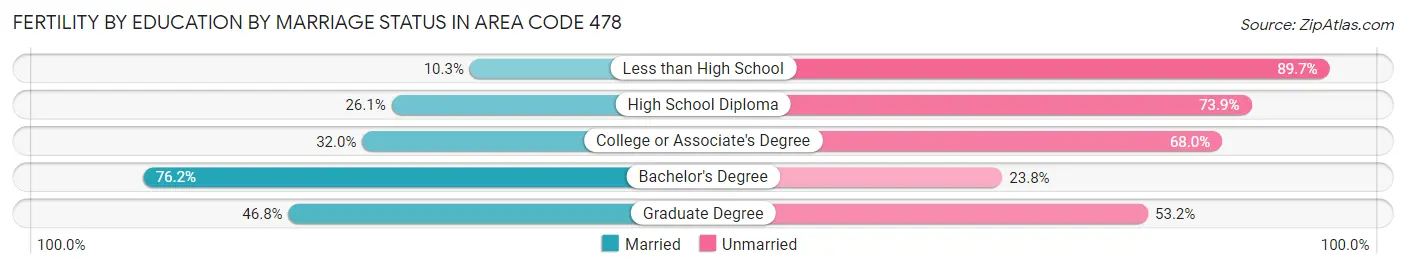
| Educational Attainment | Married | Unmarried |
| Less than High School | 146 (10.3%) | 1,272 (89.7%) |
| High School Diploma | 638 (26.1%) | 1,809 (73.9%) |
| College or Associate's Degree | 877 (32.0%) | 1,867 (68.0%) |
| Bachelor's Degree | 842 (76.2%) | 263 (23.8%) |
| Graduate Degree | 296 (46.8%) | 336 (53.2%) |
| Total | 3,293 (39.5%) | 5,053 (60.5%) |
Employment Characteristics in Area Code 478
Employment by Class of Employer in Area Code 478
Among the 282,520 employed individuals in Area Code 478, private company employees (177,664 | 62.9%), federal government employees (24,916 | 8.8%), and local government employees (20,808 | 7.4%) make up the most common classes of employment.
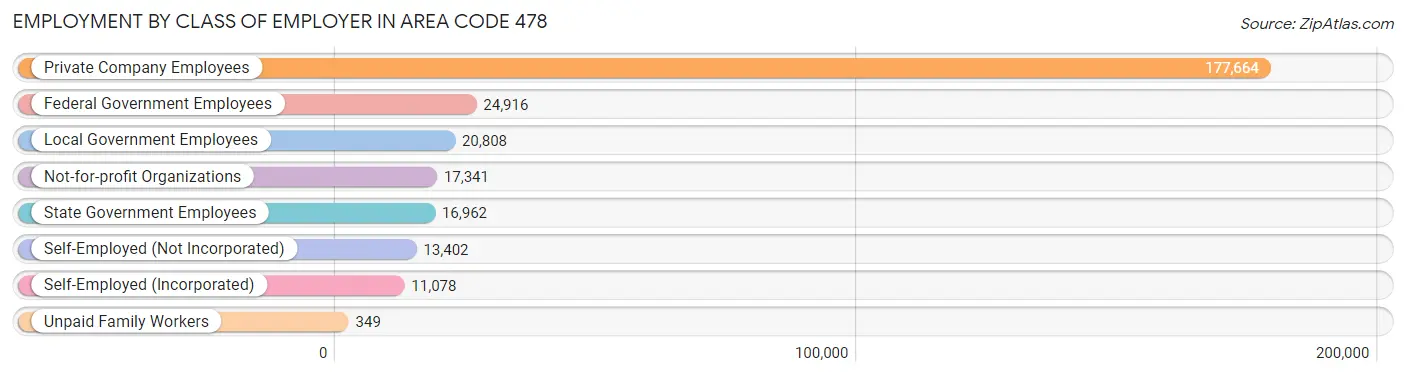
| Employer Class | # Employees | % Employees |
| Private Company Employees | 177,664 | 62.9% |
| Self-Employed (Incorporated) | 11,078 | 3.9% |
| Self-Employed (Not Incorporated) | 13,402 | 4.7% |
| Not-for-profit Organizations | 17,341 | 6.1% |
| Local Government Employees | 20,808 | 7.4% |
| State Government Employees | 16,962 | 6.0% |
| Federal Government Employees | 24,916 | 8.8% |
| Unpaid Family Workers | 349 | 0.1% |
| Total | 282,520 | 100.0% |
Employment Status by Age in Area Code 478
According to the labor force statistics for Area Code 478, out of the total population over 16 years of age (546,741), 50.6% or 276,487 individuals are in the labor force, with 6.5% or 17,999 of them unemployed. The age group with the highest labor force participation rate is 35 to 44 years, with 76.7% or 64,960 individuals in the labor force. Within the labor force, the 16 to 19 years age range has the highest percentage of unemployed individuals, with 1,422.3% or 205,039 of them being unemployed.
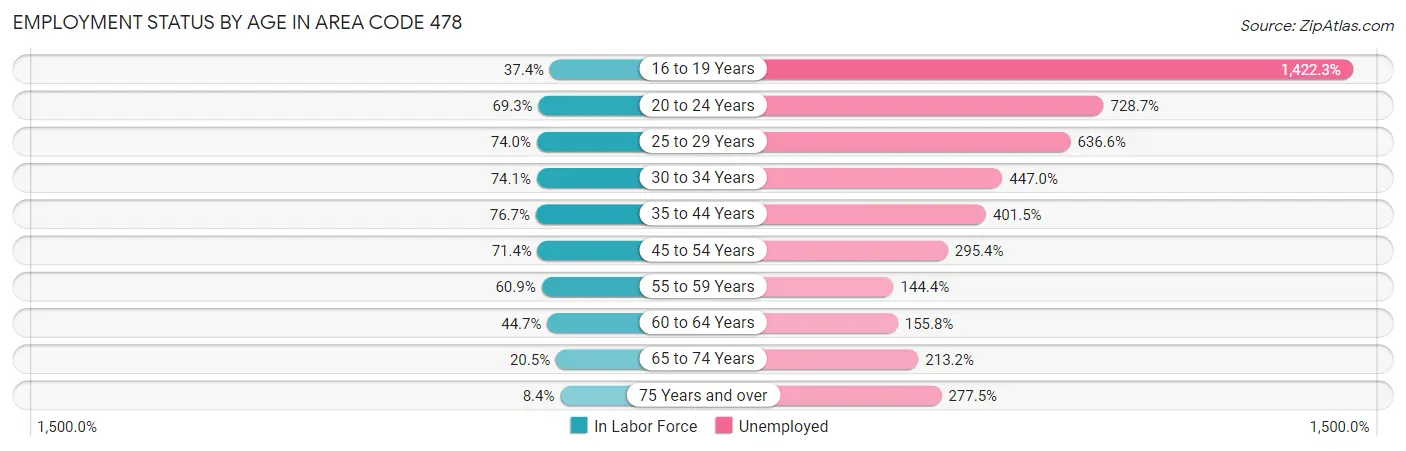
| Age Bracket | In Labor Force | Unemployed |
| 16 to 19 Years | 14,416 (37.4%) | 205,039 (1,422.3%) |
| 20 to 24 Years | 32,497 (69.3%) | 236,806 (728.7%) |
| 25 to 29 Years | 33,626 (74.0%) | 214,063 (636.6%) |
| 30 to 34 Years | 32,495 (74.1%) | 145,244 (447.0%) |
| 35 to 44 Years | 64,959 (76.7%) | 260,814 (401.5%) |
| 45 to 54 Years | 58,855 (71.4%) | 173,846 (295.4%) |
| 55 to 59 Years | 27,964 (60.9%) | 40,383 (144.4%) |
| 60 to 64 Years | 19,978 (44.7%) | 31,129 (155.8%) |
| 65 to 74 Years | 14,147 (20.5%) | 30,164 (213.2%) |
| 75 Years and over | 3,825 (8.4%) | 10,609 (277.5%) |
| Total | 276,484 (50.6%) | 18,001 (6.5%) |
Employment Status by Educational Attainment in Area Code 478
According to labor force statistics for Area Code 478, 66.3% of individuals (229,910) out of the total population between 25 and 64 years of age (346,981) are in the labor force, with 360.3% or 828,366 of them being unemployed. The group with the highest labor force participation rate are those with the educational attainment of bachelor's degree or higher, with 83.2% or 69,034 individuals in the labor force. Within the labor force, individuals with less than high school education have the highest percentage of unemployment, with 954.0% or 176,471 of them being unemployed.
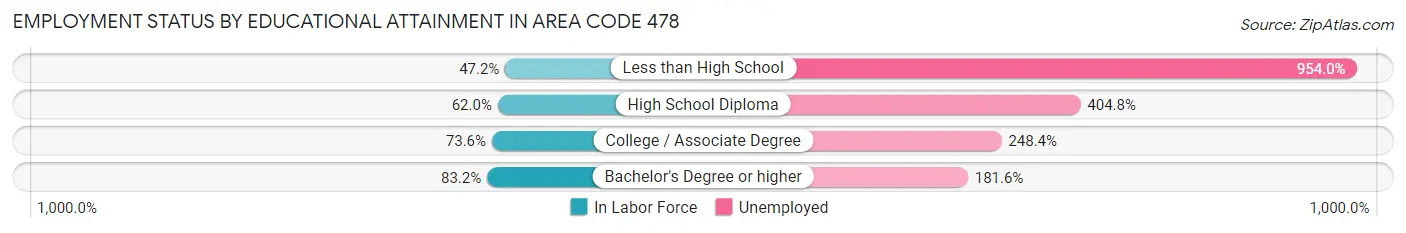
| Educational Attainment | In Labor Force | Unemployed |
| Less than High School | 18,497 (47.2%) | 374,197 (954.0%) |
| High School Diploma | 70,452 (62.0%) | 460,193 (404.8%) |
| College / Associate Degree | 81,781 (73.6%) | 275,848 (248.4%) |
| Bachelor's Degree or higher | 69,033 (83.2%) | 150,770 (181.6%) |
| Total | 229,927 (66.3%) | 1,250,173 (360.3%) |
Employment Occupations by Sex in Area Code 478
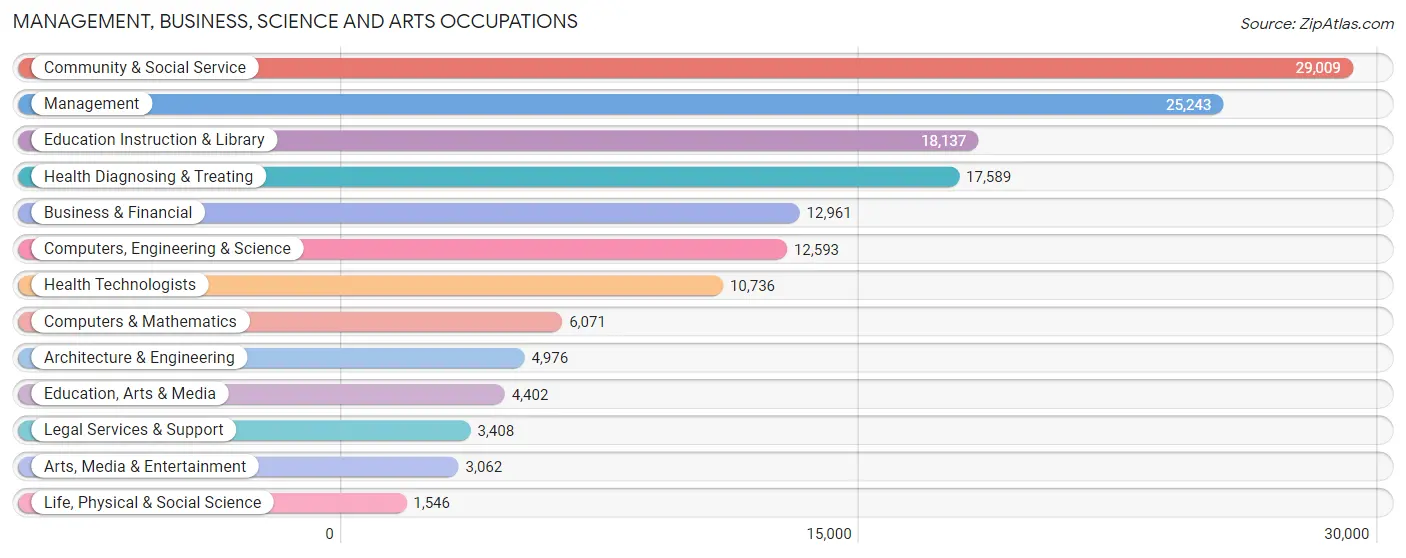
Management, Business, Science and Arts Occupations
The most common Management, Business, Science and Arts occupations in Area Code 478 are Community & Social Service (29,009 | 10.2%), Management (25,243 | 8.9%), Education Instruction & Library (18,137 | 6.4%), Health Diagnosing & Treating (17,589 | 6.2%), and Business & Financial (12,961 | 4.6%).
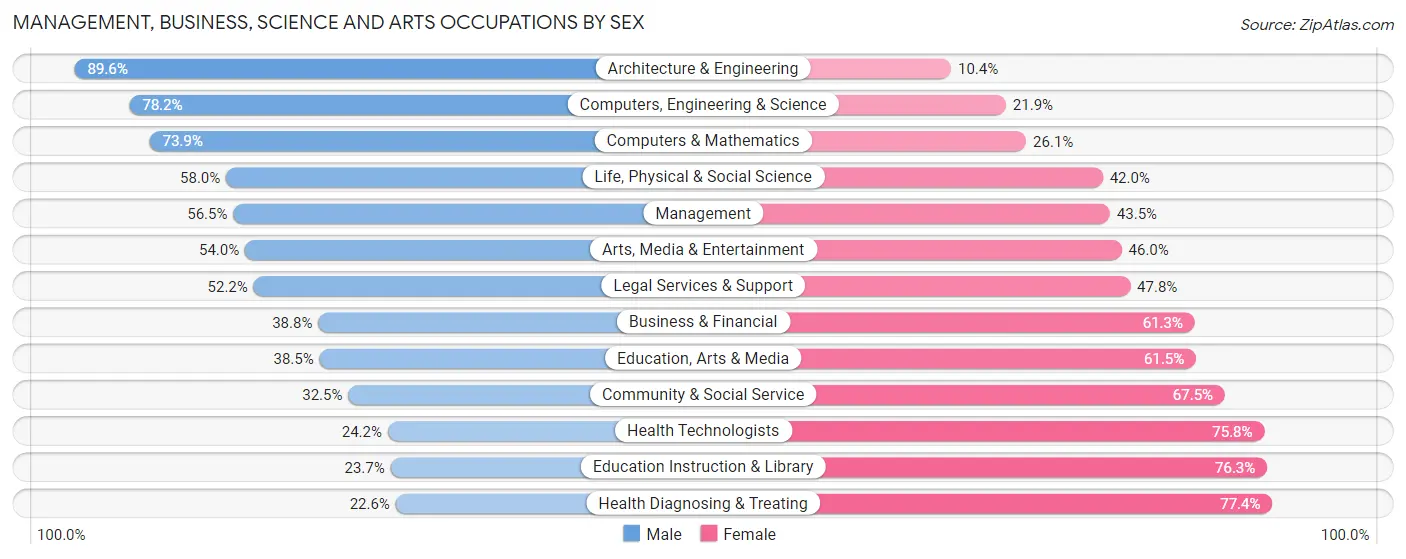
Management, Business, Science and Arts Occupations by Sex
Within the Management, Business, Science and Arts occupations in Area Code 478, the most male-oriented occupations are Architecture & Engineering (89.6%), Computers, Engineering & Science (78.1%), and Computers & Mathematics (73.9%), while the most female-oriented occupations are Health Diagnosing & Treating (77.4%), Education Instruction & Library (76.3%), and Health Technologists (75.8%).
| Occupation | Male | Female |
| Management | 14,253 (56.5%) | 10,990 (43.5%) |
| Business & Financial | 5,023 (38.8%) | 7,938 (61.3%) |
| Computers, Engineering & Science | 9,842 (78.1%) | 2,751 (21.8%) |
| Computers & Mathematics | 4,488 (73.9%) | 1,583 (26.1%) |
| Architecture & Engineering | 4,458 (89.6%) | 518 (10.4%) |
| Life, Physical & Social Science | 896 (58.0%) | 650 (42.0%) |
| Community & Social Service | 9,421 (32.5%) | 19,588 (67.5%) |
| Education, Arts & Media | 1,694 (38.5%) | 2,708 (61.5%) |
| Legal Services & Support | 1,780 (52.2%) | 1,628 (47.8%) |
| Education Instruction & Library | 4,293 (23.7%) | 13,844 (76.3%) |
| Arts, Media & Entertainment | 1,654 (54.0%) | 1,408 (46.0%) |
| Health Diagnosing & Treating | 3,974 (22.6%) | 13,615 (77.4%) |
| Health Technologists | 2,602 (24.2%) | 8,134 (75.8%) |
| Total (Category) | 42,513 (43.6%) | 54,882 (56.4%) |
| Total (Overall) | 146,081 (51.4%) | 137,855 (48.5%) |
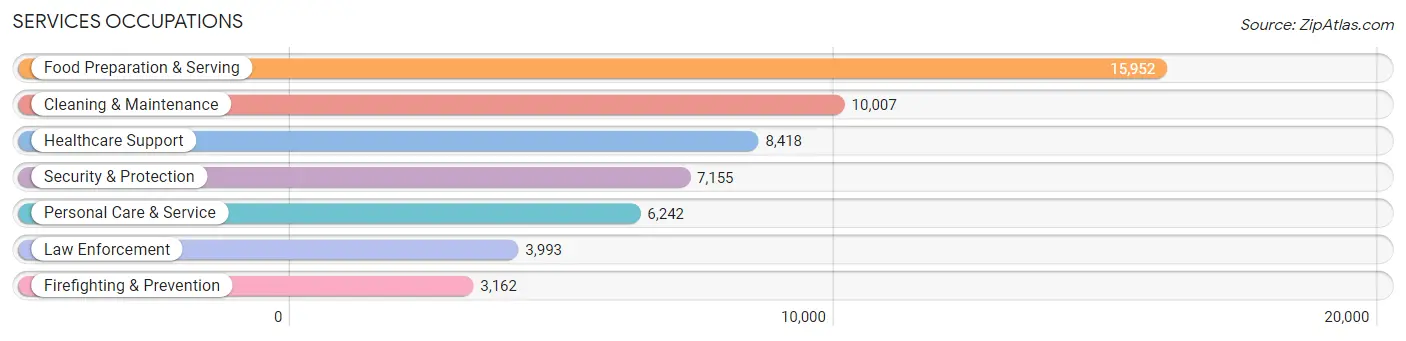
Services Occupations
The most common Services occupations in Area Code 478 are Food Preparation & Serving (15,952 | 5.6%), Cleaning & Maintenance (10,007 | 3.5%), Healthcare Support (8,418 | 3.0%), Security & Protection (7,155 | 2.5%), and Personal Care & Service (6,242 | 2.2%).
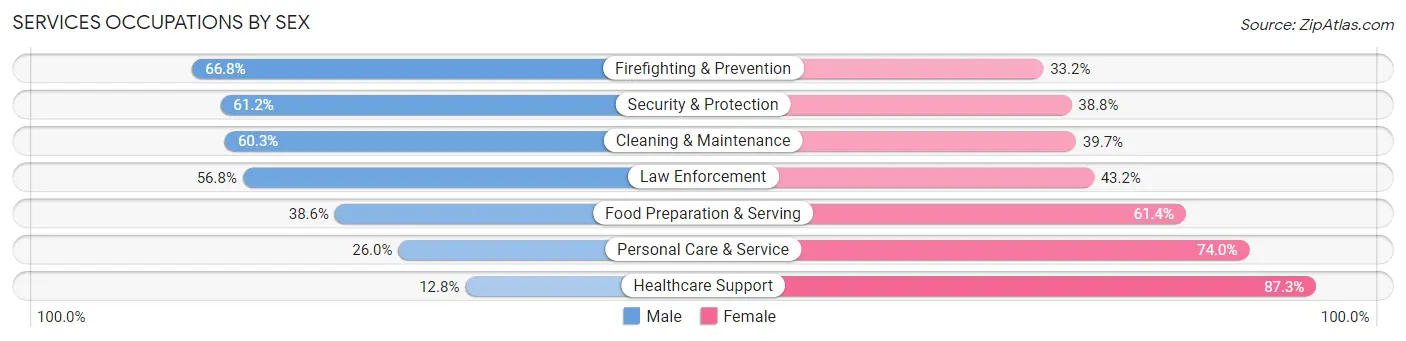
Services Occupations by Sex
Within the Services occupations in Area Code 478, the most male-oriented occupations are Firefighting & Prevention (66.8%), Security & Protection (61.2%), and Cleaning & Maintenance (60.3%), while the most female-oriented occupations are Healthcare Support (87.3%), Personal Care & Service (74.0%), and Food Preparation & Serving (61.4%).
| Occupation | Male | Female |
| Healthcare Support | 1,073 (12.8%) | 7,345 (87.3%) |
| Security & Protection | 4,380 (61.2%) | 2,775 (38.8%) |
| Firefighting & Prevention | 2,112 (66.8%) | 1,050 (33.2%) |
| Law Enforcement | 2,268 (56.8%) | 1,725 (43.2%) |
| Food Preparation & Serving | 6,152 (38.6%) | 9,800 (61.4%) |
| Cleaning & Maintenance | 6,036 (60.3%) | 3,971 (39.7%) |
| Personal Care & Service | 1,623 (26.0%) | 4,619 (74.0%) |
| Total (Category) | 19,264 (40.3%) | 28,510 (59.7%) |
| Total (Overall) | 146,081 (51.4%) | 137,855 (48.5%) |
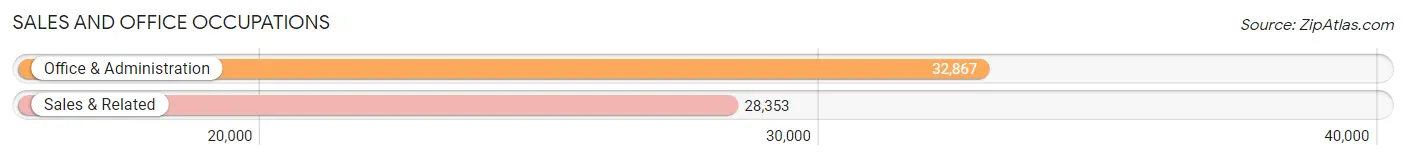
Sales and Office Occupations
The most common Sales and Office occupations in Area Code 478 are Office & Administration (32,867 | 11.6%), and Sales & Related (28,353 | 10.0%).
Sales and Office Occupations by Sex
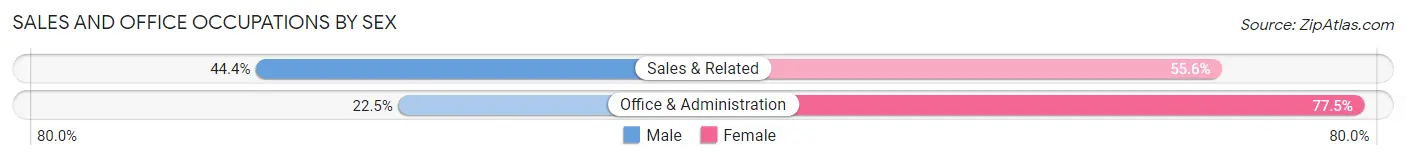
| Occupation | Male | Female |
| Sales & Related | 12,578 (44.4%) | 15,775 (55.6%) |
| Office & Administration | 7,381 (22.5%) | 25,486 (77.5%) |
| Total (Category) | 19,959 (32.6%) | 41,261 (67.4%) |
| Total (Overall) | 146,081 (51.4%) | 137,855 (48.5%) |
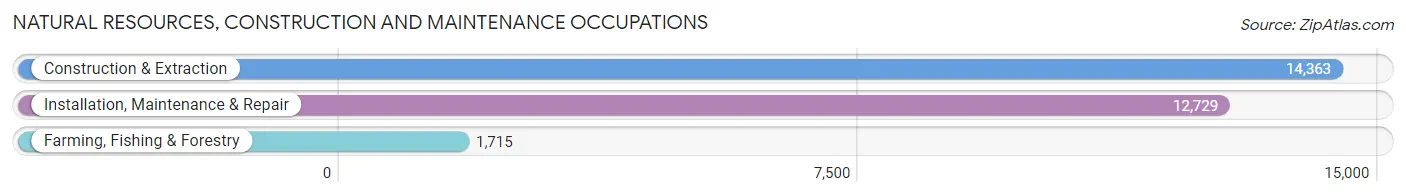
Natural Resources, Construction and Maintenance Occupations
The most common Natural Resources, Construction and Maintenance occupations in Area Code 478 are Construction & Extraction (14,363 | 5.1%), Installation, Maintenance & Repair (12,729 | 4.5%), and Farming, Fishing & Forestry (1,715 | 0.6%).
Natural Resources, Construction and Maintenance Occupations by Sex
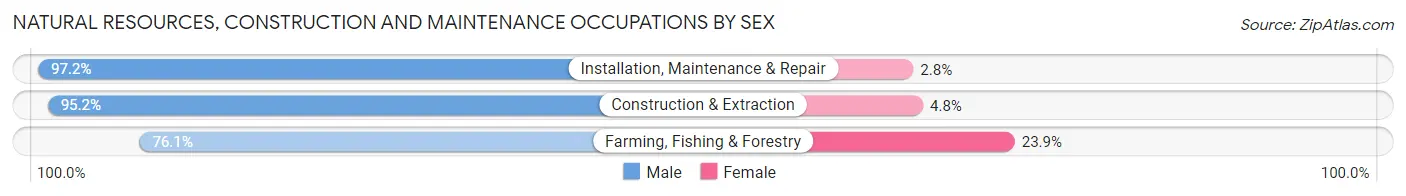
| Occupation | Male | Female |
| Farming, Fishing & Forestry | 1,305 (76.1%) | 410 (23.9%) |
| Construction & Extraction | 13,671 (95.2%) | 692 (4.8%) |
| Installation, Maintenance & Repair | 12,372 (97.2%) | 357 (2.8%) |
| Total (Category) | 27,348 (94.9%) | 1,459 (5.1%) |
| Total (Overall) | 146,081 (51.4%) | 137,855 (48.5%) |
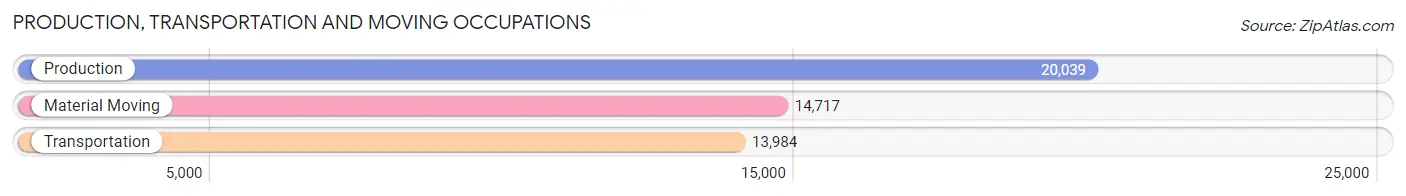
Production, Transportation and Moving Occupations
The most common Production, Transportation and Moving occupations in Area Code 478 are Production (20,039 | 7.1%), Material Moving (14,717 | 5.2%), and Transportation (13,984 | 4.9%).
Production, Transportation and Moving Occupations by Sex
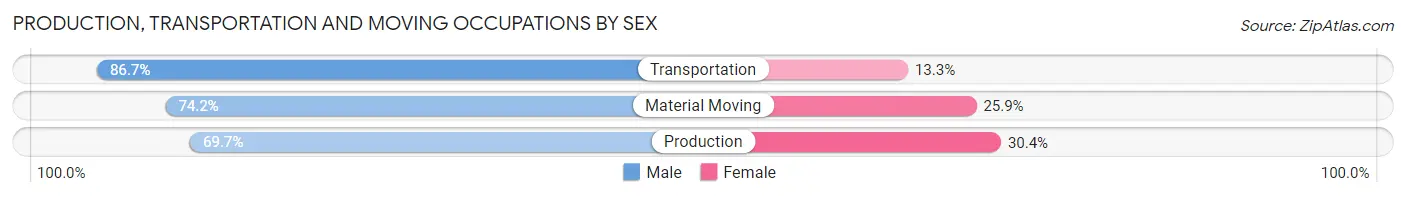
| Occupation | Male | Female |
| Production | 13,958 (69.7%) | 6,081 (30.3%) |
| Transportation | 12,126 (86.7%) | 1,858 (13.3%) |
| Material Moving | 10,913 (74.2%) | 3,804 (25.9%) |
| Total (Category) | 36,997 (75.9%) | 11,743 (24.1%) |
| Total (Overall) | 146,081 (51.4%) | 137,855 (48.5%) |
Employment Industries by Sex in Area Code 478
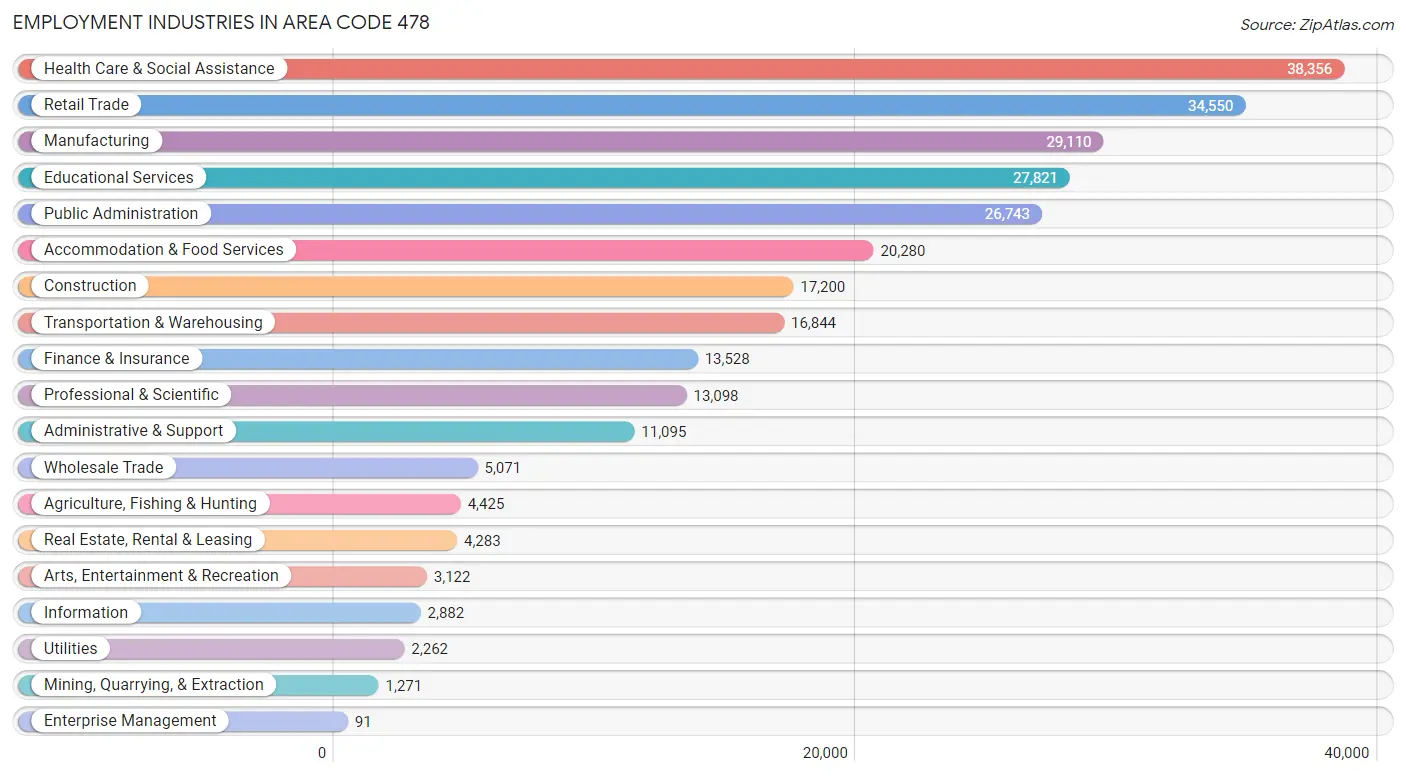
Employment Industries in Area Code 478
The major employment industries in Area Code 478 include Health Care & Social Assistance (38,356 | 13.5%), Retail Trade (34,550 | 12.2%), Manufacturing (29,110 | 10.2%), Educational Services (27,821 | 9.8%), and Public Administration (26,743 | 9.4%).
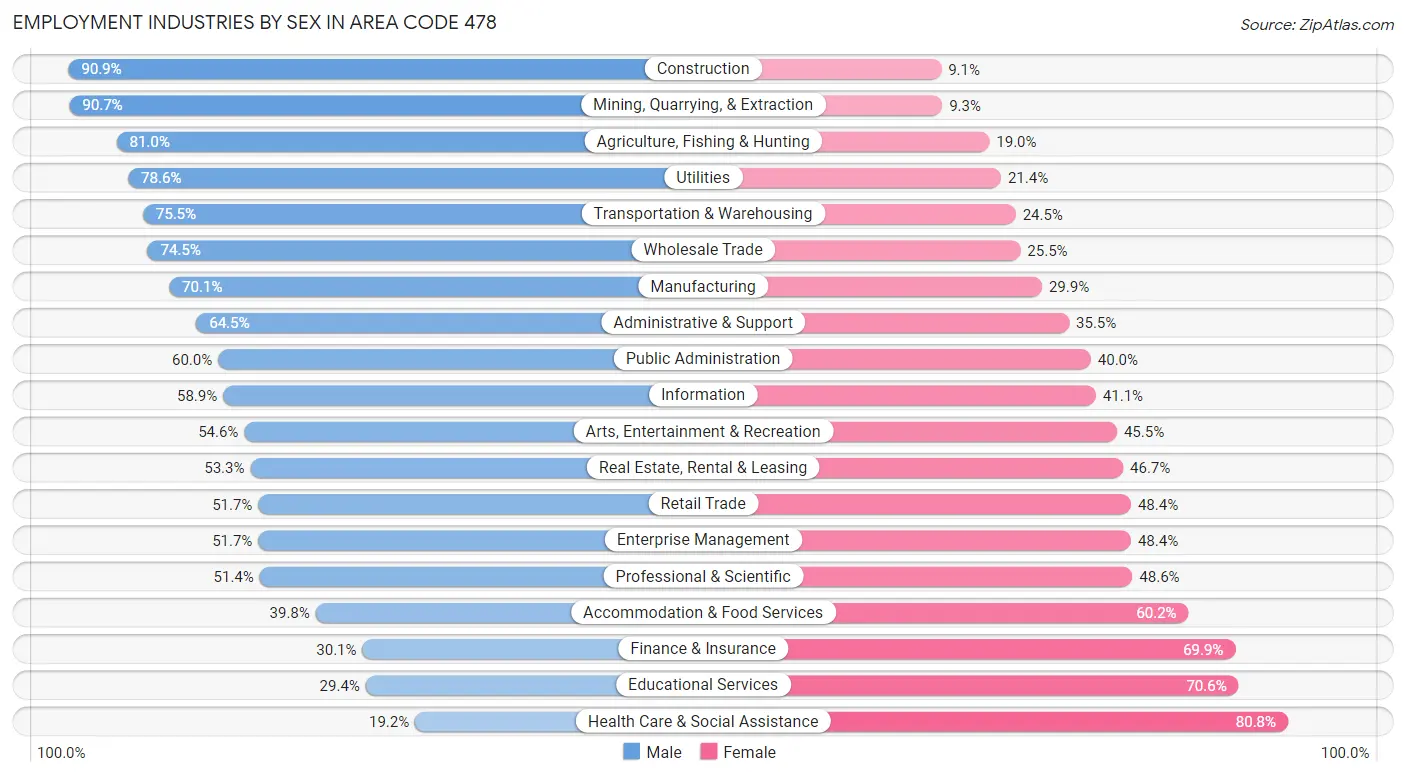
Employment Industries by Sex in Area Code 478
The Area Code 478 industries that see more men than women are Construction (90.9%), Mining, Quarrying, & Extraction (90.7%), and Agriculture, Fishing & Hunting (81.0%), whereas the industries that tend to have a higher number of women are Health Care & Social Assistance (80.8%), Educational Services (70.6%), and Finance & Insurance (69.9%).
| Industry | Male | Female |
| Agriculture, Fishing & Hunting | 3,583 (81.0%) | 842 (19.0%) |
| Mining, Quarrying, & Extraction | 1,153 (90.7%) | 118 (9.3%) |
| Construction | 15,640 (90.9%) | 1,560 (9.1%) |
| Manufacturing | 20,400 (70.1%) | 8,710 (29.9%) |
| Wholesale Trade | 3,780 (74.5%) | 1,291 (25.5%) |
| Retail Trade | 17,844 (51.6%) | 16,706 (48.3%) |
| Transportation & Warehousing | 12,721 (75.5%) | 4,123 (24.5%) |
| Utilities | 1,777 (78.6%) | 485 (21.4%) |
| Information | 1,698 (58.9%) | 1,184 (41.1%) |
| Finance & Insurance | 4,071 (30.1%) | 9,457 (69.9%) |
| Real Estate, Rental & Leasing | 2,282 (53.3%) | 2,001 (46.7%) |
| Professional & Scientific | 6,727 (51.4%) | 6,371 (48.6%) |
| Enterprise Management | 47 (51.6%) | 44 (48.3%) |
| Administrative & Support | 7,152 (64.5%) | 3,943 (35.5%) |
| Educational Services | 8,181 (29.4%) | 19,640 (70.6%) |
| Health Care & Social Assistance | 7,362 (19.2%) | 30,994 (80.8%) |
| Arts, Entertainment & Recreation | 1,703 (54.5%) | 1,419 (45.5%) |
| Accommodation & Food Services | 8,065 (39.8%) | 12,215 (60.2%) |
| Public Administration | 16,035 (60.0%) | 10,708 (40.0%) |
| Total | 146,081 (51.4%) | 137,855 (48.5%) |
Education in Area Code 478
School Enrollment in Area Code 478
The most common levels of schooling among the 170,054 students in Area Code 478 are middle school (37,544 | 22.1%), college / undergraduate (37,101 | 21.8%), and high school (36,599 | 21.5%).
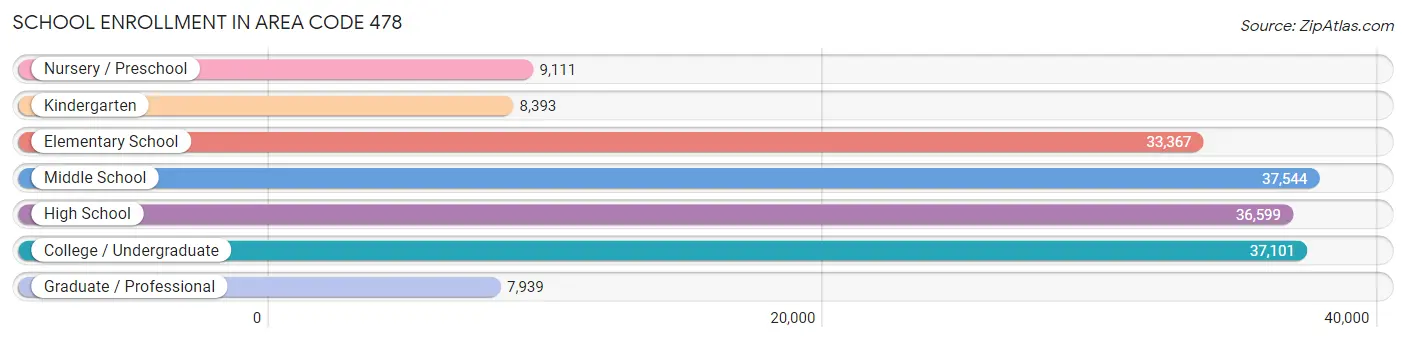
| School Level | # Students | % Students |
| Nursery / Preschool | 9,111 | 5.4% |
| Kindergarten | 8,393 | 4.9% |
| Elementary School | 33,367 | 19.6% |
| Middle School | 37,544 | 22.1% |
| High School | 36,599 | 21.5% |
| College / Undergraduate | 37,101 | 21.8% |
| Graduate / Professional | 7,939 | 4.7% |
| Total | 170,054 | 100.0% |
School Enrollment by Age by Funding Source in Area Code 478
Out of a total of 170,054 students who are enrolled in schools in Area Code 478, 26,485 (15.6%) attend a private institution, while the remaining 143,569 (84.4%) are enrolled in public schools. The age group of 35 years and over has the highest likelihood of being enrolled in private schools, with 2,715 (25.7% in the age bracket) enrolled. Conversely, the age group of 5 to 9 year old has the lowest likelihood of being enrolled in a private school, with 35,024 (89.4% in the age bracket) attending a public institution.
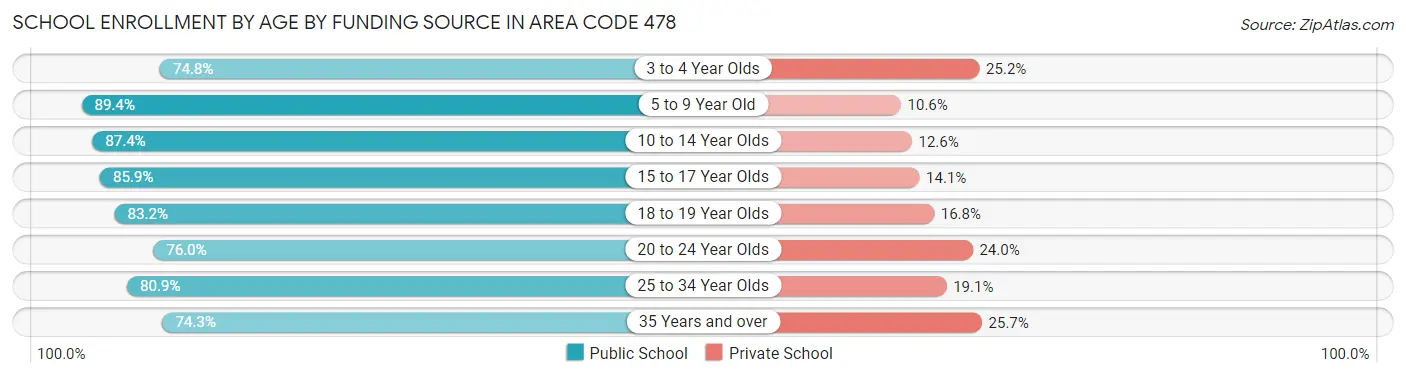
| Age Bracket | Public School | Private School |
| 3 to 4 Year Olds | 5,480 (74.8%) | 1,850 (25.2%) |
| 5 to 9 Year Old | 35,024 (89.4%) | 4,159 (10.6%) |
| 10 to 14 Year Olds | 40,184 (87.4%) | 5,814 (12.6%) |
| 15 to 17 Year Olds | 22,014 (85.9%) | 3,603 (14.1%) |
| 18 to 19 Year Olds | 12,180 (83.2%) | 2,456 (16.8%) |
| 20 to 24 Year Olds | 12,249 (76.0%) | 3,866 (24.0%) |
| 25 to 34 Year Olds | 8,581 (80.9%) | 2,026 (19.1%) |
| 35 Years and over | 7,853 (74.3%) | 2,715 (25.7%) |
| Total | 143,569 (84.4%) | 26,485 (15.6%) |
Educational Attainment by Field of Study in Area Code 478
Business (22,898 | 20.3%), education (18,436 | 16.3%), science & technology (11,737 | 10.4%), arts & humanities (8,843 | 7.8%), and bio, nature & agricultural (7,226 | 6.4%) are the most common fields of study among 112,942 individuals in Area Code 478 who have obtained a bachelor's degree or higher.
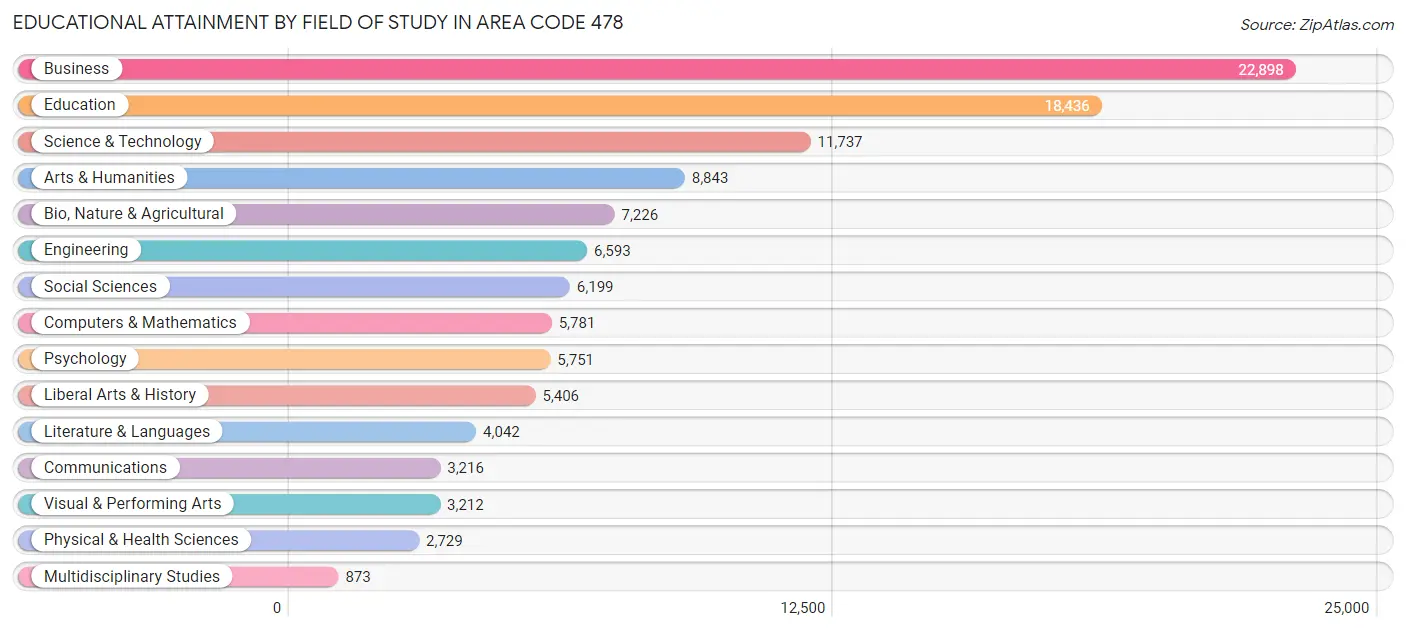
| Field of Study | # Graduates | % Graduates |
| Computers & Mathematics | 5,781 | 5.1% |
| Bio, Nature & Agricultural | 7,226 | 6.4% |
| Physical & Health Sciences | 2,729 | 2.4% |
| Psychology | 5,751 | 5.1% |
| Social Sciences | 6,199 | 5.5% |
| Engineering | 6,593 | 5.8% |
| Multidisciplinary Studies | 873 | 0.8% |
| Science & Technology | 11,737 | 10.4% |
| Business | 22,898 | 20.3% |
| Education | 18,436 | 16.3% |
| Literature & Languages | 4,042 | 3.6% |
| Liberal Arts & History | 5,406 | 4.8% |
| Visual & Performing Arts | 3,212 | 2.8% |
| Communications | 3,216 | 2.9% |
| Arts & Humanities | 8,843 | 7.8% |
| Total | 112,942 | 100.0% |
Transportation & Commute in Area Code 478
Vehicle Availability by Sex in Area Code 478
The most prevalent vehicle ownership categories in Area Code 478 are males with 2 vehicles (57,961, accounting for 39.8%) and females with 2 vehicles (48,709, making up 43.1%).
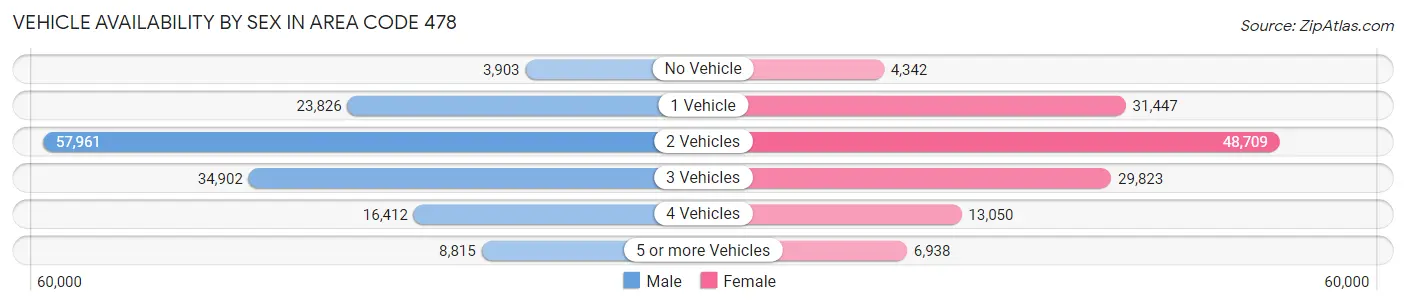
| Vehicles Available | Male | Female |
| No Vehicle | 3,903 (2.7%) | 4,342 (3.2%) |
| 1 Vehicle | 23,826 (16.3%) | 31,447 (23.4%) |
| 2 Vehicles | 57,961 (39.8%) | 48,709 (36.3%) |
| 3 Vehicles | 34,902 (23.9%) | 29,823 (22.2%) |
| 4 Vehicles | 16,412 (11.3%) | 13,050 (9.7%) |
| 5 or more Vehicles | 8,815 (6.0%) | 6,938 (5.2%) |
| Total | 145,819 (100.0%) | 134,309 (100.0%) |
Commute Time in Area Code 478
The most frequently occuring commute durations in Area Code 478 are 15 to 19 minutes (45,233 commuters, 17.1%), 10 to 14 minutes (43,314 commuters, 16.3%), and 20 to 24 minutes (41,140 commuters, 15.5%).
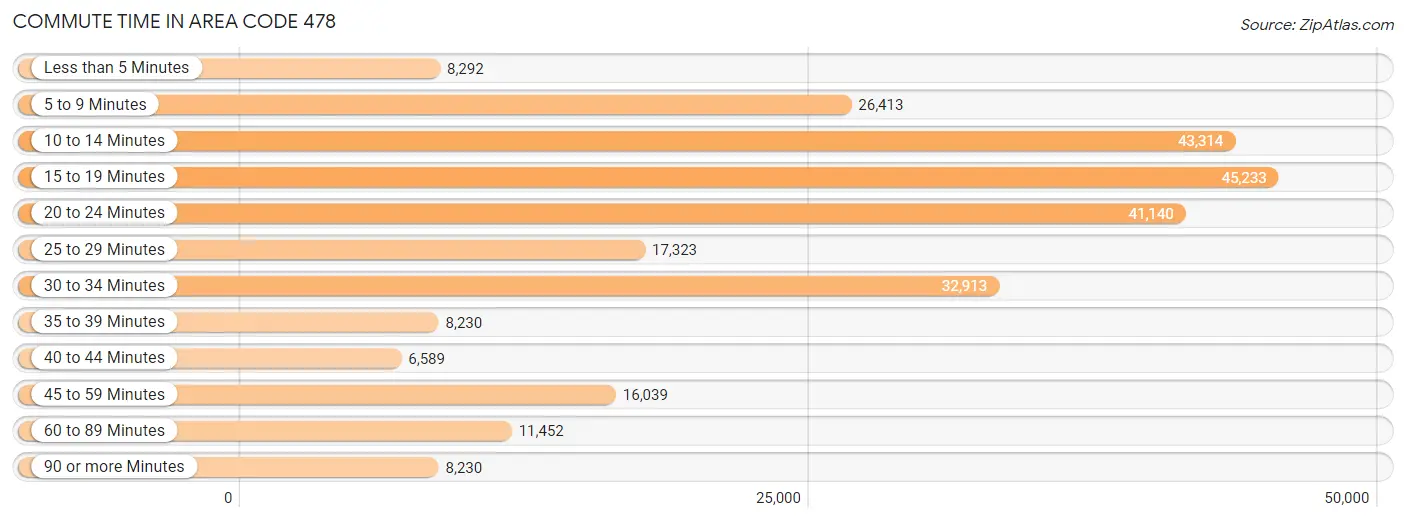
| Commute Time | # Commuters | % Commuters |
| Less than 5 Minutes | 8,292 | 3.1% |
| 5 to 9 Minutes | 26,413 | 10.0% |
| 10 to 14 Minutes | 43,314 | 16.3% |
| 15 to 19 Minutes | 45,233 | 17.1% |
| 20 to 24 Minutes | 41,140 | 15.5% |
| 25 to 29 Minutes | 17,323 | 6.5% |
| 30 to 34 Minutes | 32,913 | 12.4% |
| 35 to 39 Minutes | 8,230 | 3.1% |
| 40 to 44 Minutes | 6,589 | 2.5% |
| 45 to 59 Minutes | 16,039 | 6.0% |
| 60 to 89 Minutes | 11,452 | 4.3% |
| 90 or more Minutes | 8,230 | 3.1% |
Commute Time by Sex in Area Code 478
The most common commute times in Area Code 478 are 15 to 19 minutes (22,241 commuters, 15.9%) for males and 15 to 19 minutes (22,992 commuters, 18.3%) for females.
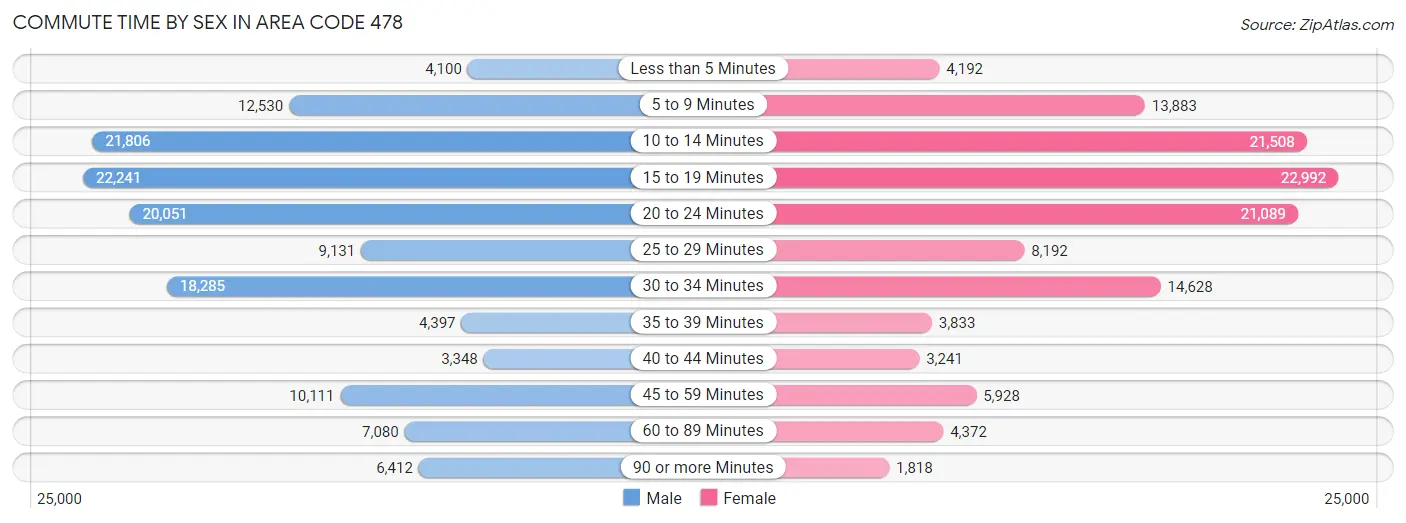
| Commute Time | Male | Female |
| Less than 5 Minutes | 4,100 (2.9%) | 4,192 (3.3%) |
| 5 to 9 Minutes | 12,530 (9.0%) | 13,883 (11.1%) |
| 10 to 14 Minutes | 21,806 (15.6%) | 21,508 (17.1%) |
| 15 to 19 Minutes | 22,241 (15.9%) | 22,992 (18.3%) |
| 20 to 24 Minutes | 20,051 (14.4%) | 21,089 (16.8%) |
| 25 to 29 Minutes | 9,131 (6.6%) | 8,192 (6.5%) |
| 30 to 34 Minutes | 18,285 (13.1%) | 14,628 (11.6%) |
| 35 to 39 Minutes | 4,397 (3.2%) | 3,833 (3.0%) |
| 40 to 44 Minutes | 3,348 (2.4%) | 3,241 (2.6%) |
| 45 to 59 Minutes | 10,111 (7.2%) | 5,928 (4.7%) |
| 60 to 89 Minutes | 7,080 (5.1%) | 4,372 (3.5%) |
| 90 or more Minutes | 6,412 (4.6%) | 1,818 (1.5%) |
Time of Departure to Work by Sex in Area Code 478
The most frequent times of departure to work in Area Code 478 are 7:00 AM to 7:29 AM (21,388, 15.3%) for males and 7:00 AM to 7:29 AM (19,832, 15.8%) for females.
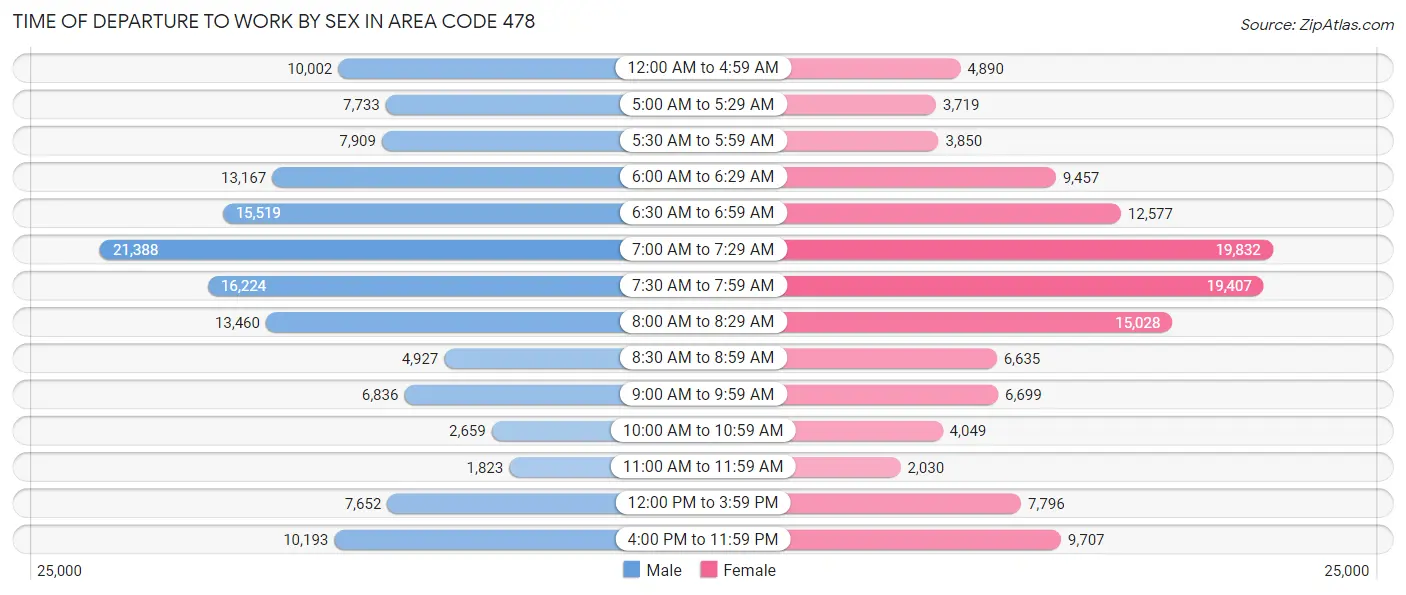
| Time of Departure | Male | Female |
| 12:00 AM to 4:59 AM | 10,002 (7.2%) | 4,890 (3.9%) |
| 5:00 AM to 5:29 AM | 7,733 (5.5%) | 3,719 (3.0%) |
| 5:30 AM to 5:59 AM | 7,909 (5.7%) | 3,850 (3.1%) |
| 6:00 AM to 6:29 AM | 13,167 (9.4%) | 9,457 (7.5%) |
| 6:30 AM to 6:59 AM | 15,519 (11.1%) | 12,577 (10.0%) |
| 7:00 AM to 7:29 AM | 21,388 (15.3%) | 19,832 (15.8%) |
| 7:30 AM to 7:59 AM | 16,224 (11.6%) | 19,407 (15.4%) |
| 8:00 AM to 8:29 AM | 13,460 (9.7%) | 15,028 (12.0%) |
| 8:30 AM to 8:59 AM | 4,927 (3.5%) | 6,635 (5.3%) |
| 9:00 AM to 9:59 AM | 6,836 (4.9%) | 6,699 (5.3%) |
| 10:00 AM to 10:59 AM | 2,659 (1.9%) | 4,049 (3.2%) |
| 11:00 AM to 11:59 AM | 1,823 (1.3%) | 2,030 (1.6%) |
| 12:00 PM to 3:59 PM | 7,652 (5.5%) | 7,796 (6.2%) |
| 4:00 PM to 11:59 PM | 10,193 (7.3%) | 9,707 (7.7%) |
| Total | 139,492 (100.0%) | 125,676 (100.0%) |
Housing Occupancy in Area Code 478
Occupancy by Ownership in Area Code 478
Of the total 251,645 dwellings in Area Code 478, owner-occupied units account for 164,918 (65.5%), while renter-occupied units make up 86,727 (34.5%).
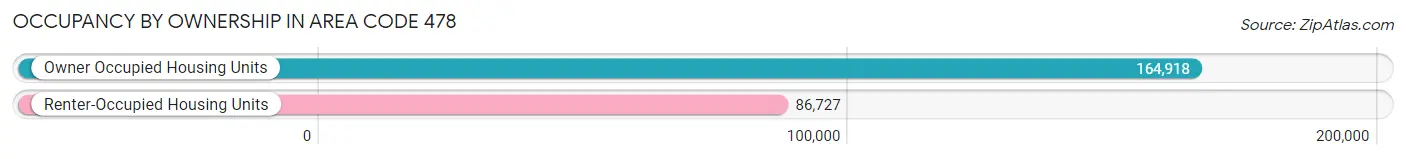
| Occupancy | # Housing Units | % Housing Units |
| Owner Occupied Housing Units | 164,918 | 65.5% |
| Renter-Occupied Housing Units | 86,727 | 34.5% |
| Total Occupied Housing Units | 251,645 | 100.0% |
Occupancy by Household Size in Area Code 478
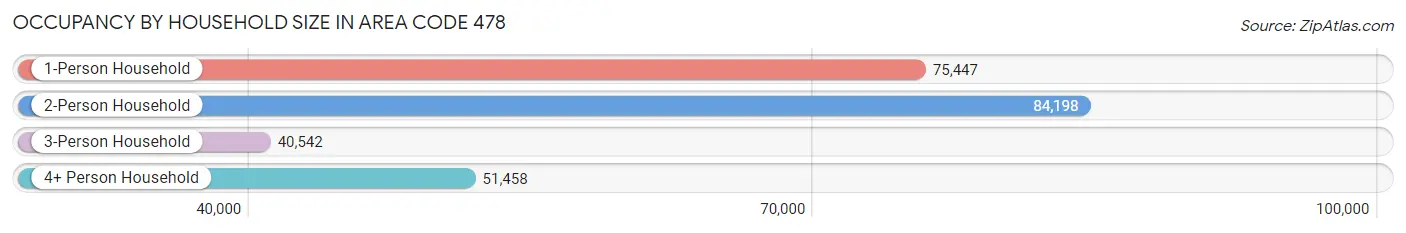
| Household Size | # Housing Units | % Housing Units |
| 1-Person Household | 75,447 | 30.0% |
| 2-Person Household | 84,198 | 33.5% |
| 3-Person Household | 40,542 | 16.1% |
| 4+ Person Household | 51,458 | 20.4% |
| Total Housing Units | 251,645 | 100.0% |
Occupancy by Ownership by Household Size in Area Code 478
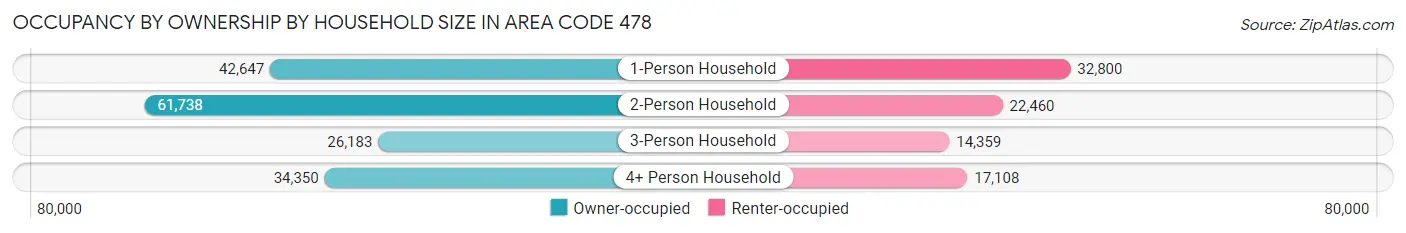
| Household Size | Owner-occupied | Renter-occupied |
| 1-Person Household | 42,647 (56.5%) | 32,800 (43.5%) |
| 2-Person Household | 61,738 (73.3%) | 22,460 (26.7%) |
| 3-Person Household | 26,183 (64.6%) | 14,359 (35.4%) |
| 4+ Person Household | 34,350 (66.7%) | 17,108 (33.3%) |
| Total Housing Units | 164,918 (65.5%) | 86,727 (34.5%) |
Occupancy by Educational Attainment in Area Code 478
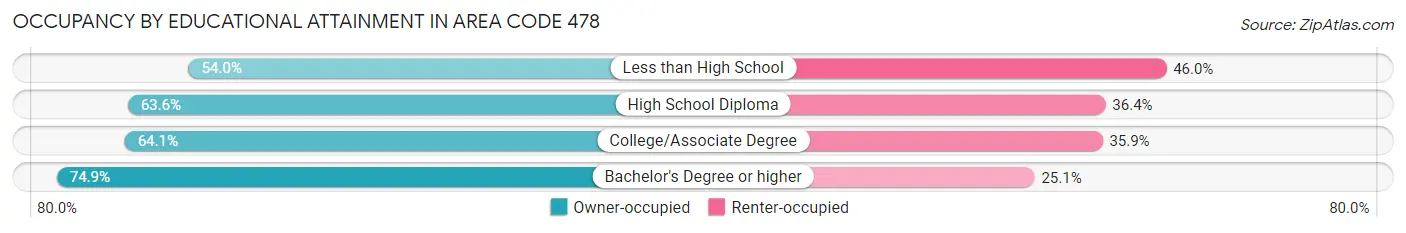
| Household Size | Owner-occupied | Renter-occupied |
| Less than High School | 15,486 (54.0%) | 13,192 (46.0%) |
| High School Diploma | 49,996 (63.6%) | 28,562 (36.4%) |
| College/Associate Degree | 51,808 (64.1%) | 29,001 (35.9%) |
| Bachelor's Degree or higher | 47,628 (74.9%) | 15,972 (25.1%) |
Occupancy by Age of Householder in Area Code 478
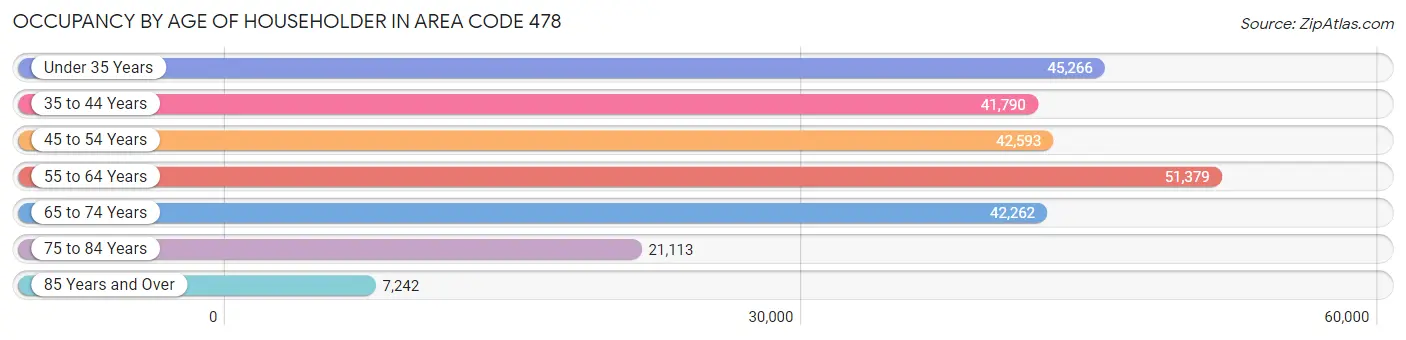
| Age Bracket | # Households | % Households |
| Under 35 Years | 45,266 | 18.0% |
| 35 to 44 Years | 41,790 | 16.6% |
| 45 to 54 Years | 42,593 | 16.9% |
| 55 to 64 Years | 51,379 | 20.4% |
| 65 to 74 Years | 42,262 | 16.8% |
| 75 to 84 Years | 21,113 | 8.4% |
| 85 Years and Over | 7,242 | 2.9% |
| Total | 251,645 | 100.0% |
Housing Finances in Area Code 478
Median Income by Occupancy in Area Code 478
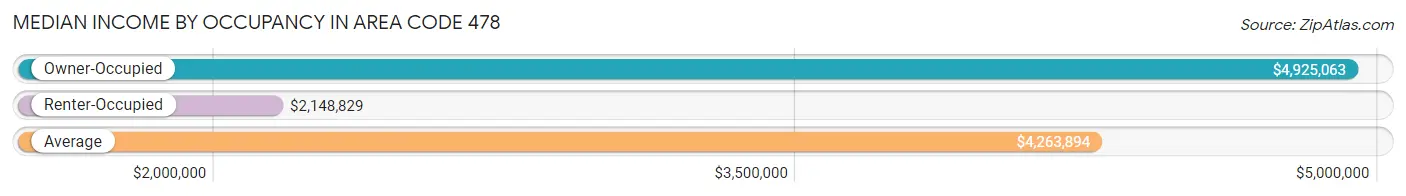
| Occupancy Type | # Households | Median Income |
| Owner-Occupied | 164,918 (65.5%) | $4,925,063 |
| Renter-Occupied | 86,727 (34.5%) | $2,148,829 |
| Average | 251,645 (100.0%) | $4,263,894 |
Occupancy by Householder Income Bracket in Area Code 478
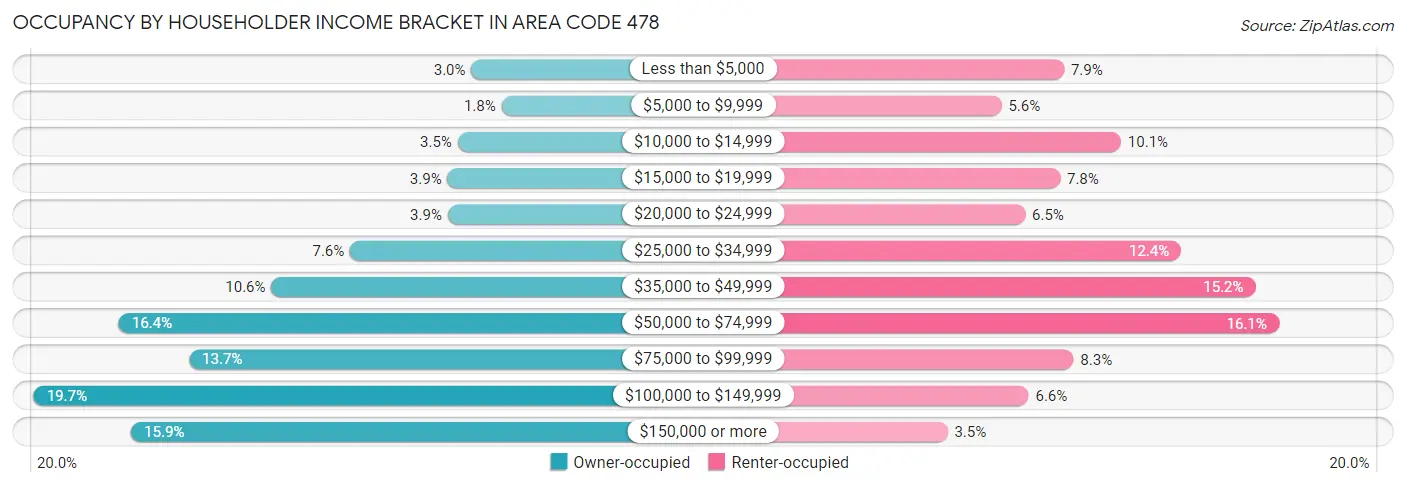
| Income Bracket | Owner-occupied | Renter-occupied |
| Less than $5,000 | 4,911 (3.0%) | 6,890 (7.9%) |
| $5,000 to $9,999 | 3,020 (1.8%) | 4,820 (5.6%) |
| $10,000 to $14,999 | 5,774 (3.5%) | 8,766 (10.1%) |
| $15,000 to $19,999 | 6,412 (3.9%) | 6,758 (7.8%) |
| $20,000 to $24,999 | 6,394 (3.9%) | 5,601 (6.5%) |
| $25,000 to $34,999 | 12,528 (7.6%) | 10,750 (12.4%) |
| $35,000 to $49,999 | 17,480 (10.6%) | 13,206 (15.2%) |
| $50,000 to $74,999 | 27,068 (16.4%) | 13,984 (16.1%) |
| $75,000 to $99,999 | 22,635 (13.7%) | 7,202 (8.3%) |
| $100,000 to $149,999 | 32,404 (19.7%) | 5,717 (6.6%) |
| $150,000 or more | 26,292 (15.9%) | 3,033 (3.5%) |
| Total | 164,918 (100.0%) | 86,727 (100.0%) |
Monthly Housing Cost Tiers in Area Code 478
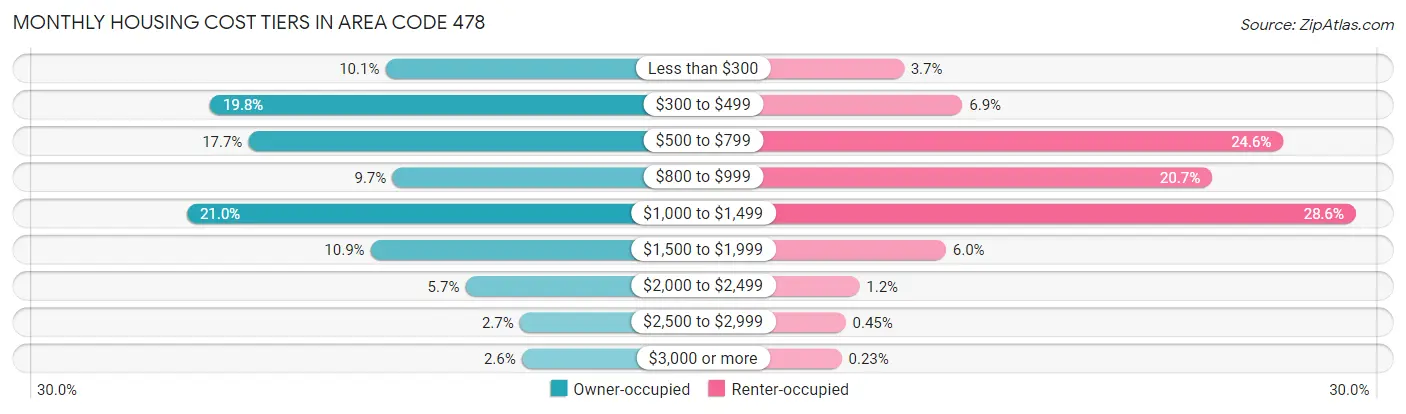
| Monthly Cost | Owner-occupied | Renter-occupied |
| Less than $300 | 16,625 (10.1%) | 3,170 (3.7%) |
| $300 to $499 | 32,587 (19.8%) | 5,985 (6.9%) |
| $500 to $799 | 29,104 (17.6%) | 21,353 (24.6%) |
| $800 to $999 | 15,992 (9.7%) | 17,940 (20.7%) |
| $1,000 to $1,499 | 34,680 (21.0%) | 24,826 (28.6%) |
| $1,500 to $1,999 | 17,982 (10.9%) | 5,193 (6.0%) |
| $2,000 to $2,499 | 9,340 (5.7%) | 1,047 (1.2%) |
| $2,500 to $2,999 | 4,395 (2.7%) | 387 (0.4%) |
| $3,000 or more | 4,213 (2.5%) | 198 (0.2%) |
| Total | 164,918 (100.0%) | 86,727 (100.0%) |
Physical Housing Characteristics in Area Code 478
Housing Structures in Area Code 478
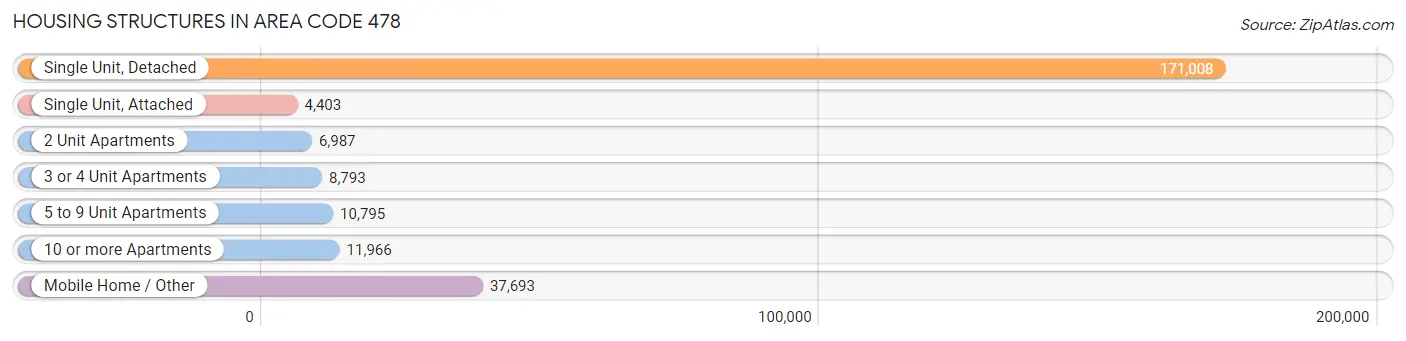
| Structure Type | # Housing Units | % Housing Units |
| Single Unit, Detached | 171,008 | 68.0% |
| Single Unit, Attached | 4,403 | 1.8% |
| 2 Unit Apartments | 6,987 | 2.8% |
| 3 or 4 Unit Apartments | 8,793 | 3.5% |
| 5 to 9 Unit Apartments | 10,795 | 4.3% |
| 10 or more Apartments | 11,966 | 4.8% |
| Mobile Home / Other | 37,693 | 15.0% |
| Total | 251,645 | 100.0% |
Housing Structures by Occupancy in Area Code 478
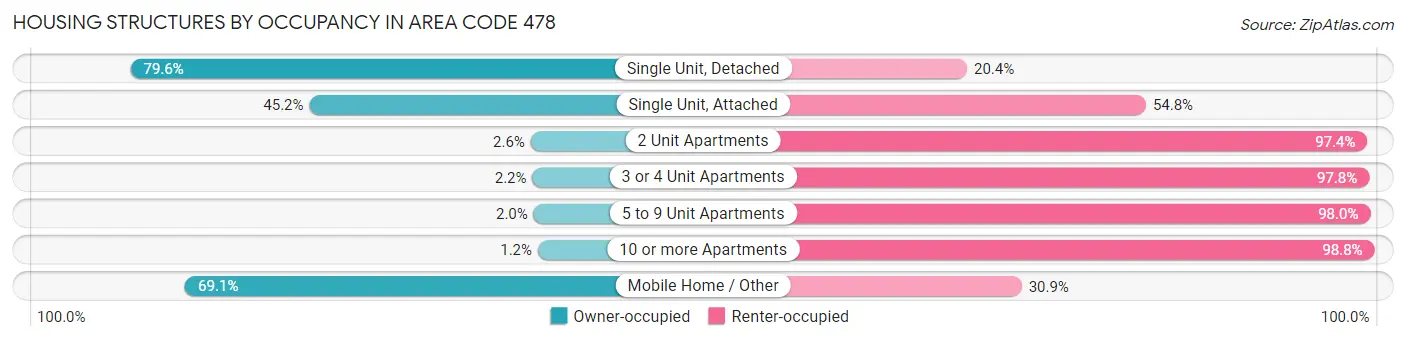
| Structure Type | Owner-occupied | Renter-occupied |
| Single Unit, Detached | 136,156 (79.6%) | 34,852 (20.4%) |
| Single Unit, Attached | 1,989 (45.2%) | 2,414 (54.8%) |
| 2 Unit Apartments | 179 (2.6%) | 6,808 (97.4%) |
| 3 or 4 Unit Apartments | 196 (2.2%) | 8,597 (97.8%) |
| 5 to 9 Unit Apartments | 215 (2.0%) | 10,580 (98.0%) |
| 10 or more Apartments | 141 (1.2%) | 11,825 (98.8%) |
| Mobile Home / Other | 26,042 (69.1%) | 11,651 (30.9%) |
| Total | 164,918 (65.5%) | 86,727 (34.5%) |
Housing Structures by Number of Rooms in Area Code 478
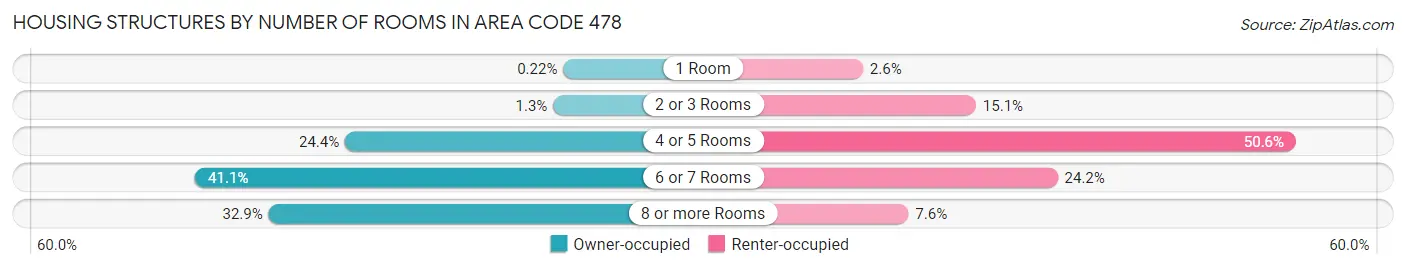
| Number of Rooms | Owner-occupied | Renter-occupied |
| 1 Room | 367 (0.2%) | 2,212 (2.5%) |
| 2 or 3 Rooms | 2,206 (1.3%) | 13,083 (15.1%) |
| 4 or 5 Rooms | 40,305 (24.4%) | 43,888 (50.6%) |
| 6 or 7 Rooms | 67,725 (41.1%) | 20,954 (24.2%) |
| 8 or more Rooms | 54,315 (32.9%) | 6,590 (7.6%) |
| Total | 164,918 (100.0%) | 86,727 (100.0%) |
Housing Structure by Heating Type in Area Code 478
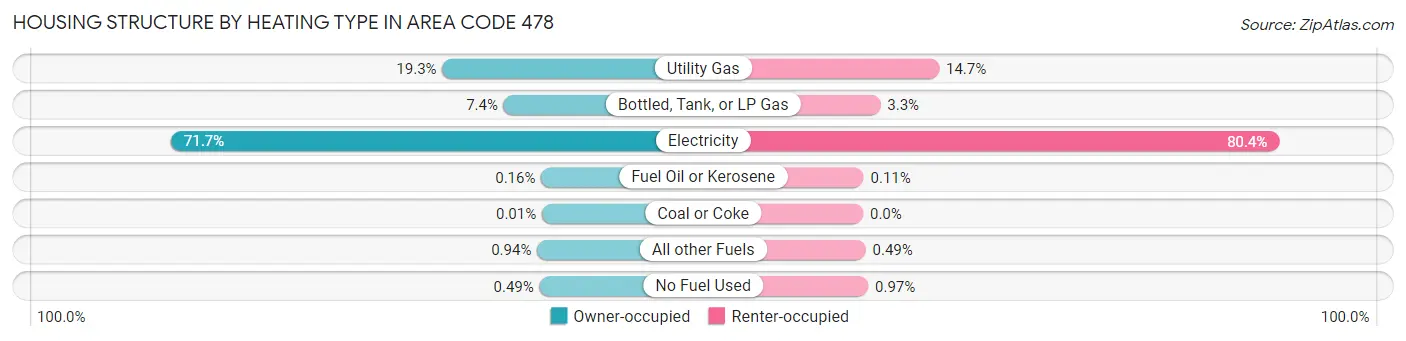
| Heating Type | Owner-occupied | Renter-occupied |
| Utility Gas | 31,768 (19.3%) | 12,735 (14.7%) |
| Bottled, Tank, or LP Gas | 12,206 (7.4%) | 2,894 (3.3%) |
| Electricity | 118,294 (71.7%) | 69,737 (80.4%) |
| Fuel Oil or Kerosene | 268 (0.2%) | 96 (0.1%) |
| Coal or Coke | 16 (0.0%) | 0 (0.0%) |
| All other Fuels | 1,558 (0.9%) | 427 (0.5%) |
| No Fuel Used | 808 (0.5%) | 838 (1.0%) |
| Total | 164,918 (100.0%) | 86,727 (100.0%) |
Household Vehicle Usage in Area Code 478
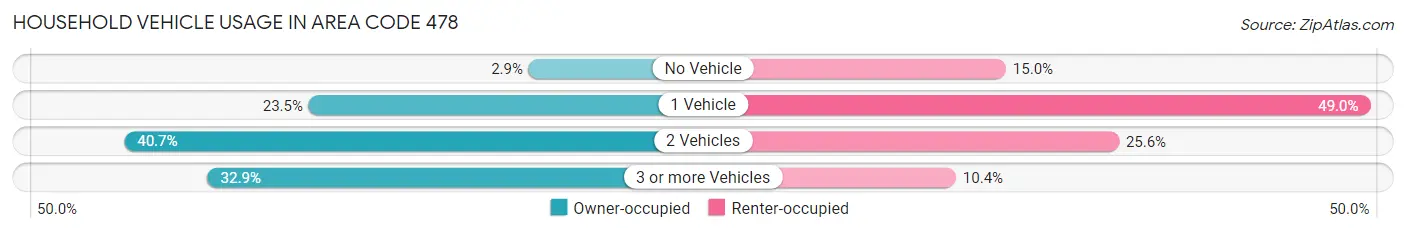
| Vehicles per Household | Owner-occupied | Renter-occupied |
| No Vehicle | 4,832 (2.9%) | 13,033 (15.0%) |
| 1 Vehicle | 38,708 (23.5%) | 42,527 (49.0%) |
| 2 Vehicles | 67,107 (40.7%) | 22,185 (25.6%) |
| 3 or more Vehicles | 54,271 (32.9%) | 8,982 (10.4%) |
| Total | 164,918 (100.0%) | 86,727 (100.0%) |
Real Estate & Mortgages in Area Code 478
Real Estate and Mortgage Overview in Area Code 478
| Characteristic | Without Mortgage | With Mortgage |
| Housing Units | 77,813 | 87,105 |
| Median Property Value | $7,809,300 | $10,311,400 |
| Median Household Income | $3,781,404 | $18,424 |
| Monthly Housing Costs | $33,005 | $4,061 |
| Real Estate Taxes | $72,849 | $3,028 |
Property Value by Mortgage Status in Area Code 478
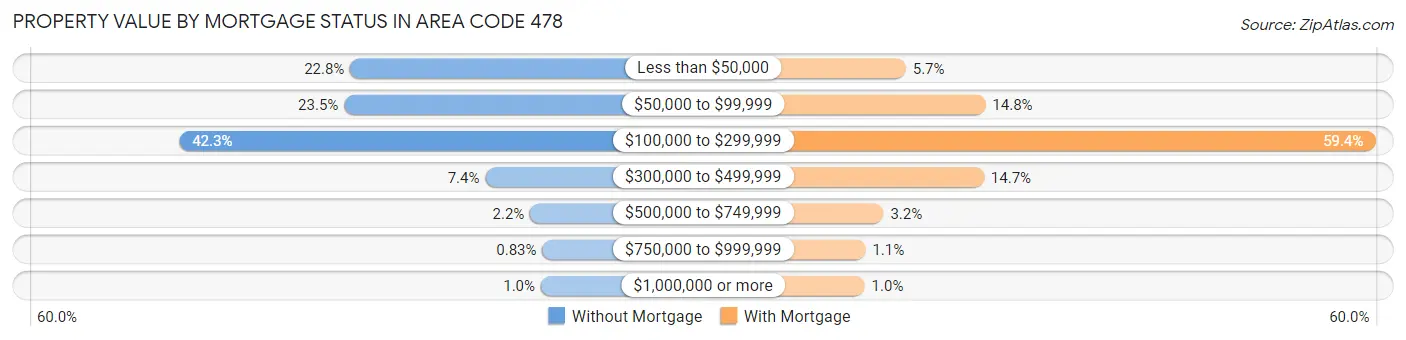
| Property Value | Without Mortgage | With Mortgage |
| Less than $50,000 | 17,734 (22.8%) | 5,004 (5.7%) |
| $50,000 to $99,999 | 18,271 (23.5%) | 12,923 (14.8%) |
| $100,000 to $299,999 | 32,942 (42.3%) | 51,732 (59.4%) |
| $300,000 to $499,999 | 5,717 (7.3%) | 12,776 (14.7%) |
| $500,000 to $749,999 | 1,724 (2.2%) | 2,782 (3.2%) |
| $750,000 to $999,999 | 645 (0.8%) | 983 (1.1%) |
| $1,000,000 or more | 780 (1.0%) | 905 (1.0%) |
| Total | 77,813 (100.0%) | 87,105 (100.0%) |
Household Income by Mortgage Status in Area Code 478
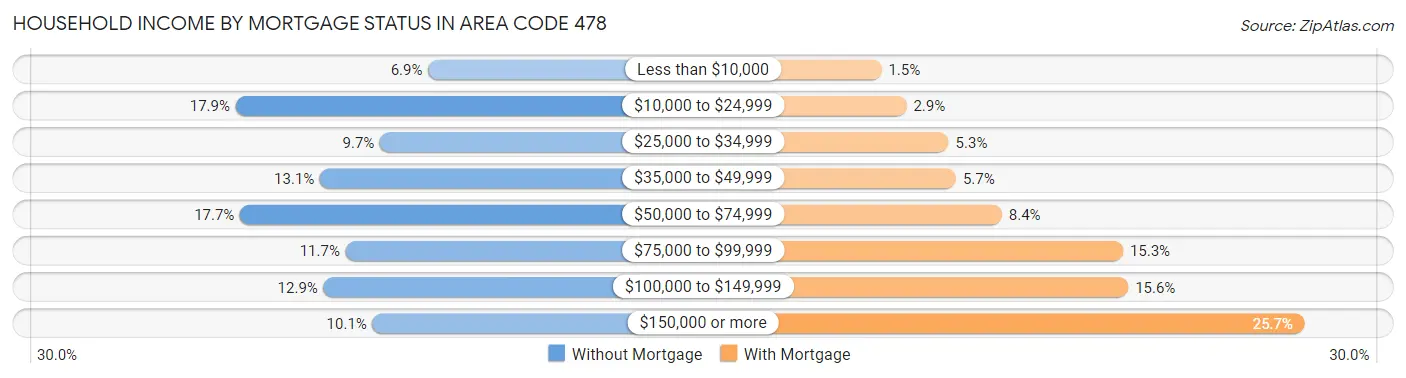
| Household Income | Without Mortgage | With Mortgage |
| Less than $10,000 | 5,395 (6.9%) | 1,289 (1.5%) |
| $10,000 to $24,999 | 13,948 (17.9%) | 2,536 (2.9%) |
| $25,000 to $34,999 | 7,532 (9.7%) | 4,632 (5.3%) |
| $35,000 to $49,999 | 10,198 (13.1%) | 4,996 (5.7%) |
| $50,000 to $74,999 | 13,760 (17.7%) | 7,282 (8.4%) |
| $75,000 to $99,999 | 9,064 (11.7%) | 13,308 (15.3%) |
| $100,000 to $149,999 | 10,048 (12.9%) | 13,571 (15.6%) |
| $150,000 or more | 7,868 (10.1%) | 22,356 (25.7%) |
| Total | 77,813 (100.0%) | 87,105 (100.0%) |
Property Value to Household Income Ratio in Area Code 478
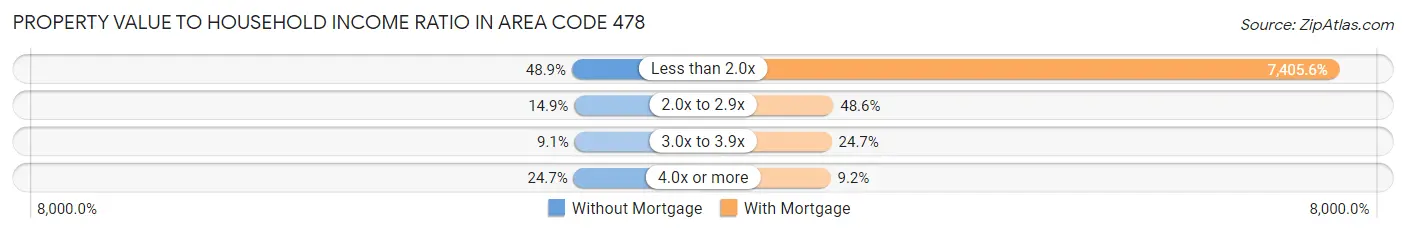
| Value-to-Income Ratio | Without Mortgage | With Mortgage |
| Less than 2.0x | 38,016 (48.9%) | 6,450,667 (7,405.6%) |
| 2.0x to 2.9x | 11,596 (14.9%) | 42,343 (48.6%) |
| 3.0x to 3.9x | 7,103 (9.1%) | 21,529 (24.7%) |
| 4.0x or more | 19,190 (24.7%) | 7,973 (9.1%) |
| Total | 77,813 (100.0%) | 87,105 (100.0%) |
Real Estate Taxes by Mortgage Status in Area Code 478
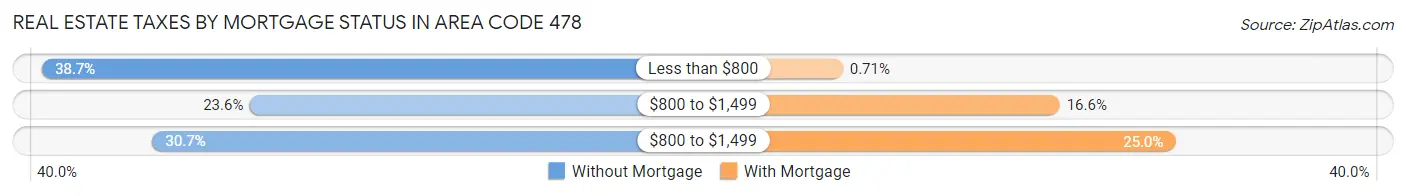
| Property Taxes | Without Mortgage | With Mortgage |
| Less than $800 | 30,135 (38.7%) | 619 (0.7%) |
| $800 to $1,499 | 18,357 (23.6%) | 14,421 (16.6%) |
| $800 to $1,499 | 23,858 (30.7%) | 21,775 (25.0%) |
| Total | 77,813 (100.0%) | 87,105 (100.0%) |
Health & Disability in Area Code 478
Health Insurance Coverage by Age in Area Code 478
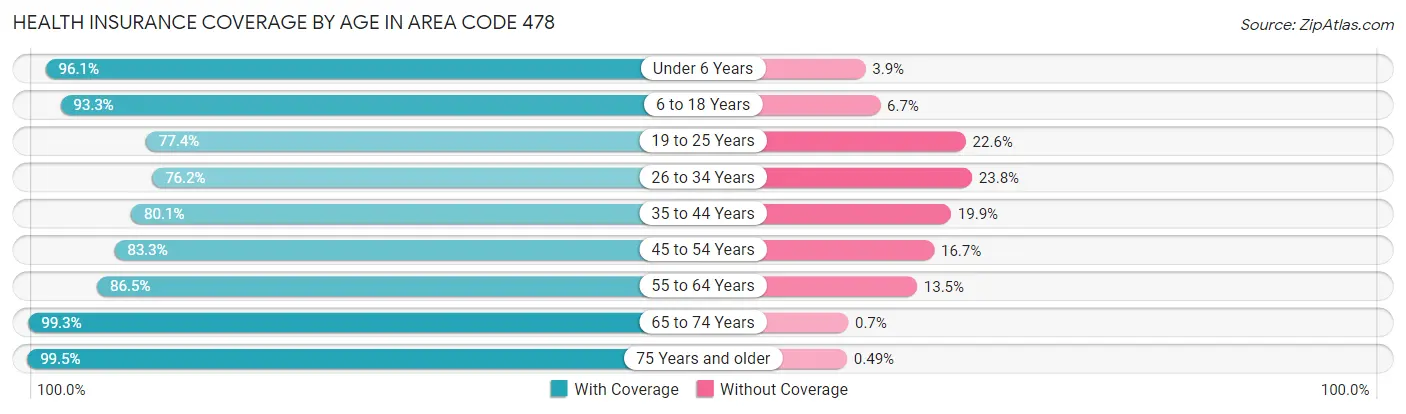
| Age Bracket | With Coverage | Without Coverage |
| Under 6 Years | 44,937 (96.1%) | 1,833 (3.9%) |
| 6 to 18 Years | 111,114 (93.3%) | 7,959 (6.7%) |
| 19 to 25 Years | 47,652 (77.4%) | 13,940 (22.6%) |
| 26 to 34 Years | 57,450 (76.2%) | 17,939 (23.8%) |
| 35 to 44 Years | 62,698 (80.1%) | 15,562 (19.9%) |
| 45 to 54 Years | 65,731 (83.3%) | 13,204 (16.7%) |
| 55 to 64 Years | 76,034 (86.5%) | 11,900 (13.5%) |
| 65 to 74 Years | 66,669 (99.3%) | 467 (0.7%) |
| 75 Years and older | 41,964 (99.5%) | 208 (0.5%) |
| Total | 574,249 (87.4%) | 83,012 (12.6%) |
Health Insurance Coverage by Citizenship Status in Area Code 478
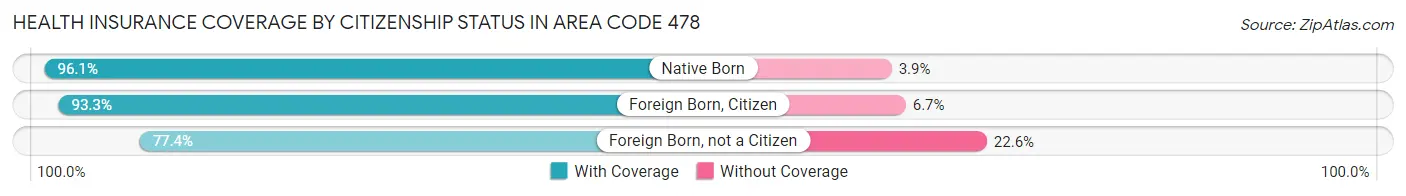
| Citizenship Status | With Coverage | Without Coverage |
| Native Born | 44,937 (96.1%) | 1,833 (3.9%) |
| Foreign Born, Citizen | 111,114 (93.3%) | 7,959 (6.7%) |
| Foreign Born, not a Citizen | 47,652 (77.4%) | 13,940 (22.6%) |
Health Insurance Coverage by Household Income in Area Code 478
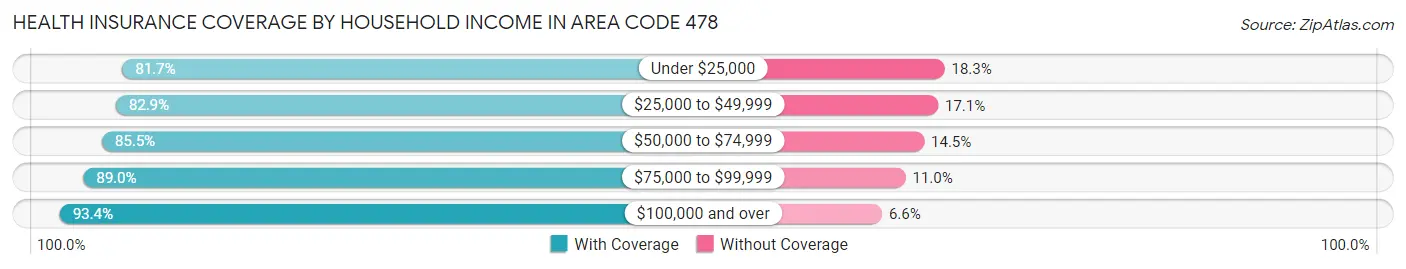
| Household Income | With Coverage | Without Coverage |
| Under $25,000 | 93,749 (81.7%) | 21,019 (18.3%) |
| $25,000 to $49,999 | 103,393 (82.9%) | 21,322 (17.1%) |
| $50,000 to $74,999 | 94,422 (85.5%) | 15,995 (14.5%) |
| $75,000 to $99,999 | 76,157 (89.0%) | 9,419 (11.0%) |
| $100,000 and over | 198,853 (93.4%) | 14,037 (6.6%) |
Public vs Private Health Insurance Coverage by Age in Area Code 478
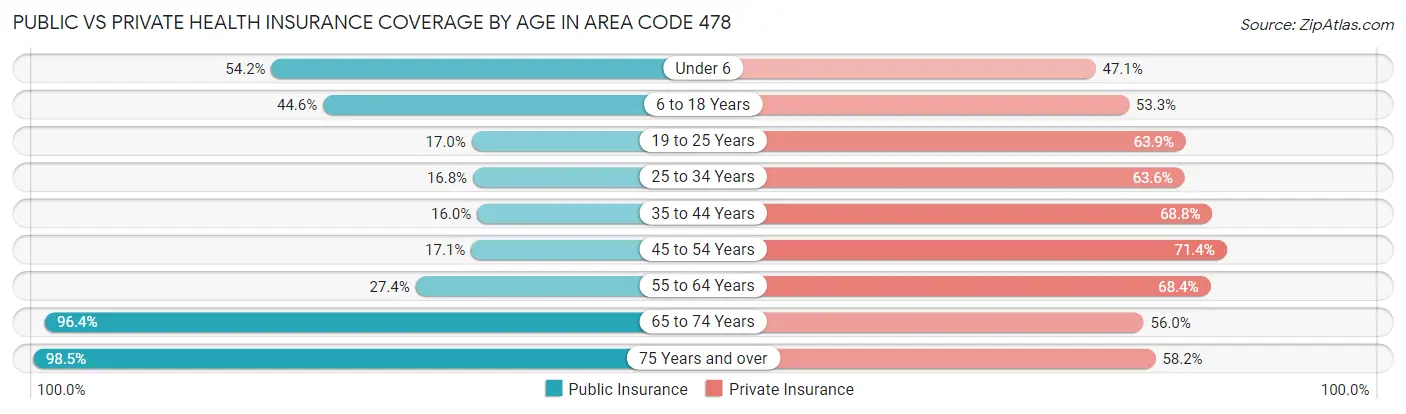
| Age Bracket | Public Insurance | Private Insurance |
| Under 6 | 25,347 (54.2%) | 22,028 (47.1%) |
| 6 to 18 Years | 53,123 (44.6%) | 63,453 (53.3%) |
| 19 to 25 Years | 10,489 (17.0%) | 39,332 (63.9%) |
| 25 to 34 Years | 12,651 (16.8%) | 47,980 (63.6%) |
| 35 to 44 Years | 12,534 (16.0%) | 53,806 (68.8%) |
| 45 to 54 Years | 13,508 (17.1%) | 56,368 (71.4%) |
| 55 to 64 Years | 24,117 (27.4%) | 60,158 (68.4%) |
| 65 to 74 Years | 64,696 (96.4%) | 37,607 (56.0%) |
| 75 Years and over | 41,524 (98.5%) | 24,552 (58.2%) |
| Total | 257,989 (39.3%) | 405,284 (61.7%) |
Disability Status by Sex by Age in Area Code 478
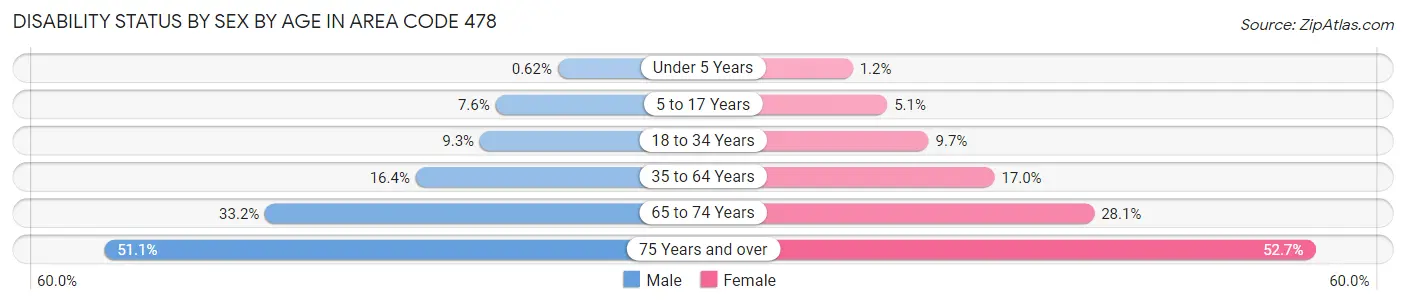
| Age Bracket | Male | Female |
| Under 5 Years | 125 (0.6%) | 239 (1.2%) |
| 5 to 17 Years | 4,482 (7.5%) | 2,848 (5.1%) |
| 18 to 34 Years | 6,713 (9.3%) | 7,279 (9.7%) |
| 35 to 64 Years | 19,248 (16.4%) | 21,774 (17.0%) |
| 65 to 74 Years | 10,333 (33.2%) | 10,124 (28.1%) |
| 75 Years and over | 8,385 (51.1%) | 13,586 (52.7%) |
Disability Class by Sex by Age in Area Code 478
Disability Class: Hearing Difficulty
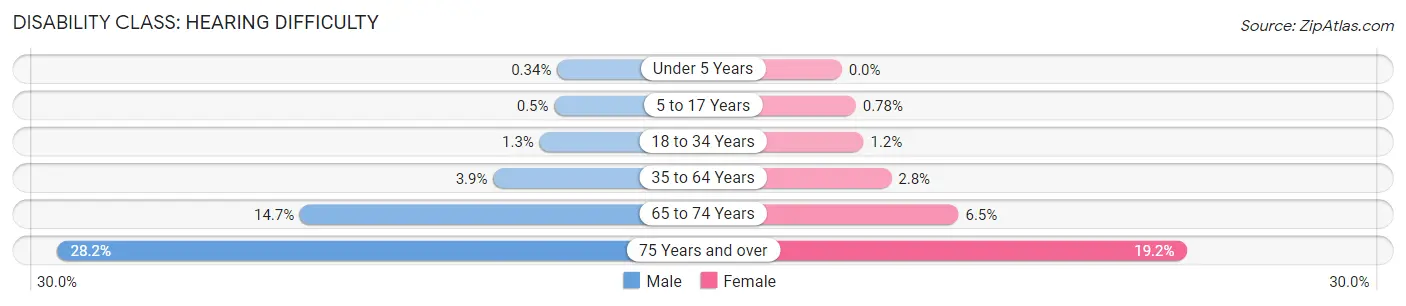
| Age Bracket | Male | Female |
| Under 5 Years | 68 (0.3%) | 0 (0.0%) |
| 5 to 17 Years | 294 (0.5%) | 442 (0.8%) |
| 18 to 34 Years | 955 (1.3%) | 912 (1.2%) |
| 35 to 64 Years | 4,563 (3.9%) | 3,532 (2.8%) |
| 65 to 74 Years | 4,562 (14.7%) | 2,342 (6.5%) |
| 75 Years and over | 4,618 (28.2%) | 4,943 (19.2%) |
Disability Class: Vision Difficulty
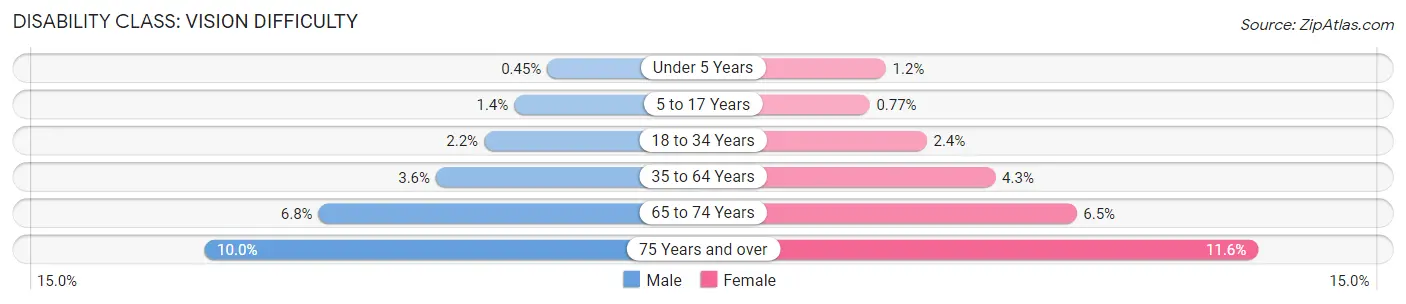
| Age Bracket | Male | Female |
| Under 5 Years | 91 (0.4%) | 239 (1.2%) |
| 5 to 17 Years | 815 (1.4%) | 433 (0.8%) |
| 18 to 34 Years | 1,595 (2.2%) | 1,775 (2.4%) |
| 35 to 64 Years | 4,157 (3.5%) | 5,465 (4.3%) |
| 65 to 74 Years | 2,122 (6.8%) | 2,352 (6.5%) |
| 75 Years and over | 1,640 (10.0%) | 2,987 (11.6%) |
Disability Class: Cognitive Difficulty
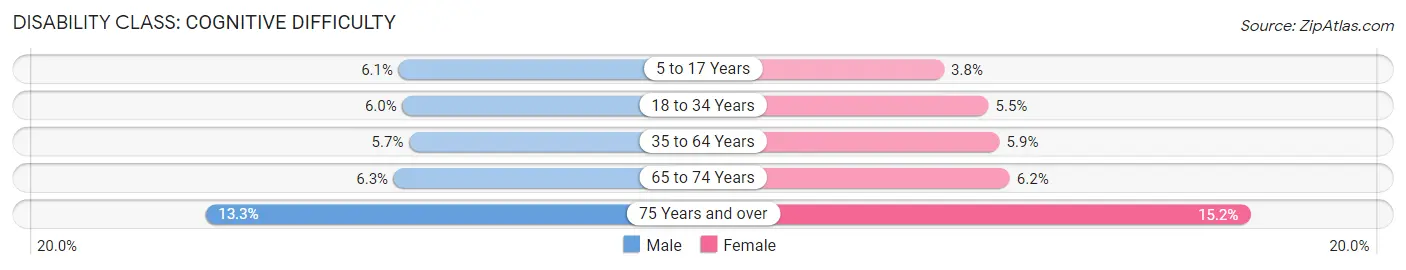
| Age Bracket | Male | Female |
| 5 to 17 Years | 3,627 (6.1%) | 2,140 (3.8%) |
| 18 to 34 Years | 4,313 (6.0%) | 4,101 (5.4%) |
| 35 to 64 Years | 6,697 (5.7%) | 7,506 (5.9%) |
| 65 to 74 Years | 1,957 (6.3%) | 2,249 (6.2%) |
| 75 Years and over | 2,180 (13.3%) | 3,906 (15.2%) |
Disability Class: Ambulatory Difficulty
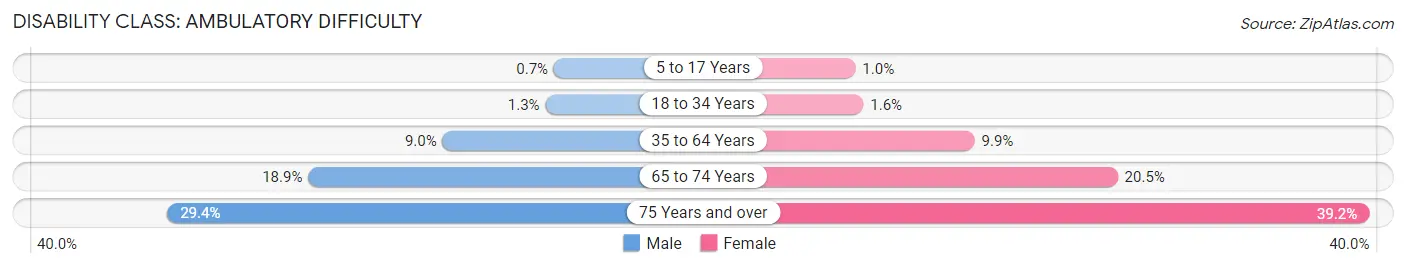
| Age Bracket | Male | Female |
| 5 to 17 Years | 417 (0.7%) | 571 (1.0%) |
| 18 to 34 Years | 959 (1.3%) | 1,201 (1.6%) |
| 35 to 64 Years | 10,506 (9.0%) | 12,628 (9.9%) |
| 65 to 74 Years | 5,893 (18.9%) | 7,379 (20.5%) |
| 75 Years and over | 4,824 (29.4%) | 10,091 (39.2%) |
Disability Class: Self-Care Difficulty
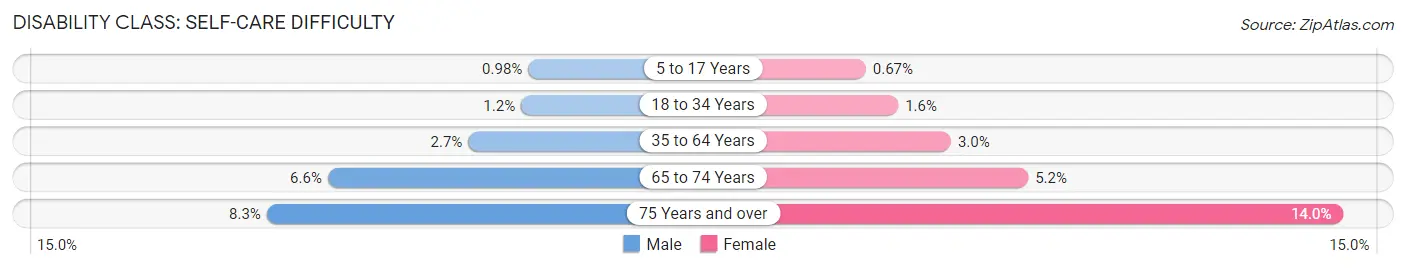
| Age Bracket | Male | Female |
| 5 to 17 Years | 582 (1.0%) | 377 (0.7%) |
| 18 to 34 Years | 856 (1.2%) | 1,180 (1.6%) |
| 35 to 64 Years | 3,101 (2.6%) | 3,894 (3.0%) |
| 65 to 74 Years | 2,040 (6.6%) | 1,871 (5.2%) |
| 75 Years and over | 1,355 (8.3%) | 3,599 (14.0%) |
Technology Access in Area Code 478
Computing Device Access in Area Code 478
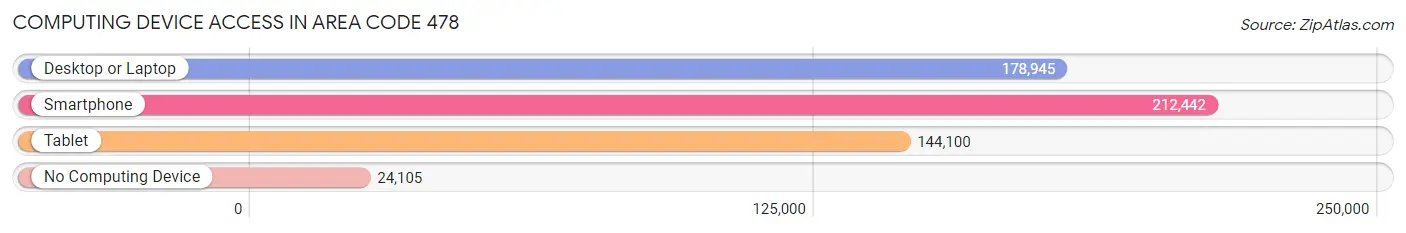
| Device Type | # Households | % Households |
| Desktop or Laptop | 178,945 | 71.1% |
| Smartphone | 212,442 | 84.4% |
| Tablet | 144,100 | 57.3% |
| No Computing Device | 24,105 | 9.6% |
| Total | 251,645 | 100.0% |
Internet Access in Area Code 478
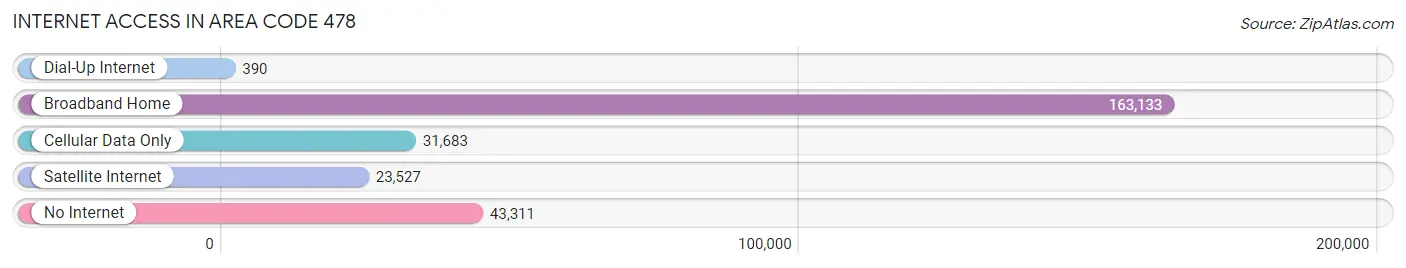
| Internet Type | # Households | % Households |
| Dial-Up Internet | 390 | 0.2% |
| Broadband Home | 163,133 | 64.8% |
| Cellular Data Only | 31,683 | 12.6% |
| Satellite Internet | 23,527 | 9.3% |
| No Internet | 43,311 | 17.2% |
| Total | 251,645 | 100.0% |
Area Code 478 Summary
Geography
Area code 478 is located in the state of Georgia, in the United States. It covers the middle and east-central portion of the state, including the cities of Macon, Warner Robins, Milledgeville, and Dublin.
Social
Area code 478 is home to a diverse population of people from all walks of life. The area is known for its vibrant music and art scene, as well as its strong sense of community.
Economics
Area code 478 is home to a number of major employers, including Robins Air Force Base, the Macon-Bibb County Industrial Authority, and the Georgia Department of Transportation. The area is also home to a number of small businesses, including restaurants, retail stores, and service providers.
Demographics
Area code 478 is home to a population of over 1.2 million people. The population is largely African American, with a significant Hispanic population as well. The median household income is around $45,000, and the unemployment rate is around 5%.
Common Questions
What is Per Capita Income in Area Code 478?
Per Capita income in Area Code 478 is $27,651.
What is the Median Family Income in Area Code 478?
Median Family Income in Area Code 478 is $68,858.
What is the Median Household income in Area Code 478?
Median Household Income in Area Code 478 is $54,665.
What is Income or Wage Gap in Area Code 478?
Income or Wage Gap in Area Code 478 is 25.7%.
Women in Area Code 478 earn 74.3 cents for every dollar earned by a man.
What is Family Income Deficit in Area Code 478?
Family Income Deficit in Area Code 478 is $10,977.
Families that are below poverty line in Area Code 478 earn $10,977 less on average than the poverty threshold level.
What is Inequality or Gini Index in Area Code 478?
Inequality or Gini Index in Area Code 478 is 35.61.
What is the Total Population of Area Code 478?
Total Population of Area Code 478 is 684,380.
What is the Total Male Population of Area Code 478?
Total Male Population of Area Code 478 is 337,164.
What is the Total Female Population of Area Code 478?
Total Female Population of Area Code 478 is 347,216.
What is the Ratio of Males per 100 Females in Area Code 478?
There are 97.10 Males per 100 Females in Area Code 478.
What is the Ratio of Females per 100 Males in Area Code 478?
There are 102.98 Females per 100 Males in Area Code 478.
What is the Median Population Age in Area Code 478?
Median Population Age in Area Code 478 is 42.3 Years.
What is the Average Family Size in Area Code 478
Average Family Size in Area Code 478 is 3.4 People.
What is the Average Household Size in Area Code 478
Average Household Size in Area Code 478 is 2.6 People.
How Large is the Labor Force in Area Code 478?
There are 276,484 People in the Labor Forcein in Area Code 478.
What is the Percentage of People in the Labor Force in Area Code 478?
50.6% of People are in the Labor Force in Area Code 478.
What is the Unemployment Rate in Area Code 478?
Unemployment Rate in Area Code 478 is 6.5%.