Area Code 216 Map & Demographics
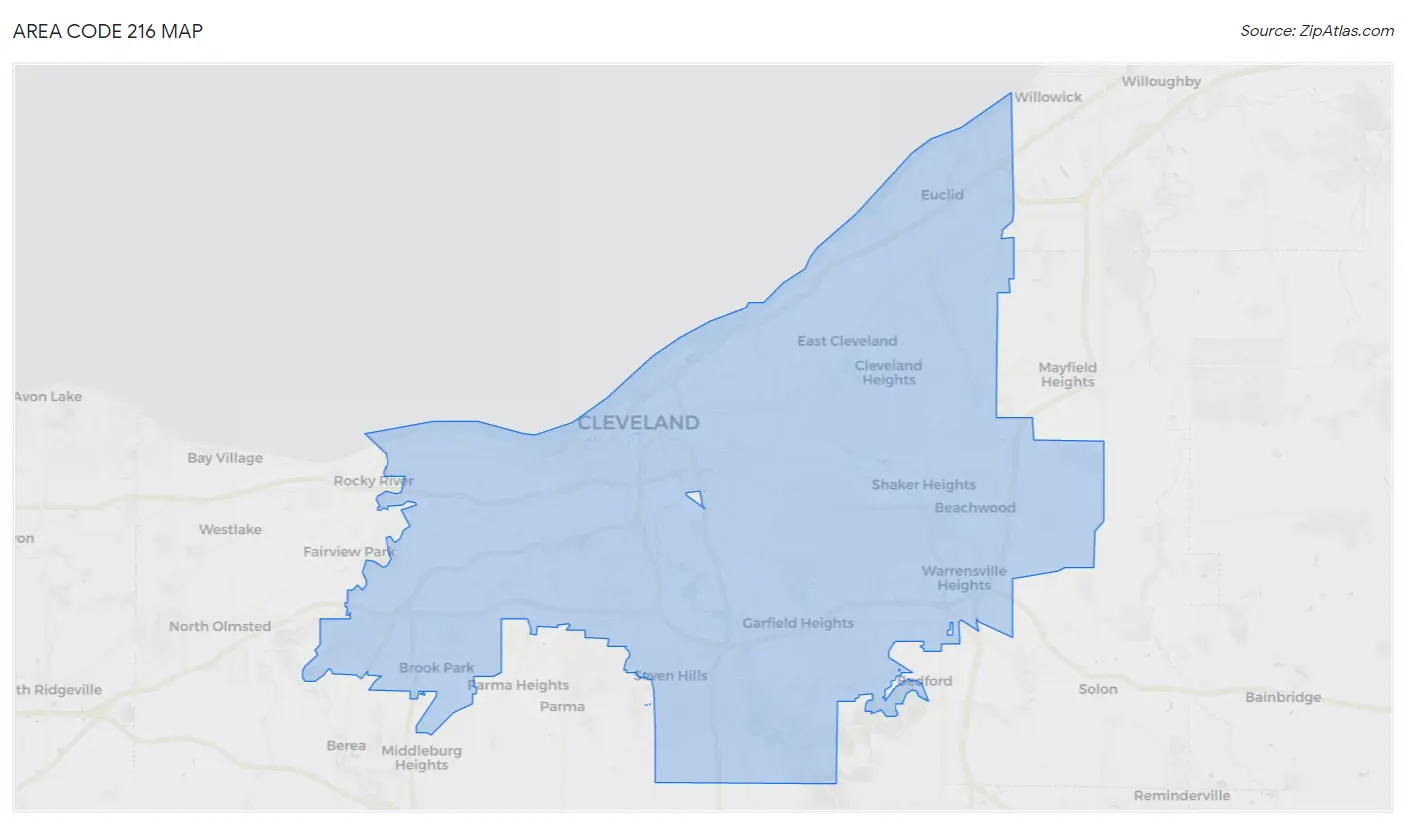
Area Code 216 Map
Area Code 216 Overview
$34,228
PER CAPITA INCOME
$72,070
AVG FAMILY INCOME
$55,831
AVG HOUSEHOLD INCOME
18.4%
WAGE / INCOME GAP [ % ]
81.6¢/ $1
WAGE / INCOME GAP [ $ ]
$10,602
FAMILY INCOME DEFICIT
18.08
INEQUALITY / GINI INDEX
947,610
TOTAL POPULATION
454,049
MALE POPULATION
493,561
FEMALE POPULATION
91.99
MALES / 100 FEMALES
108.70
FEMALES / 100 MALES
39.3
MEDIAN AGE
3.1
AVG FAMILY SIZE
2.2
AVG HOUSEHOLD SIZE
481,857
LABOR FORCE [ PEOPLE ]
62.3%
PERCENT IN LABOR FORCE
8.9%
UNEMPLOYMENT RATE
Income in Area Code 216
Income Overview in Area Code 216
Per Capita Income in Area Code 216 is $34,228, while median incomes of families and households are $72,070 and $55,831 respectively.
| Characteristic | Number | Measure |
| Per Capita Income | 947,610 | $34,228 |
| Median Family Income | 216,965 | $72,070 |
| Mean Family Income | 216,965 | $3,647,877 |
| Median Household Income | 422,543 | $55,831 |
| Mean Household Income | 422,543 | $2,911,118 |
| Income Deficit | 216,965 | $10,602 |
| Wage / Income Gap (%) | 947,610 | 18.44% |
| Wage / Income Gap ($) | 947,610 | 81.56¢ per $1 |
| Gini / Inequality Index | 947,610 | 18.08 |
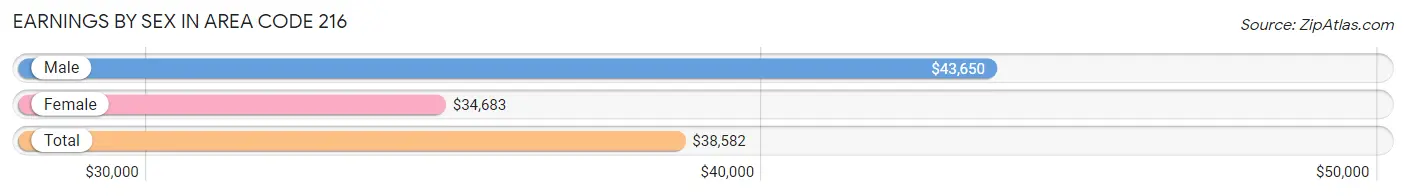
Earnings by Sex in Area Code 216
Average Earnings in Area Code 216 are $38,582, $43,650 for men and $34,683 for women, a difference of 20.5%.
| Sex | Number | Average Earnings |
| Male | 248,762 (49.5%) | $43,650 |
| Female | 254,156 (50.5%) | $34,683 |
| Total | 502,918 (100.0%) | $38,582 |
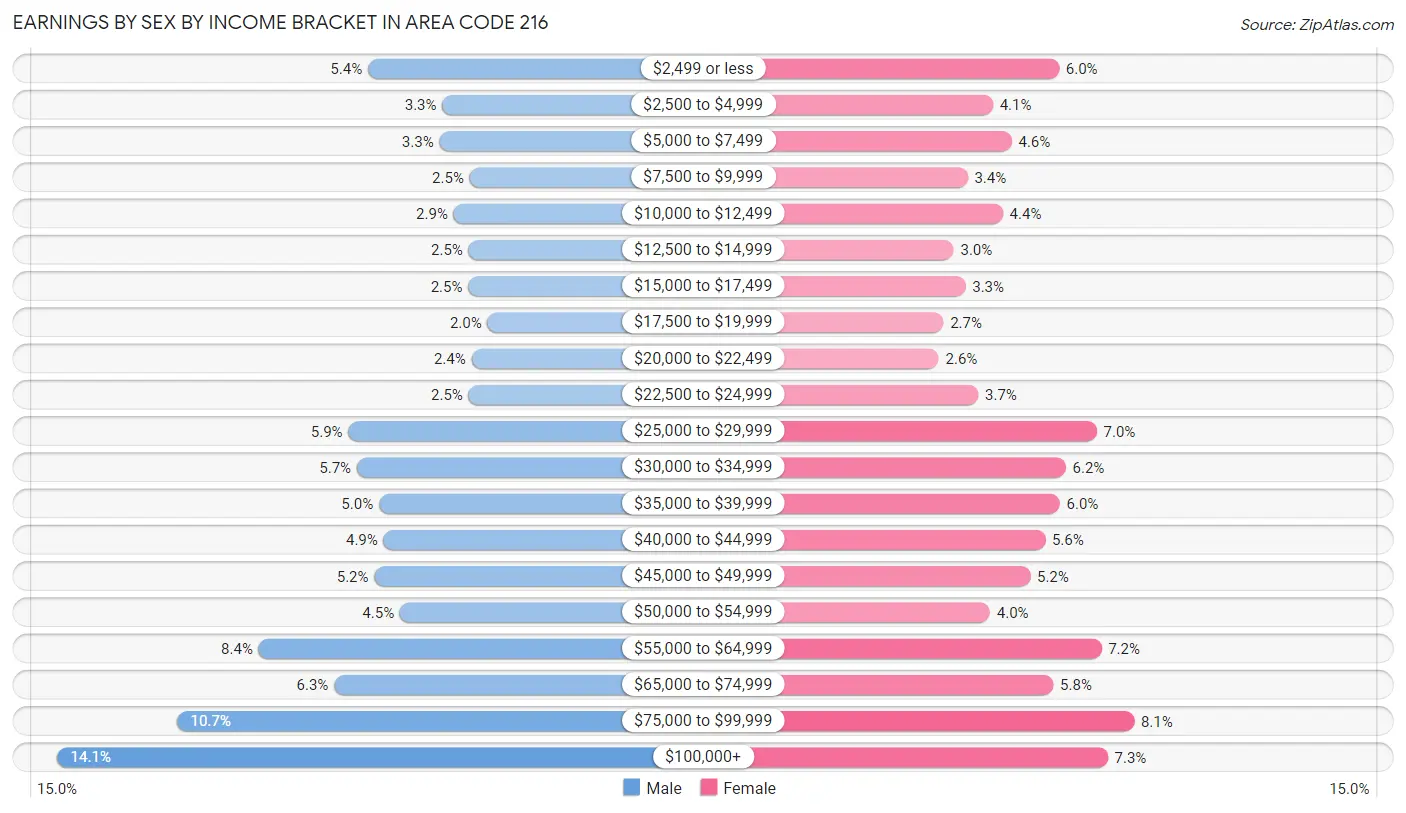
Earnings by Sex by Income Bracket in Area Code 216
The most common earnings brackets in Area Code 216 are $100,000+ for men (34,999 | 14.1%) and $75,000 to $99,999 for women (20,521 | 8.1%).
| Income | Male | Female |
| $2,499 or less | 13,311 (5.3%) | 15,136 (6.0%) |
| $2,500 to $4,999 | 8,114 (3.3%) | 10,410 (4.1%) |
| $5,000 to $7,499 | 8,320 (3.3%) | 11,758 (4.6%) |
| $7,500 to $9,999 | 6,182 (2.5%) | 8,605 (3.4%) |
| $10,000 to $12,499 | 7,302 (2.9%) | 11,124 (4.4%) |
| $12,500 to $14,999 | 6,259 (2.5%) | 7,619 (3.0%) |
| $15,000 to $17,499 | 6,293 (2.5%) | 8,468 (3.3%) |
| $17,500 to $19,999 | 4,950 (2.0%) | 6,888 (2.7%) |
| $20,000 to $22,499 | 6,072 (2.4%) | 6,551 (2.6%) |
| $22,500 to $24,999 | 6,262 (2.5%) | 9,368 (3.7%) |
| $25,000 to $29,999 | 14,686 (5.9%) | 17,854 (7.0%) |
| $30,000 to $34,999 | 14,089 (5.7%) | 15,620 (6.1%) |
| $35,000 to $39,999 | 12,529 (5.0%) | 15,205 (6.0%) |
| $40,000 to $44,999 | 12,225 (4.9%) | 14,169 (5.6%) |
| $45,000 to $49,999 | 12,853 (5.2%) | 13,084 (5.1%) |
| $50,000 to $54,999 | 11,074 (4.4%) | 10,229 (4.0%) |
| $55,000 to $64,999 | 20,951 (8.4%) | 18,161 (7.1%) |
| $65,000 to $74,999 | 15,673 (6.3%) | 14,745 (5.8%) |
| $75,000 to $99,999 | 26,618 (10.7%) | 20,521 (8.1%) |
| $100,000+ | 34,999 (14.1%) | 18,641 (7.3%) |
| Total | 248,762 (100.0%) | 254,156 (100.0%) |
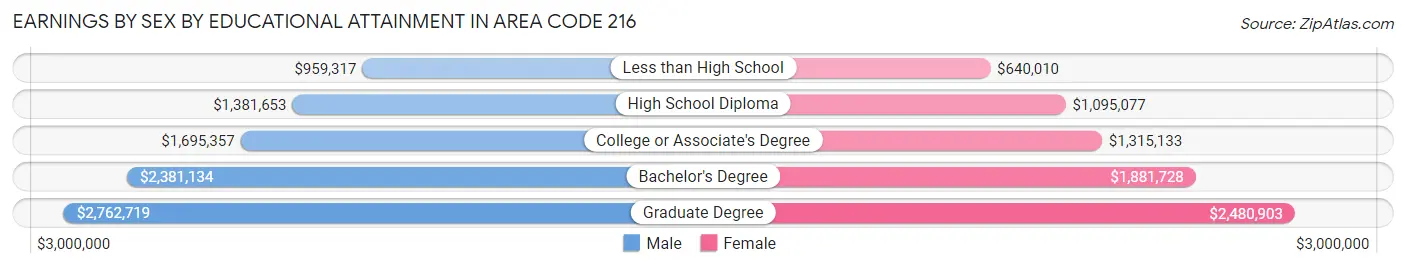
Earnings by Sex by Educational Attainment in Area Code 216
Average earnings in Area Code 216 are $1,913,261 for men and $1,549,683 for women, a difference of 19.0%. Men with an educational attainment of graduate degree enjoy the highest average annual earnings of $2,762,719, while those with less than high school education earn the least with $959,317. Women with an educational attainment of graduate degree earn the most with the average annual earnings of $2,480,903, while those with less than high school education have the smallest earnings of $640,010.
| Educational Attainment | Male Income | Female Income |
| Less than High School | $959,317 | $640,010 |
| High School Diploma | $1,381,653 | $1,095,077 |
| College or Associate's Degree | $1,695,357 | $1,315,133 |
| Bachelor's Degree | $2,381,134 | $1,881,728 |
| Graduate Degree | $2,762,719 | $2,480,903 |
| Total | $1,913,261 | $1,549,683 |
Family Income in Area Code 216
Family Income Brackets in Area Code 216
According to the Area Code 216 family income data, there are 1,356,248 families falling into the $50,000 to $74,999 income range, which is the most common income bracket and makes up 625.1% of all families. Conversely, the $10,000 to $14,999 income bracket is the least frequent group with only 305,704 families (140.9%) belonging to this category.
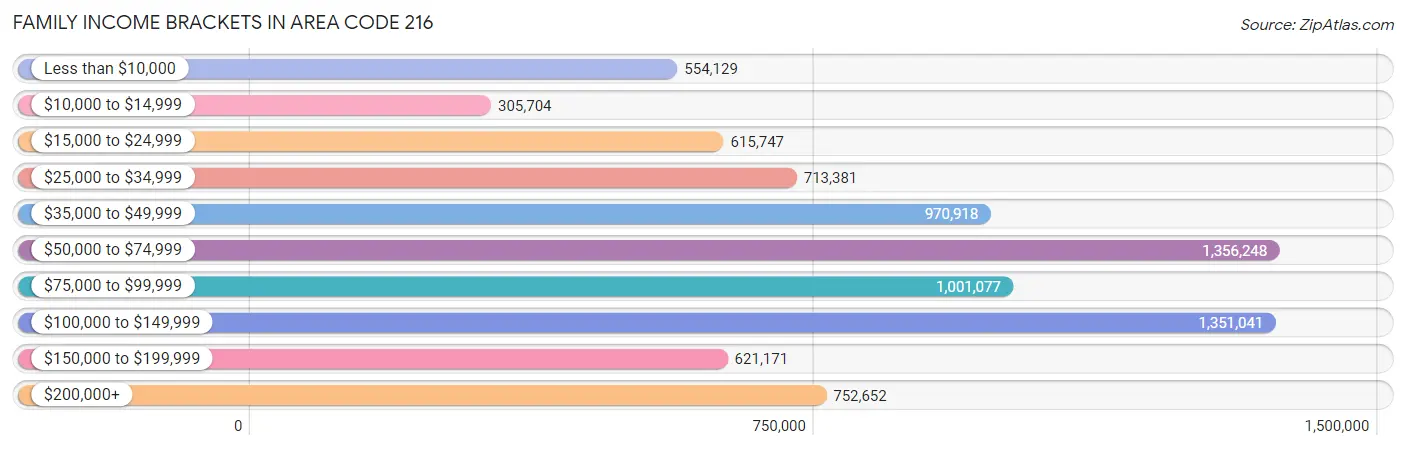
| Income Bracket | # Families | % Families |
| Less than $10,000 | 554,129 | 255.4% |
| $10,000 to $14,999 | 305,704 | 140.9% |
| $15,000 to $24,999 | 615,747 | 283.8% |
| $25,000 to $34,999 | 713,381 | 328.8% |
| $35,000 to $49,999 | 970,918 | 447.5% |
| $50,000 to $74,999 | 1,356,248 | 625.1% |
| $75,000 to $99,999 | 1,001,077 | 461.4% |
| $100,000 to $149,999 | 1,351,041 | 622.7% |
| $150,000 to $199,999 | 621,171 | 286.3% |
| $200,000+ | 752,652 | 346.9% |
Family Income by Famaliy Size in Area Code 216
7+ person families (2,640 | 1.2%) account for the highest median family income in Area Code 216 with $102,535 per family, while 2-person families (110,037 | 50.7%) have the highest median income of $33,174 per family member.
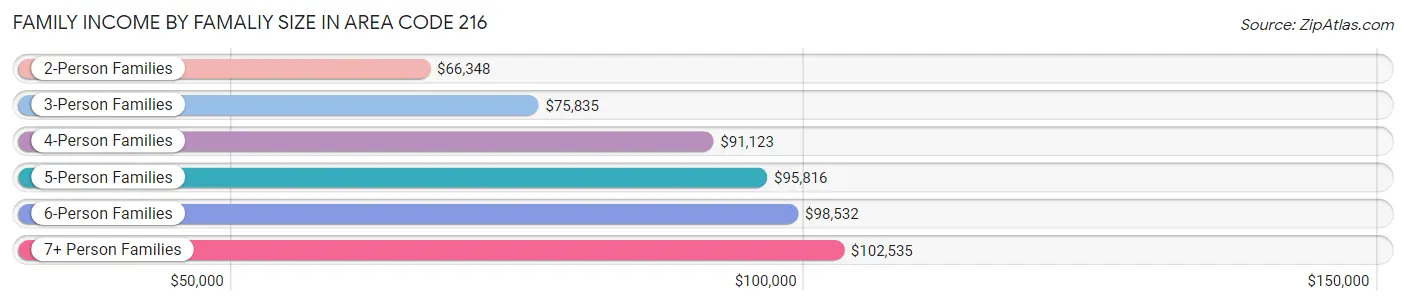
| Income Bracket | # Families | Median Income |
| 2-Person Families | 110,037 (50.7%) | $66,348 |
| 3-Person Families | 50,950 (23.5%) | $75,835 |
| 4-Person Families | 33,649 (15.5%) | $91,123 |
| 5-Person Families | 14,358 (6.6%) | $95,816 |
| 6-Person Families | 5,331 (2.5%) | $98,532 |
| 7+ Person Families | 2,640 (1.2%) | $102,535 |
| Total | 216,965 (100.0%) | $72,070 |
Family Income by Number of Earners in Area Code 216
The median family income in Area Code 216 is $72,070, with families comprising 3+ earners (21,223) having the highest median family income of $129,381, while families with no earners (33,574) have the lowest median family income of $37,519, accounting for 9.8% and 15.5% of families, respectively.
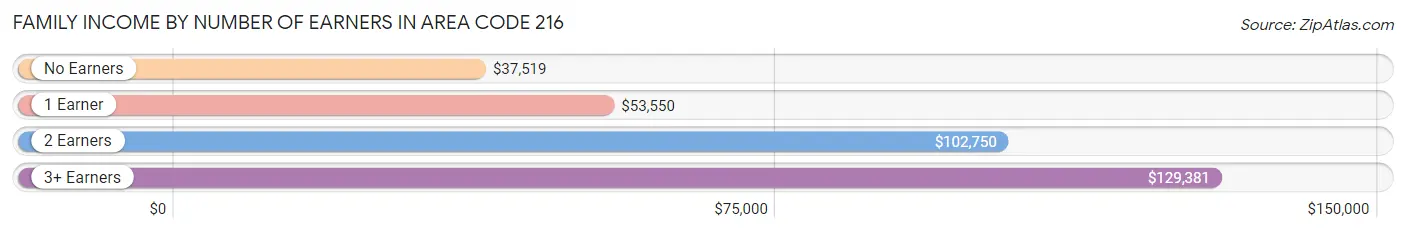
| Number of Earners | # Families | Median Income |
| No Earners | 33,574 (15.5%) | $37,519 |
| 1 Earner | 79,186 (36.5%) | $53,550 |
| 2 Earners | 82,982 (38.3%) | $102,750 |
| 3+ Earners | 21,223 (9.8%) | $129,381 |
| Total | 216,965 (100.0%) | $72,070 |
Household Income in Area Code 216
Household Income Brackets in Area Code 216
With 2,674,697 households falling in the category, the $50,000 to $74,999 income range is the most frequent in Area Code 216, accounting for 633.0% of all households. In contrast, only 842,128 households (199.3%) fall into the $150,000 to $199,999 income bracket, making it the least populous group.
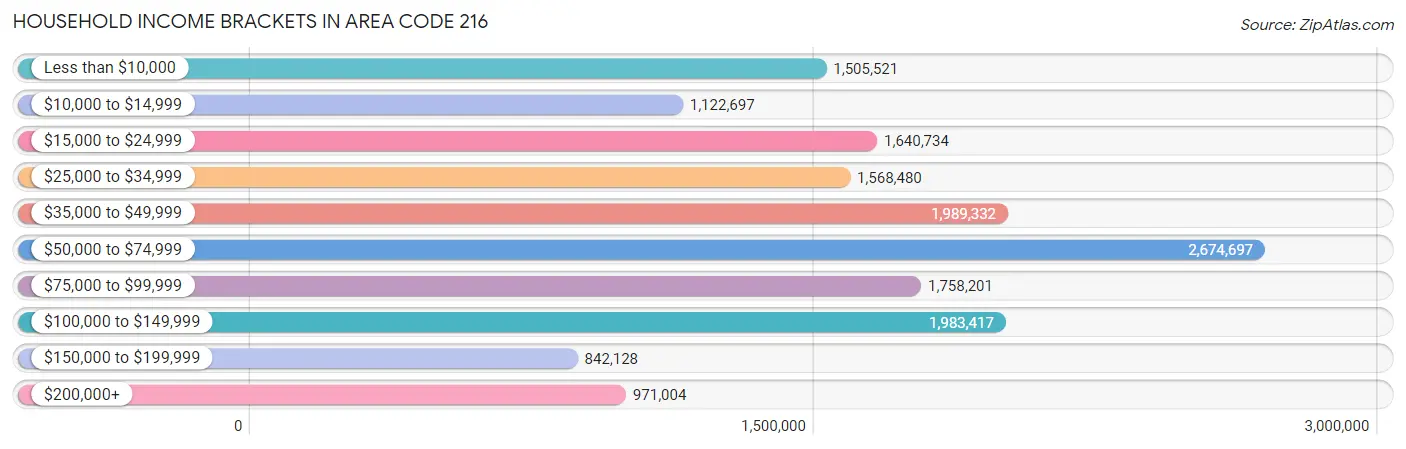
| Income Bracket | # Households | % Households |
| Less than $10,000 | 1,505,521 | 356.3% |
| $10,000 to $14,999 | 1,122,697 | 265.7% |
| $15,000 to $24,999 | 1,640,734 | 388.3% |
| $25,000 to $34,999 | 1,568,480 | 371.2% |
| $35,000 to $49,999 | 1,989,332 | 470.8% |
| $50,000 to $74,999 | 2,674,697 | 633.0% |
| $75,000 to $99,999 | 1,758,201 | 416.1% |
| $100,000 to $149,999 | 1,983,417 | 469.4% |
| $150,000 to $199,999 | 842,128 | 199.3% |
| $200,000+ | 971,004 | 229.8% |
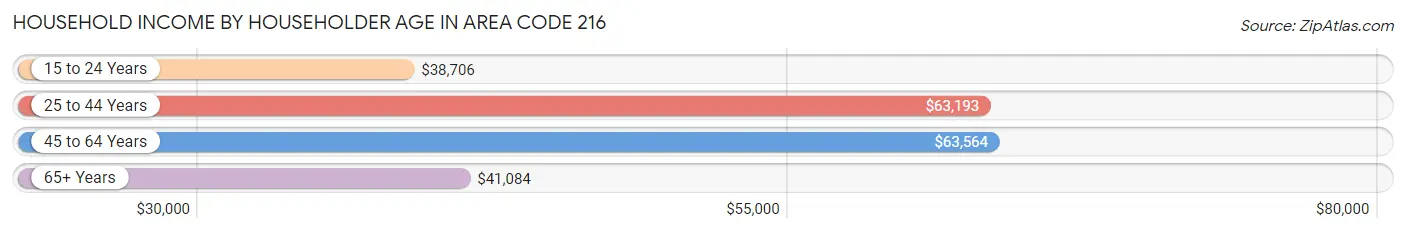
Household Income by Householder Age in Area Code 216
The median household income in Area Code 216 is $55,831, with the highest median household income of $63,564 found in the 45 to 64 years age bracket for the primary householder. A total of 150,344 households (35.6%) fall into this category. Meanwhile, the 15 to 24 years age bracket for the primary householder has the lowest median household income of $38,706, with 17,203 households (4.1%) in this group.
| Income Bracket | # Households | Median Income |
| 15 to 24 Years | 17,203 (4.1%) | $38,706 |
| 25 to 44 Years | 140,004 (33.1%) | $63,193 |
| 45 to 64 Years | 150,344 (35.6%) | $63,564 |
| 65+ Years | 114,992 (27.2%) | $41,084 |
| Total | 422,543 (100.0%) | $55,831 |
Poverty in Area Code 216
Income Below Poverty by Sex and Age in Area Code 216
With 18.2% poverty level for males and 20.7% for females among the residents of Area Code 216, under 5 year old males and 5 year old females are the most vulnerable to poverty, with 8,930 males (32.8%) and 2,010 females (39.4%) in their respective age groups living below the poverty level.
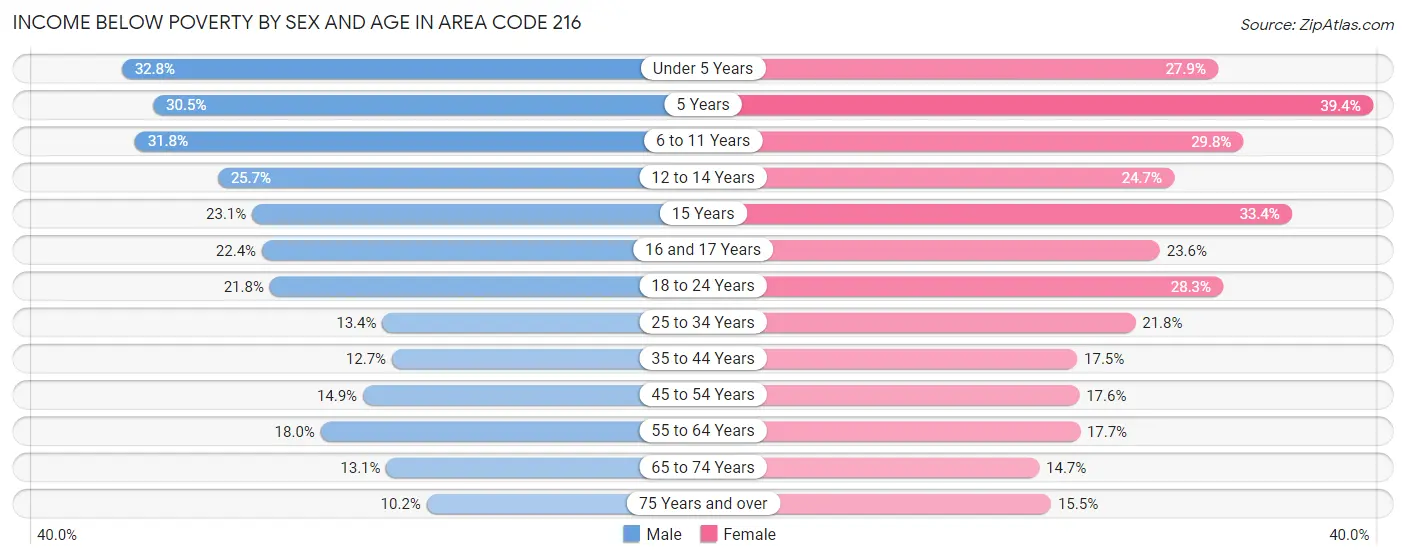
| Age Bracket | Male | Female |
| Under 5 Years | 8,930 (32.8%) | 7,370 (27.9%) |
| 5 Years | 1,542 (30.5%) | 2,010 (39.4%) |
| 6 to 11 Years | 10,519 (31.8%) | 9,373 (29.8%) |
| 12 to 14 Years | 4,173 (25.7%) | 3,904 (24.6%) |
| 15 Years | 1,406 (23.1%) | 1,749 (33.4%) |
| 16 and 17 Years | 2,372 (22.4%) | 2,630 (23.6%) |
| 18 to 24 Years | 8,670 (21.8%) | 11,285 (28.3%) |
| 25 to 34 Years | 9,428 (13.4%) | 16,123 (21.8%) |
| 35 to 44 Years | 6,983 (12.7%) | 10,194 (17.5%) |
| 45 to 54 Years | 7,816 (14.9%) | 9,951 (17.6%) |
| 55 to 64 Years | 10,920 (18.0%) | 11,855 (17.7%) |
| 65 to 74 Years | 5,693 (13.1%) | 7,597 (14.6%) |
| 75 Years and over | 2,532 (10.2%) | 6,477 (15.5%) |
| Total | 80,984 (18.2%) | 100,518 (20.7%) |
Income Above Poverty by Sex and Age in Area Code 216
According to the poverty statistics in Area Code 216, males aged 75 years and over and females aged 65 to 74 years are the age groups that are most secure financially, with 89.8% of males and 85.4% of females in these age groups living above the poverty line.
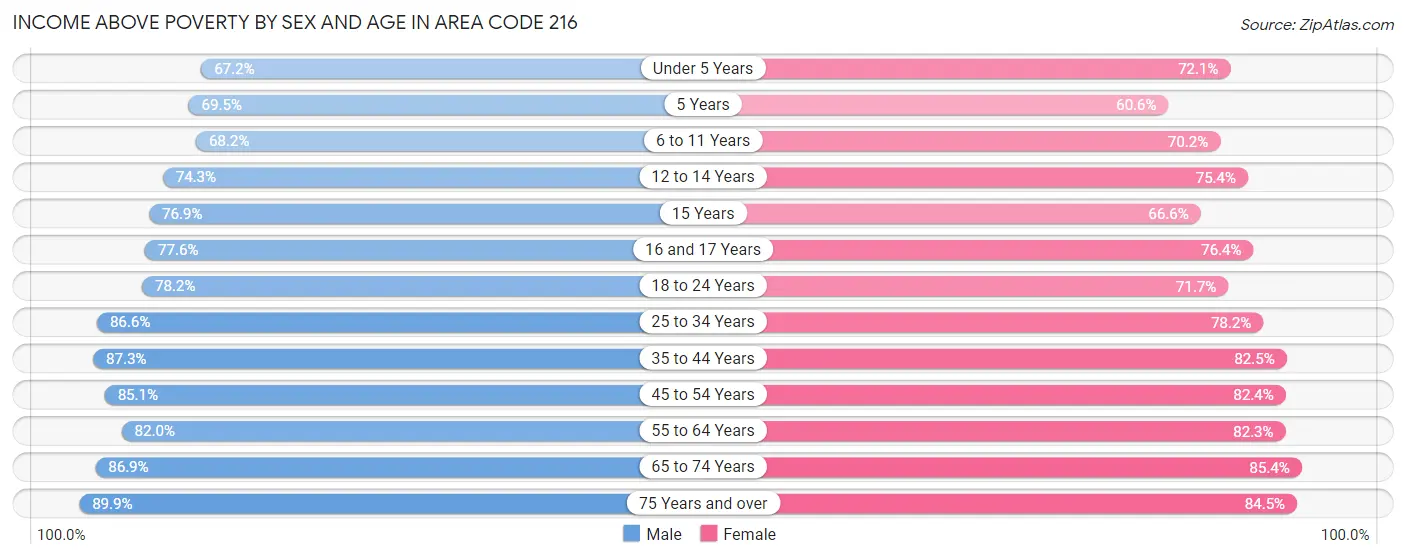
| Age Bracket | Male | Female |
| Under 5 Years | 18,306 (67.2%) | 19,034 (72.1%) |
| 5 Years | 3,520 (69.5%) | 3,092 (60.6%) |
| 6 to 11 Years | 22,543 (68.2%) | 22,079 (70.2%) |
| 12 to 14 Years | 12,092 (74.3%) | 11,932 (75.3%) |
| 15 Years | 4,677 (76.9%) | 3,487 (66.6%) |
| 16 and 17 Years | 8,226 (77.6%) | 8,511 (76.4%) |
| 18 to 24 Years | 31,102 (78.2%) | 28,603 (71.7%) |
| 25 to 34 Years | 60,707 (86.6%) | 57,866 (78.2%) |
| 35 to 44 Years | 47,892 (87.3%) | 48,154 (82.5%) |
| 45 to 54 Years | 44,720 (85.1%) | 46,488 (82.4%) |
| 55 to 64 Years | 49,686 (82.0%) | 55,205 (82.3%) |
| 65 to 74 Years | 37,631 (86.9%) | 44,247 (85.4%) |
| 75 Years and over | 22,412 (89.8%) | 35,236 (84.5%) |
| Total | 363,514 (81.8%) | 383,934 (79.2%) |
Income Below Poverty Among Married-Couple Families in Area Code 216
The poverty statistics for married-couple families in Area Code 216 show that 4.8% or 6,175 of the total 127,955 families live below the poverty line. Families with 5 or more children have the highest poverty rate of 26.1%, comprising of 230 families. On the other hand, families with no children have the lowest poverty rate of 3.9%, which includes 3,169 families.
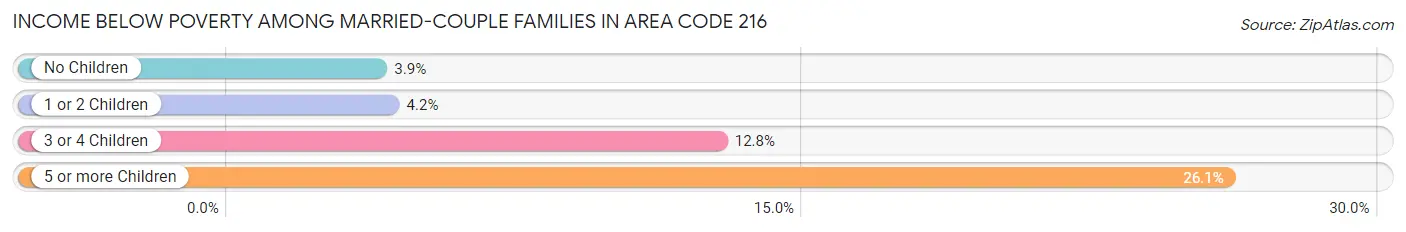
| Children | Above Poverty | Below Poverty |
| No Children | 77,995 (96.1%) | 3,169 (3.9%) |
| 1 or 2 Children | 34,611 (95.8%) | 1,526 (4.2%) |
| 3 or 4 Children | 8,521 (87.2%) | 1,250 (12.8%) |
| 5 or more Children | 653 (74.0%) | 230 (26.1%) |
| Total | 121,780 (95.2%) | 6,175 (4.8%) |
Income Below Poverty Among Single-Parent Households in Area Code 216
According to the poverty data in Area Code 216, 19.1% or 3,939 single-father households and 31.5% or 21,542 single-mother households are living below the poverty line. Among single-father households, those with 5 or more children have the highest poverty rate, with 85 households (73.9%) experiencing poverty. Likewise, among single-mother households, those with 5 or more children have the highest poverty rate, with 766 households (78.5%) falling below the poverty line.
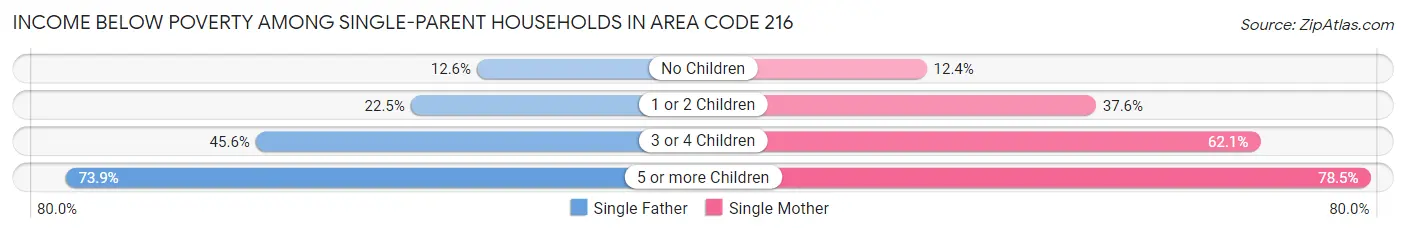
| Children | Single Father | Single Mother |
| No Children | 1,289 (12.6%) | 3,154 (12.4%) |
| 1 or 2 Children | 2,087 (22.5%) | 12,807 (37.6%) |
| 3 or 4 Children | 478 (45.6%) | 4,815 (62.1%) |
| 5 or more Children | 85 (73.9%) | 766 (78.5%) |
| Total | 3,939 (19.1%) | 21,542 (31.5%) |
Income Below Poverty Among Married-Couple vs Single-Parent Households in Area Code 216
The poverty data for Area Code 216 shows that 6,175 of the married-couple family households (4.8%) and 25,481 of the single-parent households (28.6%) are living below the poverty level. Within the married-couple family households, those with 5 or more children have the highest poverty rate, with 230 households (26.1%) falling below the poverty line. Among the single-parent households, those with 5 or more children have the highest poverty rate, with 851 household (78.0%) living below poverty.
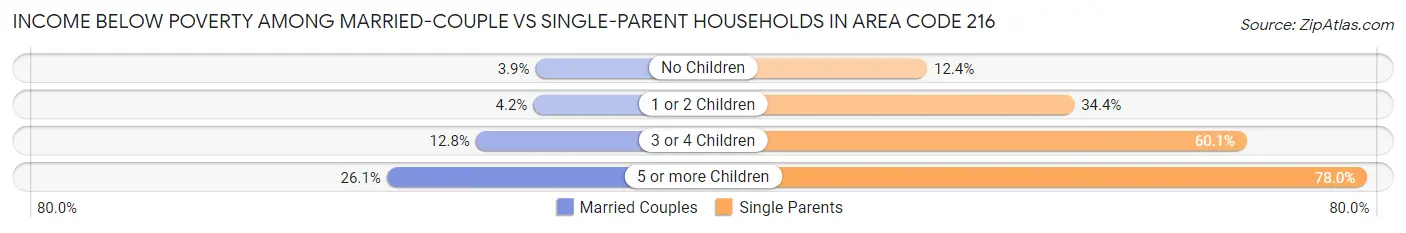
| Children | Married-Couple Families | Single-Parent Households |
| No Children | 3,169 (3.9%) | 4,443 (12.4%) |
| 1 or 2 Children | 1,526 (4.2%) | 14,894 (34.4%) |
| 3 or 4 Children | 1,250 (12.8%) | 5,293 (60.1%) |
| 5 or more Children | 230 (26.1%) | 851 (78.0%) |
| Total | 6,175 (4.8%) | 25,481 (28.6%) |
Race in Area Code 216
The most populous races in Area Code 216 are White / Caucasian (509,596 | 53.8%), Black / African American (329,796 | 34.8%), and Hispanic or Latino (69,674 | 7.3%).
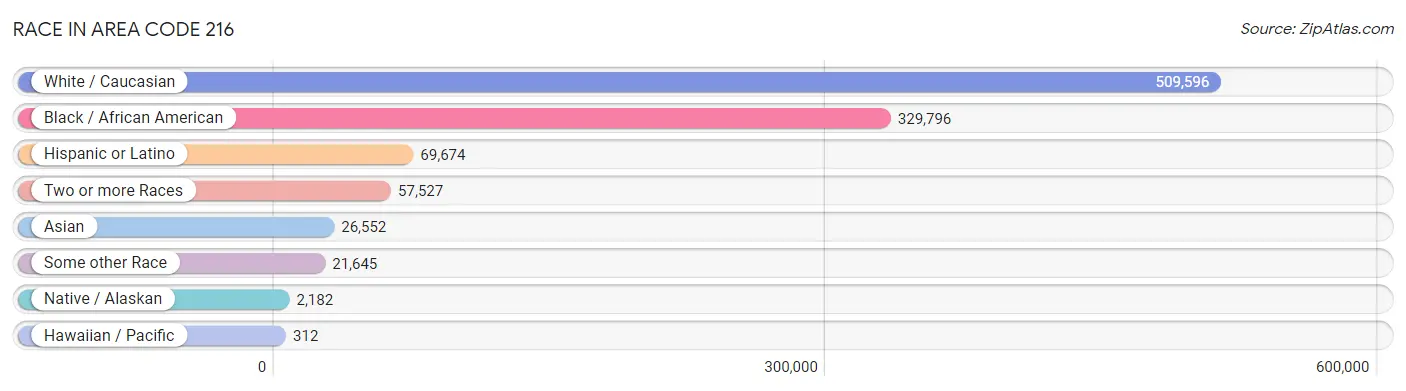
| Race | # Population | % Population |
| Asian | 26,552 | 2.8% |
| Black / African American | 329,796 | 34.8% |
| Hawaiian / Pacific | 312 | 0.0% |
| Hispanic or Latino | 69,674 | 7.3% |
| Native / Alaskan | 2,182 | 0.2% |
| White / Caucasian | 509,596 | 53.8% |
| Two or more Races | 57,527 | 6.1% |
| Some other Race | 21,645 | 2.3% |
| Total | 947,610 | 100.0% |
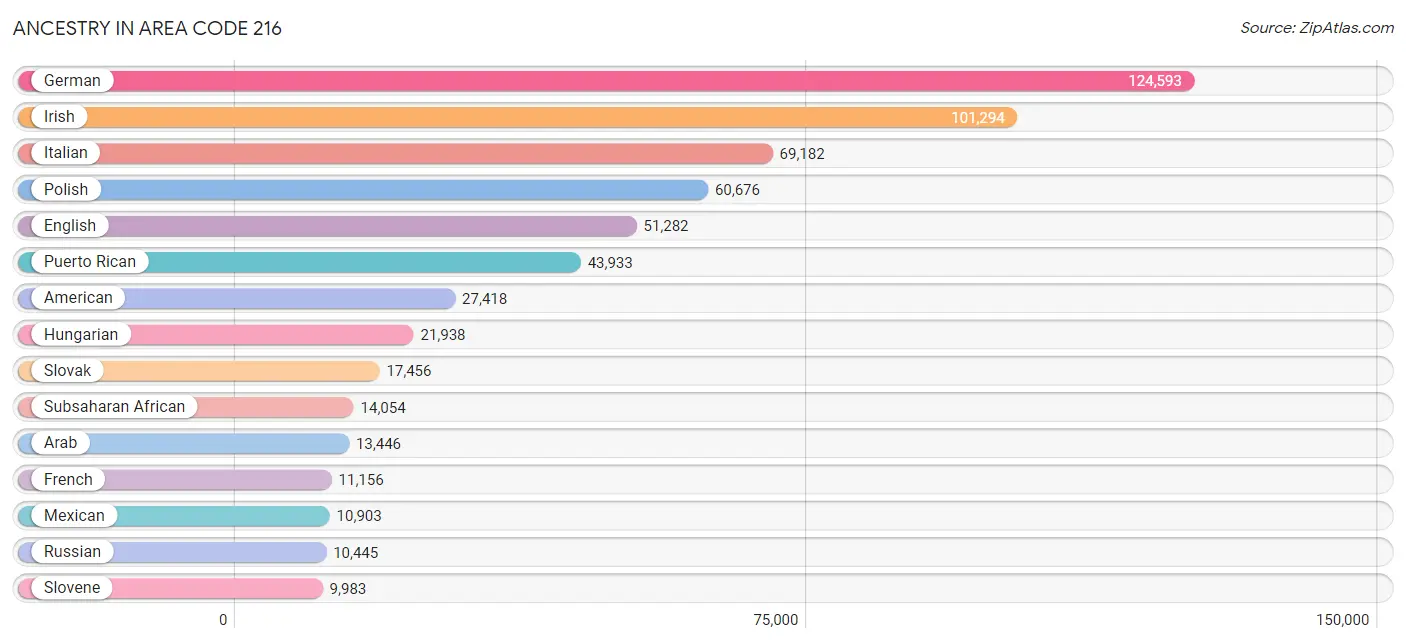
Ancestry in Area Code 216
The most populous ancestries reported in Area Code 216 are German (124,593 | 13.2%), Irish (101,294 | 10.7%), Italian (69,182 | 7.3%), Polish (60,676 | 6.4%), and English (51,282 | 5.4%), together accounting for 42.9% of all Area Code 216 residents.
| Ancestry | # Population | % Population |
| Afghan | 473 | 0.1% |
| African | 7,761 | 0.8% |
| Albanian | 1,534 | 0.2% |
| Alsatian | 14 | 0.0% |
| American | 27,418 | 2.9% |
| Apache | 69 | 0.0% |
| Arab | 13,446 | 1.4% |
| Argentinean | 315 | 0.0% |
| Armenian | 644 | 0.1% |
| Assyrian / Chaldean / Syriac | 7 | 0.0% |
| Australian | 96 | 0.0% |
| Austrian | 2,423 | 0.3% |
| Bahamian | 59 | 0.0% |
| Bangladeshi | 27 | 0.0% |
| Barbadian | 53 | 0.0% |
| Belgian | 468 | 0.1% |
| Belizean | 59 | 0.0% |
| Bermudan | 30 | 0.0% |
| Bhutanese | 1,740 | 0.2% |
| Blackfeet | 671 | 0.1% |
| Bolivian | 25 | 0.0% |
| Brazilian | 216 | 0.0% |
| British | 3,251 | 0.3% |
| British West Indian | 27 | 0.0% |
| Bulgarian | 264 | 0.0% |
| Burmese | 2,514 | 0.3% |
| Cajun | 55 | 0.0% |
| Cambodian | 40 | 0.0% |
| Canadian | 877 | 0.1% |
| Cape Verdean | 41 | 0.0% |
| Carpatho Rusyn | 226 | 0.0% |
| Celtic | 93 | 0.0% |
| Central American | 4,725 | 0.5% |
| Central American Indian | 2,546 | 0.3% |
| Cherokee | 3,010 | 0.3% |
| Cheyenne | 4 | 0.0% |
| Chickasaw | 99 | 0.0% |
| Chilean | 398 | 0.0% |
| Chippewa | 142 | 0.0% |
| Choctaw | 251 | 0.0% |
| Colombian | 715 | 0.1% |
| Comanche | 18 | 0.0% |
| Costa Rican | 68 | 0.0% |
| Creek | 118 | 0.0% |
| Croatian | 5,011 | 0.5% |
| Crow | 5 | 0.0% |
| Cuban | 1,534 | 0.2% |
| Cypriot | 23 | 0.0% |
| Czech | 8,450 | 0.9% |
| Czechoslovakian | 1,959 | 0.2% |
| Danish | 1,015 | 0.1% |
| Delaware | 31 | 0.0% |
| Dominican | 2,098 | 0.2% |
| Dutch | 5,502 | 0.6% |
| Dutch West Indian | 20 | 0.0% |
| Eastern European | 4,812 | 0.5% |
| Ecuadorian | 529 | 0.1% |
| Egyptian | 963 | 0.1% |
| English | 51,282 | 5.4% |
| Estonian | 35 | 0.0% |
| Ethiopian | 202 | 0.0% |
| European | 9,297 | 1.0% |
| Filipino | 216 | 0.0% |
| Finnish | 1,706 | 0.2% |
| French | 11,156 | 1.2% |
| French American Indian | 24 | 0.0% |
| French Canadian | 1,779 | 0.2% |
| German | 124,593 | 13.2% |
| German Russian | 6 | 0.0% |
| Ghanaian | 437 | 0.1% |
| Greek | 5,026 | 0.5% |
| Guamanian / Chamorro | 130 | 0.0% |
| Guatemalan | 1,587 | 0.2% |
| Guyanese | 374 | 0.0% |
| Haitian | 588 | 0.1% |
| Honduran | 888 | 0.1% |
| Hopi | 14 | 0.0% |
| Hungarian | 21,938 | 2.3% |
| Icelander | 94 | 0.0% |
| Indian (Asian) | 7,714 | 0.8% |
| Indonesian | 128 | 0.0% |
| Inupiat | 17 | 0.0% |
| Iranian | 736 | 0.1% |
| Iraqi | 210 | 0.0% |
| Irish | 101,294 | 10.7% |
| Iroquois | 71 | 0.0% |
| Israeli | 611 | 0.1% |
| Italian | 69,182 | 7.3% |
| Jamaican | 2,876 | 0.3% |
| Japanese | 869 | 0.1% |
| Jordanian | 325 | 0.0% |
| Kenyan | 57 | 0.0% |
| Korean | 4,060 | 0.4% |
| Laotian | 133 | 0.0% |
| Latvian | 292 | 0.0% |
| Lebanese | 3,892 | 0.4% |
| Liberian | 564 | 0.1% |
| Lithuanian | 4,398 | 0.5% |
| Lumbee | 83 | 0.0% |
| Luxembourger | 7 | 0.0% |
| Macedonian | 283 | 0.0% |
| Malaysian | 84 | 0.0% |
| Maltese | 16 | 0.0% |
| Mexican | 10,903 | 1.1% |
| Mexican American Indian | 248 | 0.0% |
| Mongolian | 65 | 0.0% |
| Moroccan | 854 | 0.1% |
| Native Hawaiian | 410 | 0.0% |
| Navajo | 121 | 0.0% |
| New Zealander | 27 | 0.0% |
| Nicaraguan | 380 | 0.0% |
| Nigerian | 2,439 | 0.3% |
| Northern European | 599 | 0.1% |
| Norwegian | 2,244 | 0.2% |
| Osage | 6 | 0.0% |
| Ottawa | 8 | 0.0% |
| Pakistani | 414 | 0.0% |
| Palestinian | 2,365 | 0.3% |
| Panamanian | 206 | 0.0% |
| Paraguayan | 30 | 0.0% |
| Pennsylvania German | 372 | 0.0% |
| Peruvian | 669 | 0.1% |
| Polish | 60,676 | 6.4% |
| Portuguese | 790 | 0.1% |
| Potawatomi | 7 | 0.0% |
| Pueblo | 12 | 0.0% |
| Puerto Rican | 43,933 | 4.6% |
| Romanian | 5,397 | 0.6% |
| Russian | 10,445 | 1.1% |
| Salvadoran | 1,591 | 0.2% |
| Samoan | 120 | 0.0% |
| Scandinavian | 748 | 0.1% |
| Scotch-Irish | 5,043 | 0.5% |
| Scottish | 9,318 | 1.0% |
| Seminole | 97 | 0.0% |
| Senegalese | 50 | 0.0% |
| Serbian | 2,565 | 0.3% |
| Sierra Leonean | 50 | 0.0% |
| Sioux | 36 | 0.0% |
| Slavic | 504 | 0.1% |
| Slovak | 17,456 | 1.8% |
| Slovene | 9,983 | 1.1% |
| Somali | 331 | 0.0% |
| South African | 133 | 0.0% |
| South American | 3,087 | 0.3% |
| South American Indian | 41 | 0.0% |
| Soviet Union | 11 | 0.0% |
| Spaniard | 818 | 0.1% |
| Spanish | 1,041 | 0.1% |
| Sri Lankan | 1,721 | 0.2% |
| Subsaharan African | 14,054 | 1.5% |
| Sudanese | 205 | 0.0% |
| Swedish | 4,026 | 0.4% |
| Swiss | 1,999 | 0.2% |
| Syrian | 1,935 | 0.2% |
| Taiwanese | 22 | 0.0% |
| Thai | 9,335 | 1.0% |
| Tlingit-Haida | 19 | 0.0% |
| Tongan | 46 | 0.0% |
| Trinidadian and Tobagonian | 447 | 0.1% |
| Turkish | 380 | 0.0% |
| U.S. Virgin Islander | 46 | 0.0% |
| Ugandan | 344 | 0.0% |
| Ukrainian | 8,207 | 0.9% |
| Uruguayan | 155 | 0.0% |
| Venezuelan | 222 | 0.0% |
| Vietnamese | 88 | 0.0% |
| Welsh | 4,446 | 0.5% |
| West Indian | 650 | 0.1% |
| Yaqui | 25 | 0.0% |
| Yugoslavian | 861 | 0.1% |
| Yup'ik | 151 | 0.0% |
| Zimbabwean | 32 | 0.0% | View All 173 Rows |
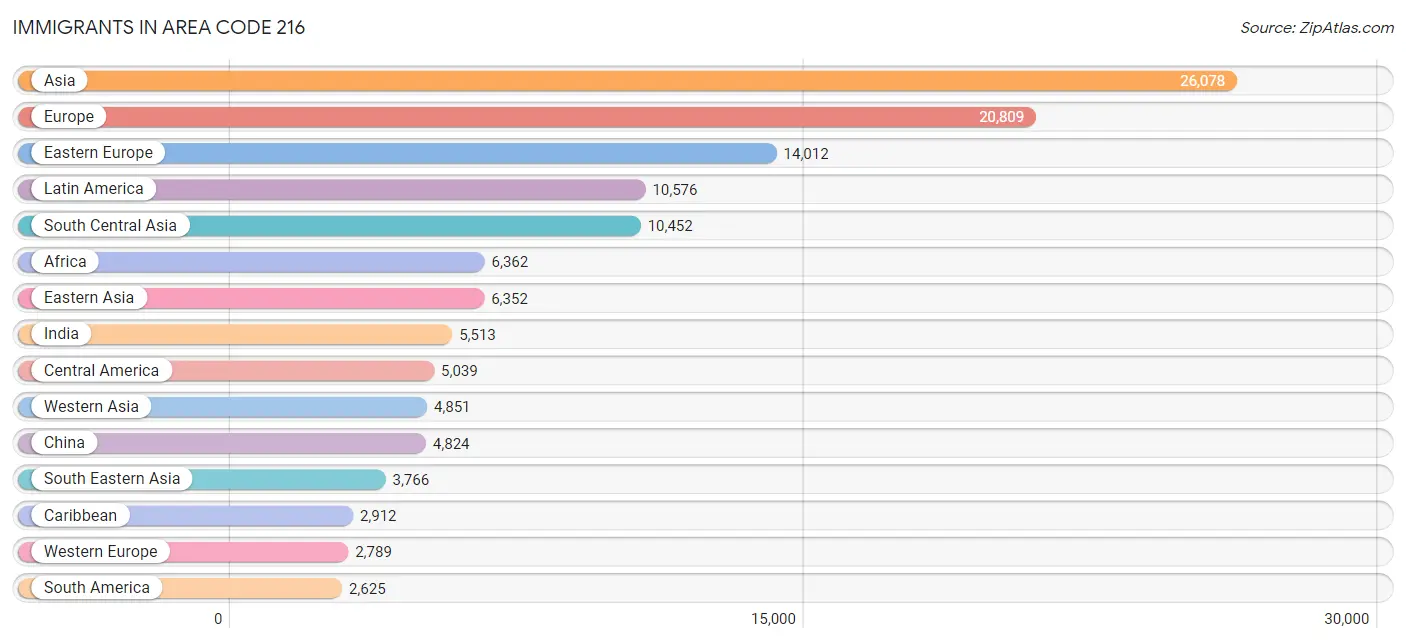
Immigrants in Area Code 216
The most numerous immigrant groups reported in Area Code 216 came from Asia (26,078 | 2.8%), Europe (20,809 | 2.2%), Eastern Europe (14,012 | 1.5%), Latin America (10,576 | 1.1%), and South Central Asia (10,452 | 1.1%), together accounting for 8.6% of all Area Code 216 residents.
| Immigration Origin | # Population | % Population |
| Afghanistan | 477 | 0.1% |
| Africa | 6,362 | 0.7% |
| Albania | 1,186 | 0.1% |
| Argentina | 196 | 0.0% |
| Armenia | 114 | 0.0% |
| Asia | 26,078 | 2.8% |
| Australia | 109 | 0.0% |
| Austria | 208 | 0.0% |
| Bahamas | 11 | 0.0% |
| Bangladesh | 73 | 0.0% |
| Barbados | 19 | 0.0% |
| Belarus | 160 | 0.0% |
| Belgium | 98 | 0.0% |
| Belize | 49 | 0.0% |
| Bosnia and Herzegovina | 874 | 0.1% |
| Brazil | 375 | 0.0% |
| Bulgaria | 261 | 0.0% |
| Cabo Verde | 5 | 0.0% |
| Cambodia | 235 | 0.0% |
| Cameroon | 73 | 0.0% |
| Canada | 1,624 | 0.2% |
| Caribbean | 2,912 | 0.3% |
| Central America | 5,039 | 0.5% |
| Chile | 74 | 0.0% |
| China | 4,824 | 0.5% |
| Colombia | 431 | 0.1% |
| Congo | 284 | 0.0% |
| Costa Rica | 114 | 0.0% |
| Croatia | 396 | 0.0% |
| Cuba | 287 | 0.0% |
| Czechoslovakia | 298 | 0.0% |
| Denmark | 33 | 0.0% |
| Dominican Republic | 1,011 | 0.1% |
| Eastern Africa | 1,419 | 0.2% |
| Eastern Asia | 6,352 | 0.7% |
| Eastern Europe | 14,012 | 1.5% |
| Ecuador | 261 | 0.0% |
| Egypt | 716 | 0.1% |
| El Salvador | 642 | 0.1% |
| England | 462 | 0.1% |
| Ethiopia | 105 | 0.0% |
| Europe | 20,809 | 2.2% |
| France | 486 | 0.1% |
| Germany | 1,872 | 0.2% |
| Ghana | 289 | 0.0% |
| Greece | 530 | 0.1% |
| Grenada | 13 | 0.0% |
| Guatemala | 1,038 | 0.1% |
| Guyana | 434 | 0.1% |
| Haiti | 48 | 0.0% |
| Honduras | 621 | 0.1% |
| Hong Kong | 408 | 0.0% |
| Hungary | 707 | 0.1% |
| India | 5,513 | 0.6% |
| Indonesia | 131 | 0.0% |
| Iran | 654 | 0.1% |
| Iraq | 355 | 0.0% |
| Ireland | 339 | 0.0% |
| Israel | 443 | 0.1% |
| Italy | 1,739 | 0.2% |
| Jamaica | 1,066 | 0.1% |
| Japan | 307 | 0.0% |
| Jordan | 488 | 0.1% |
| Kazakhstan | 147 | 0.0% |
| Kenya | 424 | 0.0% |
| Korea | 1,209 | 0.1% |
| Kuwait | 266 | 0.0% |
| Laos | 63 | 0.0% |
| Latin America | 10,576 | 1.1% |
| Latvia | 111 | 0.0% |
| Lebanon | 855 | 0.1% |
| Liberia | 219 | 0.0% |
| Lithuania | 242 | 0.0% |
| Malaysia | 58 | 0.0% |
| Mexico | 2,184 | 0.2% |
| Middle Africa | 738 | 0.1% |
| Moldova | 581 | 0.1% |
| Morocco | 534 | 0.1% |
| Nepal | 670 | 0.1% |
| Netherlands | 113 | 0.0% |
| Nicaragua | 269 | 0.0% |
| Nigeria | 987 | 0.1% |
| North Macedonia | 148 | 0.0% |
| Northern Africa | 1,400 | 0.2% |
| Northern Europe | 1,570 | 0.2% |
| Norway | 16 | 0.0% |
| Oceania | 131 | 0.0% |
| Pakistan | 565 | 0.1% |
| Panama | 117 | 0.0% |
| Peru | 484 | 0.1% |
| Philippines | 1,785 | 0.2% |
| Poland | 1,544 | 0.2% |
| Portugal | 30 | 0.0% |
| Romania | 2,280 | 0.2% |
| Russia | 1,159 | 0.1% |
| Saudi Arabia | 491 | 0.1% |
| Scotland | 129 | 0.0% |
| Senegal | 67 | 0.0% |
| Serbia | 588 | 0.1% |
| Sierra Leone | 27 | 0.0% |
| Singapore | 35 | 0.0% |
| Somalia | 107 | 0.0% |
| South Africa | 214 | 0.0% |
| South America | 2,625 | 0.3% |
| South Central Asia | 10,452 | 1.1% |
| South Eastern Asia | 3,766 | 0.4% |
| Southern Europe | 2,419 | 0.3% |
| Spain | 118 | 0.0% |
| Sri Lanka | 32 | 0.0% |
| Sudan | 51 | 0.0% |
| Sweden | 32 | 0.0% |
| Switzerland | 12 | 0.0% |
| Syria | 1,431 | 0.2% |
| Taiwan | 274 | 0.0% |
| Thailand | 252 | 0.0% |
| Trinidad and Tobago | 271 | 0.0% |
| Turkey | 137 | 0.0% |
| Uganda | 296 | 0.0% |
| Ukraine | 2,446 | 0.3% |
| Uruguay | 179 | 0.0% |
| Uzbekistan | 696 | 0.1% |
| Venezuela | 191 | 0.0% |
| Vietnam | 1,175 | 0.1% |
| West Indies | 167 | 0.0% |
| Western Africa | 2,451 | 0.3% |
| Western Asia | 4,851 | 0.5% |
| Western Europe | 2,789 | 0.3% |
| Zaire | 381 | 0.0% |
| Zimbabwe | 44 | 0.0% | View All 129 Rows |
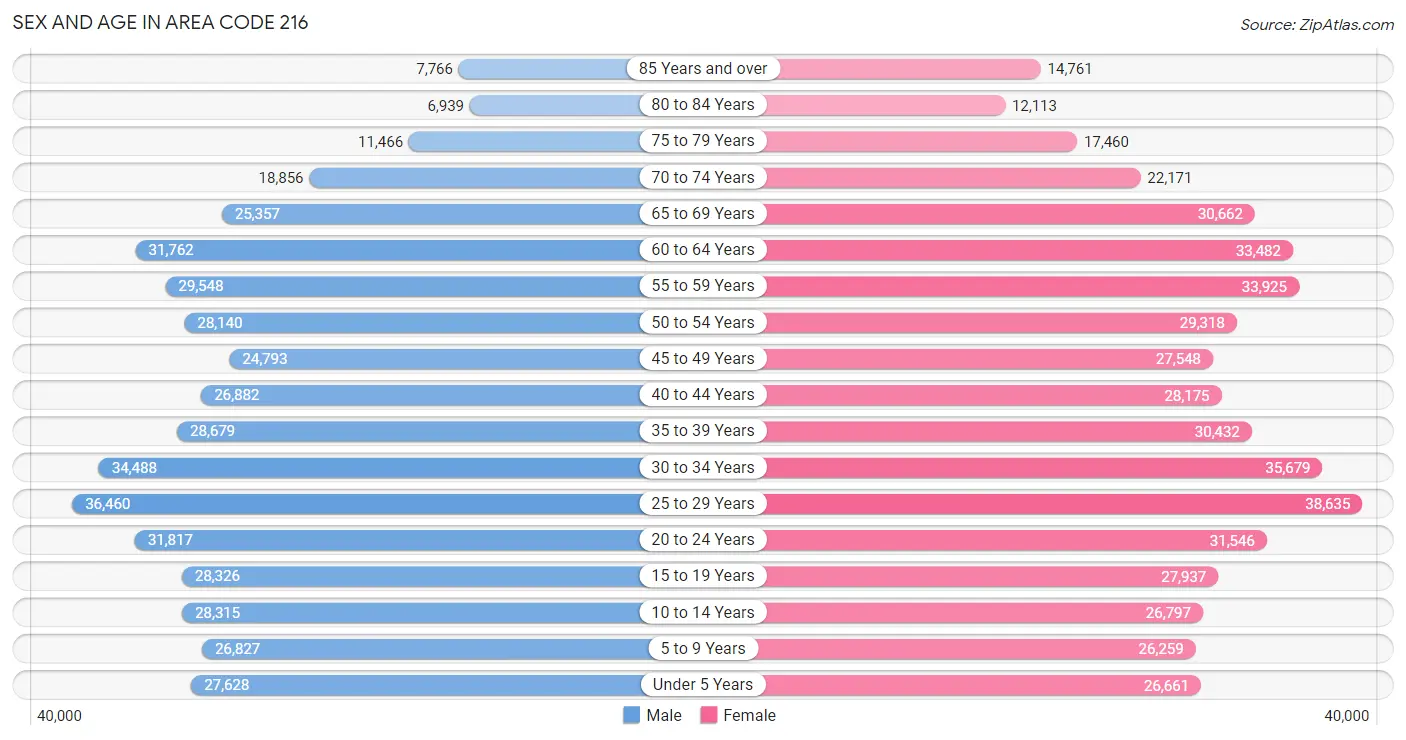
Sex and Age in Area Code 216
Sex and Age in Area Code 216
The most populous age groups in Area Code 216 are 25 to 29 Years (36,460 | 8.0%) for men and 25 to 29 Years (38,635 | 7.8%) for women.
| Age Bracket | Male | Female |
| Under 5 Years | 27,628 (6.1%) | 26,661 (5.4%) |
| 5 to 9 Years | 26,827 (5.9%) | 26,259 (5.3%) |
| 10 to 14 Years | 28,315 (6.2%) | 26,797 (5.4%) |
| 15 to 19 Years | 28,326 (6.2%) | 27,937 (5.7%) |
| 20 to 24 Years | 31,817 (7.0%) | 31,546 (6.4%) |
| 25 to 29 Years | 36,460 (8.0%) | 38,635 (7.8%) |
| 30 to 34 Years | 34,488 (7.6%) | 35,679 (7.2%) |
| 35 to 39 Years | 28,679 (6.3%) | 30,432 (6.2%) |
| 40 to 44 Years | 26,882 (5.9%) | 28,175 (5.7%) |
| 45 to 49 Years | 24,793 (5.5%) | 27,548 (5.6%) |
| 50 to 54 Years | 28,140 (6.2%) | 29,318 (5.9%) |
| 55 to 59 Years | 29,548 (6.5%) | 33,925 (6.9%) |
| 60 to 64 Years | 31,762 (7.0%) | 33,482 (6.8%) |
| 65 to 69 Years | 25,357 (5.6%) | 30,662 (6.2%) |
| 70 to 74 Years | 18,856 (4.2%) | 22,171 (4.5%) |
| 75 to 79 Years | 11,466 (2.5%) | 17,460 (3.5%) |
| 80 to 84 Years | 6,939 (1.5%) | 12,113 (2.5%) |
| 85 Years and over | 7,766 (1.7%) | 14,761 (3.0%) |
| Total | 454,049 (100.0%) | 493,561 (100.0%) |
Families and Households in Area Code 216
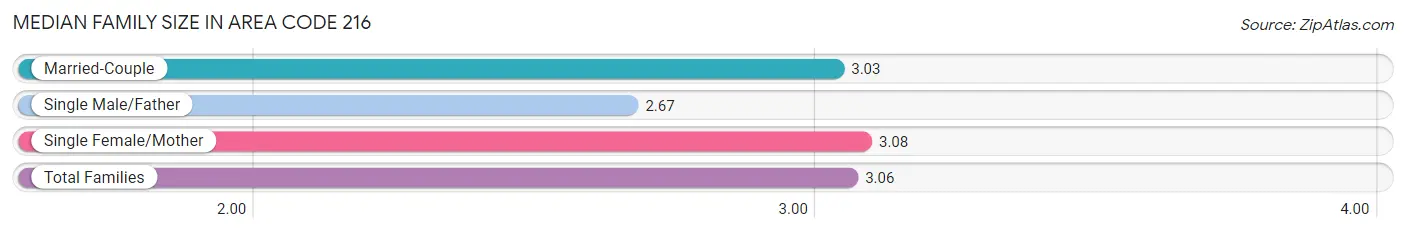
Median Family Size in Area Code 216
The median family size in Area Code 216 is 3.06 persons per family, with single female/mother families (68,340 | 31.5%) accounting for the largest median family size of 3.08184 persons per family. On the other hand, single male/father families (20,670 | 9.5%) represent the smallest median family size with 2.67 persons per family.
| Family Type | # Families | Family Size |
| Married-Couple | 127,955 (59.0%) | 3.03 |
| Single Male/Father | 20,670 (9.5%) | 2.67 |
| Single Female/Mother | 68,340 (31.5%) | 3.08 |
| Total Families | 216,965 (100.0%) | 3.06 |
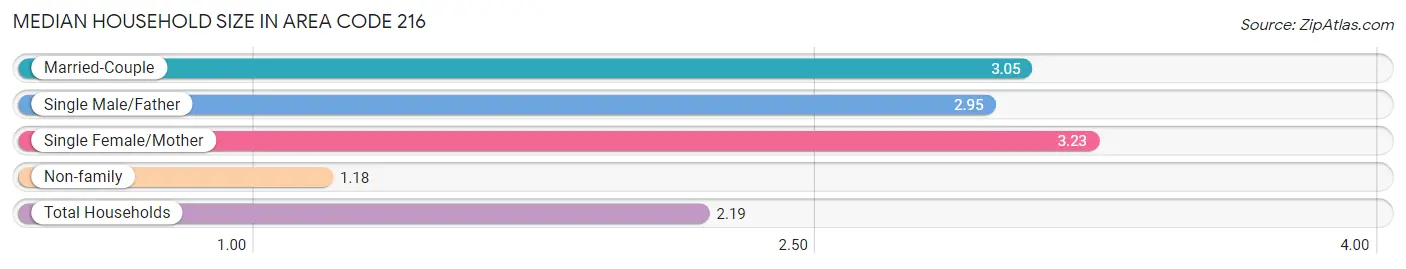
Median Household Size in Area Code 216
The median household size in Area Code 216 is 2.19 persons per household, with single female/mother households (68,340 | 16.2%) accounting for the largest median household size of 3.22947 persons per household. non-family households (205,578 | 48.6%) represent the smallest median household size with 1.18 persons per household.
| Household Type | # Households | Household Size |
| Married-Couple | 127,955 (30.3%) | 3.05 |
| Single Male/Father | 20,670 (4.9%) | 2.95 |
| Single Female/Mother | 68,340 (16.2%) | 3.23 |
| Non-family | 205,578 (48.6%) | 1.18 |
| Total Households | 422,543 (100.0%) | 2.19 |
Household Size by Marriage Status in Area Code 216
Out of a total of 422,543 households in Area Code 216, 216,965 (51.3%) are family households, while 205,578 (48.6%) are nonfamily households. The most numerous type of family households are 2-person households, comprising 102,540, and the most common type of nonfamily households are 1-person households, comprising 173,888.
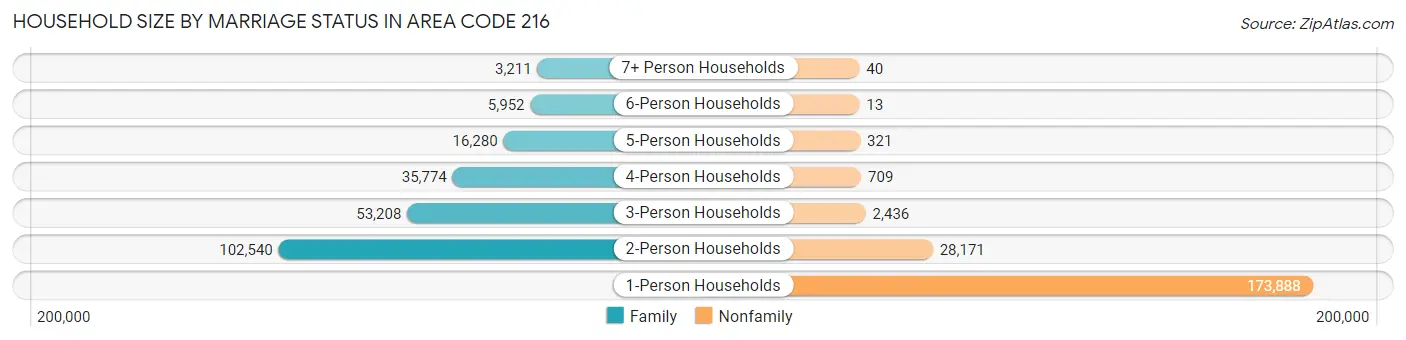
| Household Size | Family Households | Nonfamily Households |
| 1-Person Households | - | 173,888 (41.1%) |
| 2-Person Households | 102,540 (24.3%) | 28,171 (6.7%) |
| 3-Person Households | 53,208 (12.6%) | 2,436 (0.6%) |
| 4-Person Households | 35,774 (8.5%) | 709 (0.2%) |
| 5-Person Households | 16,280 (3.8%) | 321 (0.1%) |
| 6-Person Households | 5,952 (1.4%) | 13 (0.0%) |
| 7+ Person Households | 3,211 (0.8%) | 40 (0.0%) |
| Total | 216,965 (51.3%) | 205,578 (48.6%) |
Female Fertility in Area Code 216
Fertility by Age in Area Code 216
Average fertility rate in Area Code 216 is 51.5 births per 1,000 women. Women in the age bracket of 20 to 34 years have the highest fertility rate with 84.6 births per 1,000 women. Women in the age bracket of 20 to 34 years acount for 73.8% of all women with births.
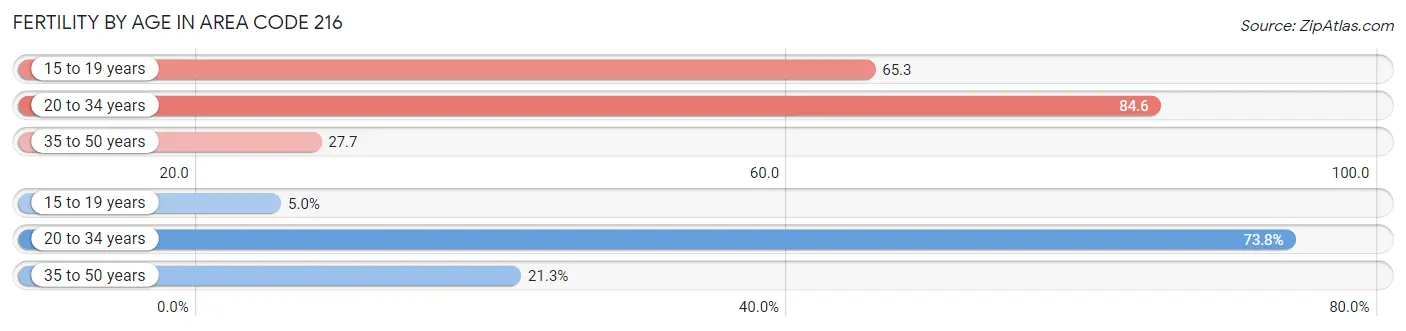
| Age Bracket | Women with Births | Births / 1,000 Women |
| 15 to 19 years | 563 (5.0%) | 65.3 |
| 20 to 34 years | 8,373 (73.8%) | 84.6 |
| 35 to 50 years | 2,411 (21.2%) | 27.7 |
| Total | 11,347 (100.0%) | 51.5 |
Fertility by Age by Marriage Status in Area Code 216
44.2% of women with births (11,347) in Area Code 216 are married. The highest percentage of unmarried women with births falls into 15 to 19 years age bracket with 100.0% of them unmarried at the time of birth, while the lowest percentage of unmarried women with births belong to 35 to 50 years age bracket with 56.3% of them unmarried.
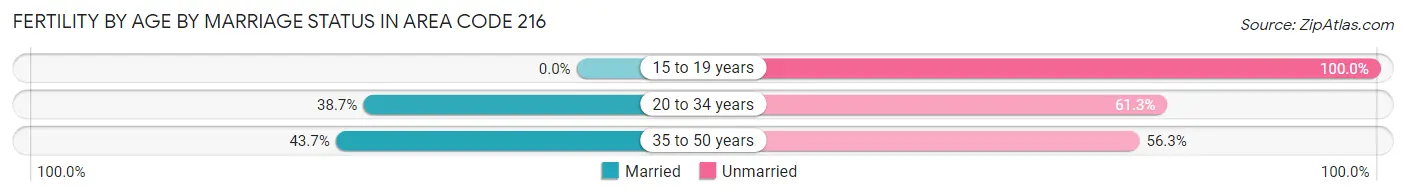
| Age Bracket | Married | Unmarried |
| 15 to 19 years | 0 (0.0%) | 563 (100.0%) |
| 20 to 34 years | 3,237 (38.7%) | 5,136 (61.3%) |
| 35 to 50 years | 1,053 (43.7%) | 1,358 (56.3%) |
| Total | 5,021 (44.3%) | 6,326 (55.7%) |
Fertility by Education in Area Code 216
Average fertility rate in Area Code 216 is 51.5 births per 1,000 women. Women with the education attainment of graduate degree have the highest fertility rate of 73.2 births per 1,000 women, while women with the education attainment of college or associate's degree have the lowest fertility at 48.3 births per 1,000 women. Women with the education attainment of college or associate's degree represent 27.9% of all women with births.
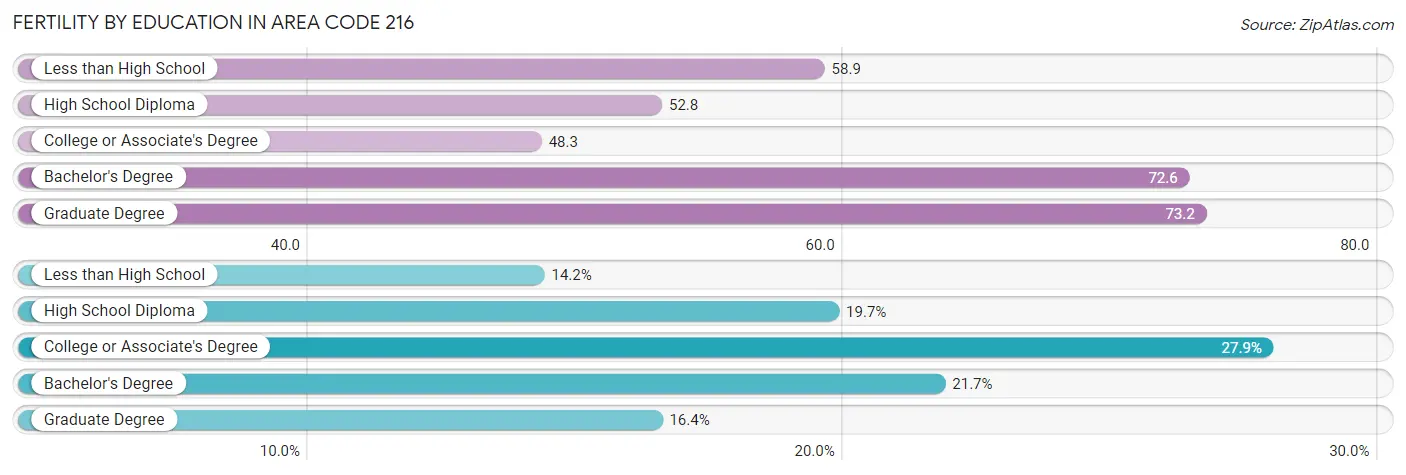
| Educational Attainment | Women with Births | Births / 1,000 Women |
| Less than High School | 1,614 (14.2%) | 58.9 |
| High School Diploma | 2,240 (19.7%) | 52.8 |
| College or Associate's Degree | 3,163 (27.9%) | 48.3 |
| Bachelor's Degree | 2,466 (21.7%) | 72.6 |
| Graduate Degree | 1,864 (16.4%) | 73.2 |
| Total | 11,347 (100.0%) | 51.5 |
Fertility by Education by Marriage Status in Area Code 216
55.7% of women with births in Area Code 216 are unmarried. Women with the educational attainment of bachelor's degree are most likely to be married with 58.1% of them married at childbirth, while women with the educational attainment of less than high school are least likely to be married with 86.8% of them unmarried at childbirth.
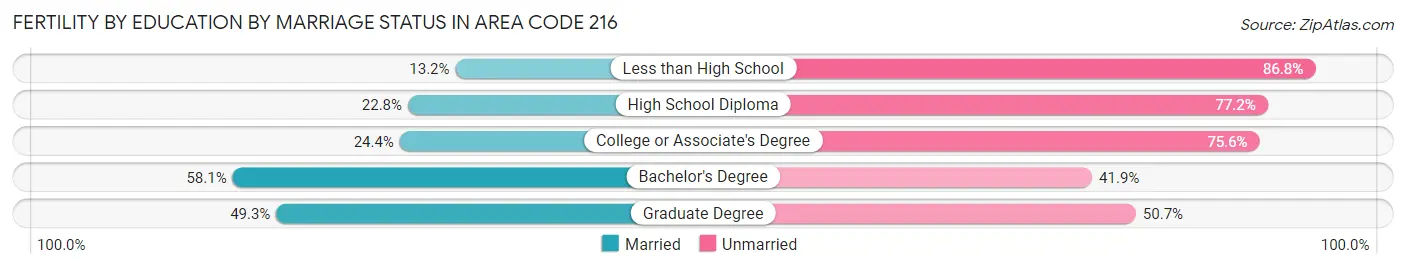
| Educational Attainment | Married | Unmarried |
| Less than High School | 213 (13.2%) | 1,401 (86.8%) |
| High School Diploma | 510 (22.8%) | 1,730 (77.2%) |
| College or Associate's Degree | 772 (24.4%) | 2,391 (75.6%) |
| Bachelor's Degree | 1,433 (58.1%) | 1,033 (41.9%) |
| Graduate Degree | 919 (49.3%) | 945 (50.7%) |
| Total | 5,021 (44.3%) | 6,326 (55.7%) |
Employment Characteristics in Area Code 216
Employment by Class of Employer in Area Code 216
Among the 439,631 employed individuals in Area Code 216, private company employees (288,581 | 65.6%), not-for-profit organizations (64,061 | 14.6%), and local government employees (33,172 | 7.5%) make up the most common classes of employment.
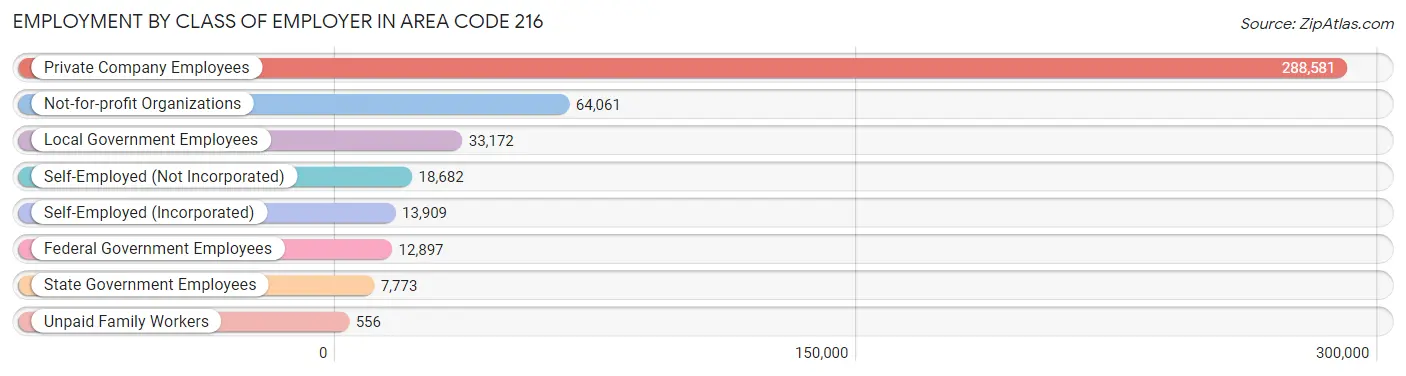
| Employer Class | # Employees | % Employees |
| Private Company Employees | 288,581 | 65.6% |
| Self-Employed (Incorporated) | 13,909 | 3.2% |
| Self-Employed (Not Incorporated) | 18,682 | 4.3% |
| Not-for-profit Organizations | 64,061 | 14.6% |
| Local Government Employees | 33,172 | 7.5% |
| State Government Employees | 7,773 | 1.8% |
| Federal Government Employees | 12,897 | 2.9% |
| Unpaid Family Workers | 556 | 0.1% |
| Total | 439,631 | 100.0% |
Employment Status by Age in Area Code 216
According to the labor force statistics for Area Code 216, out of the total population over 16 years of age (773,741), 62.3% or 481,886 individuals are in the labor force, with 8.9% or 42,984 of them unemployed. The age group with the highest labor force participation rate is 30 to 34 years, with 85.3% or 59,817 individuals in the labor force. Within the labor force, the 16 to 19 years age range has the highest percentage of unemployed individuals, with 1,051.0% or 215,760 of them being unemployed.
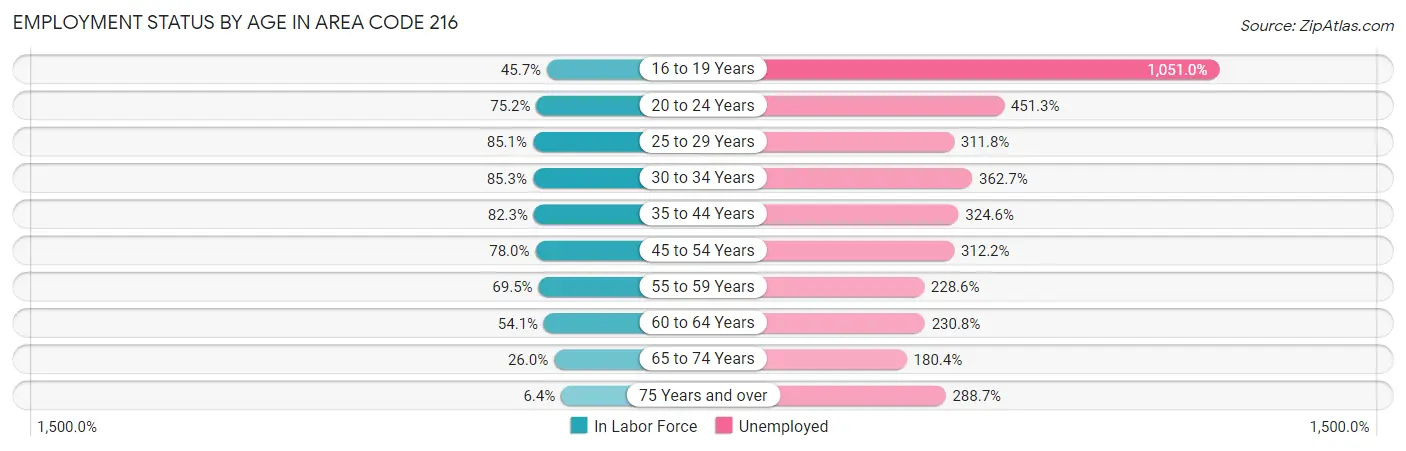
| Age Bracket | In Labor Force | Unemployed |
| 16 to 19 Years | 20,530 (45.7%) | 215,760 (1,051.0%) |
| 20 to 24 Years | 47,626 (75.2%) | 214,927 (451.3%) |
| 25 to 29 Years | 63,878 (85.1%) | 199,165 (311.8%) |
| 30 to 34 Years | 59,817 (85.3%) | 216,956 (362.7%) |
| 35 to 44 Years | 93,987 (82.3%) | 305,069 (324.6%) |
| 45 to 54 Years | 85,640 (78.0%) | 267,377 (312.2%) |
| 55 to 59 Years | 44,102 (69.5%) | 100,815 (228.6%) |
| 60 to 64 Years | 35,302 (54.1%) | 81,482 (230.8%) |
| 65 to 74 Years | 25,245 (26.0%) | 45,537 (180.4%) |
| 75 Years and over | 4,528 (6.4%) | 13,067 (288.7%) |
| Total | 481,857 (62.3%) | 42,964 (8.9%) |
Employment Status by Educational Attainment in Area Code 216
According to labor force statistics for Area Code 216, 77.0% of individuals (383,219) out of the total population between 25 and 64 years of age (497,946) are in the labor force, with 294.5% or 1,128,580 of them being unemployed. The group with the highest labor force participation rate are those with the educational attainment of bachelor's degree or higher, with 86.2% or 147,149 individuals in the labor force. Within the labor force, individuals with less than high school education have the highest percentage of unemployment, with 596.2% or 149,765 of them being unemployed.
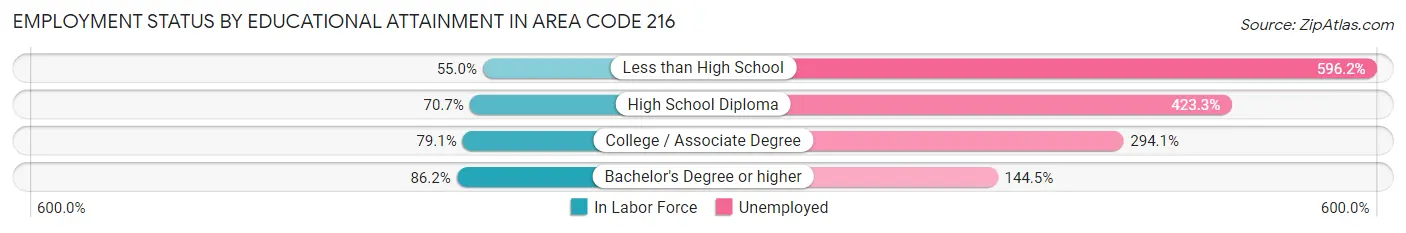
| Educational Attainment | In Labor Force | Unemployed |
| Less than High School | 25,120 (55.0%) | 272,404 (596.2%) |
| High School Diploma | 93,602 (70.7%) | 560,627 (423.3%) |
| College / Associate Degree | 118,019 (79.1%) | 438,759 (294.1%) |
| Bachelor's Degree or higher | 147,148 (86.2%) | 246,556 (144.5%) |
| Total | 383,196 (77.0%) | 1,466,451 (294.5%) |
Employment Occupations by Sex in Area Code 216
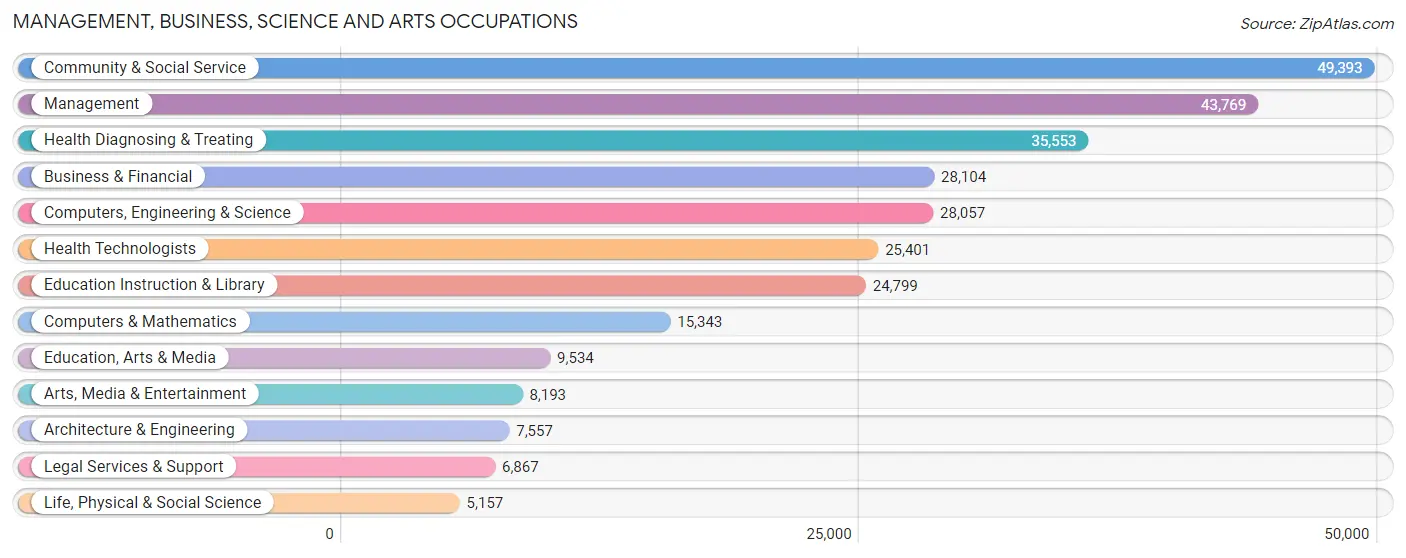
Management, Business, Science and Arts Occupations
The most common Management, Business, Science and Arts occupations in Area Code 216 are Community & Social Service (49,393 | 11.0%), Management (43,769 | 9.7%), Health Diagnosing & Treating (35,553 | 7.9%), Business & Financial (28,104 | 6.2%), and Computers, Engineering & Science (28,057 | 6.2%).
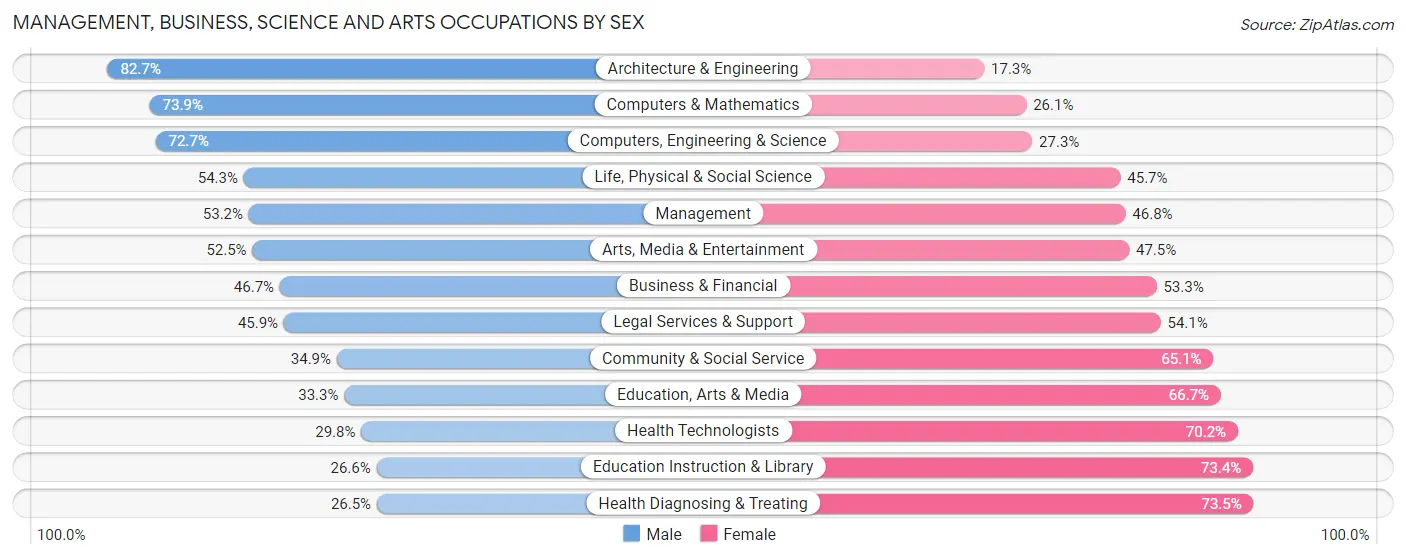
Management, Business, Science and Arts Occupations by Sex
Within the Management, Business, Science and Arts occupations in Area Code 216, the most male-oriented occupations are Architecture & Engineering (82.7%), Computers & Mathematics (73.9%), and Computers, Engineering & Science (72.7%), while the most female-oriented occupations are Health Diagnosing & Treating (73.5%), Education Instruction & Library (73.4%), and Health Technologists (70.2%).
| Occupation | Male | Female |
| Management | 23,293 (53.2%) | 20,476 (46.8%) |
| Business & Financial | 13,136 (46.7%) | 14,968 (53.3%) |
| Computers, Engineering & Science | 20,389 (72.7%) | 7,668 (27.3%) |
| Computers & Mathematics | 11,340 (73.9%) | 4,003 (26.1%) |
| Architecture & Engineering | 6,250 (82.7%) | 1,307 (17.3%) |
| Life, Physical & Social Science | 2,799 (54.3%) | 2,358 (45.7%) |
| Community & Social Service | 17,219 (34.9%) | 32,174 (65.1%) |
| Education, Arts & Media | 3,176 (33.3%) | 6,358 (66.7%) |
| Legal Services & Support | 3,152 (45.9%) | 3,715 (54.1%) |
| Education Instruction & Library | 6,592 (26.6%) | 18,207 (73.4%) |
| Arts, Media & Entertainment | 4,299 (52.5%) | 3,894 (47.5%) |
| Health Diagnosing & Treating | 9,423 (26.5%) | 26,130 (73.5%) |
| Health Technologists | 7,559 (29.8%) | 17,842 (70.2%) |
| Total (Category) | 83,460 (45.1%) | 101,416 (54.9%) |
| Total (Overall) | 221,738 (49.3%) | 227,700 (50.7%) |
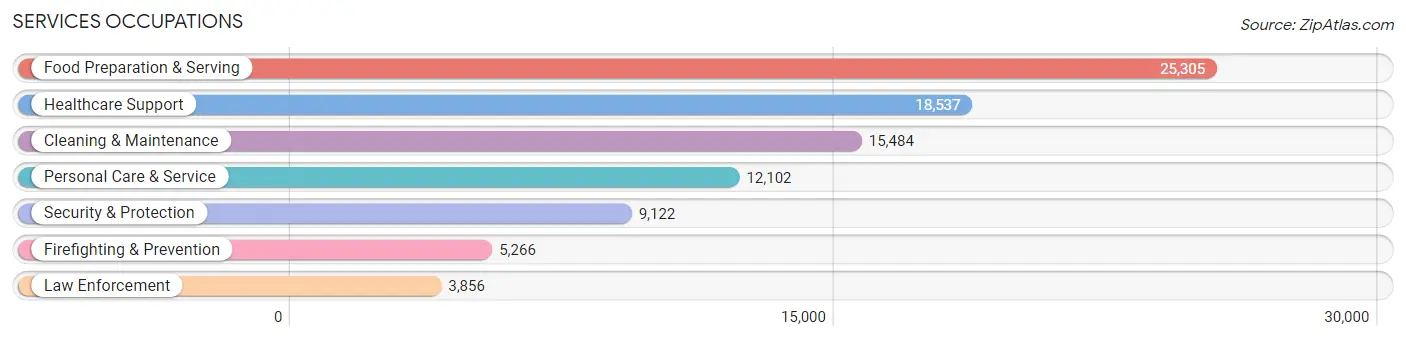
Services Occupations
The most common Services occupations in Area Code 216 are Food Preparation & Serving (25,305 | 5.6%), Healthcare Support (18,537 | 4.1%), Cleaning & Maintenance (15,484 | 3.5%), Personal Care & Service (12,102 | 2.7%), and Security & Protection (9,122 | 2.0%).
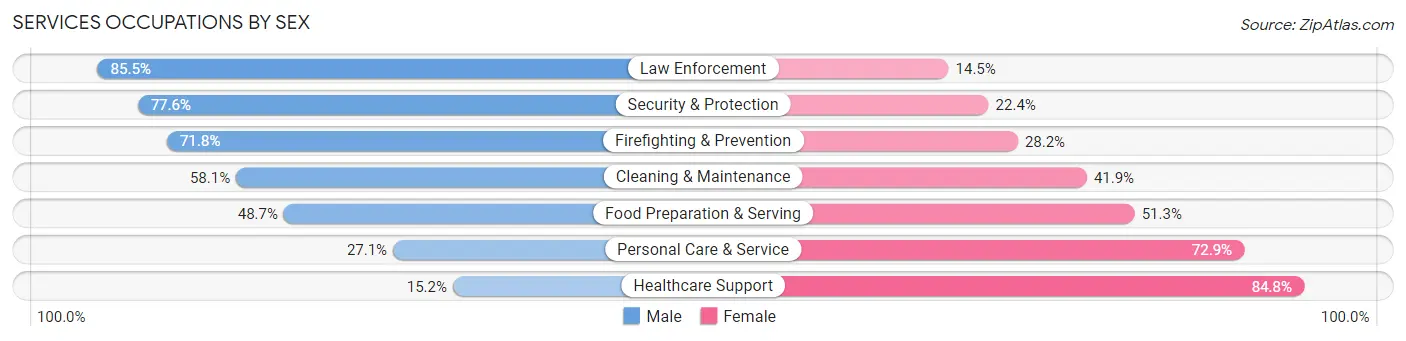
Services Occupations by Sex
Within the Services occupations in Area Code 216, the most male-oriented occupations are Law Enforcement (85.5%), Security & Protection (77.6%), and Firefighting & Prevention (71.8%), while the most female-oriented occupations are Healthcare Support (84.8%), Personal Care & Service (72.9%), and Food Preparation & Serving (51.3%).
| Occupation | Male | Female |
| Healthcare Support | 2,818 (15.2%) | 15,719 (84.8%) |
| Security & Protection | 7,079 (77.6%) | 2,043 (22.4%) |
| Firefighting & Prevention | 3,781 (71.8%) | 1,485 (28.2%) |
| Law Enforcement | 3,298 (85.5%) | 558 (14.5%) |
| Food Preparation & Serving | 12,319 (48.7%) | 12,986 (51.3%) |
| Cleaning & Maintenance | 9,003 (58.1%) | 6,481 (41.9%) |
| Personal Care & Service | 3,275 (27.1%) | 8,827 (72.9%) |
| Total (Category) | 34,494 (42.8%) | 46,056 (57.2%) |
| Total (Overall) | 221,738 (49.3%) | 227,700 (50.7%) |
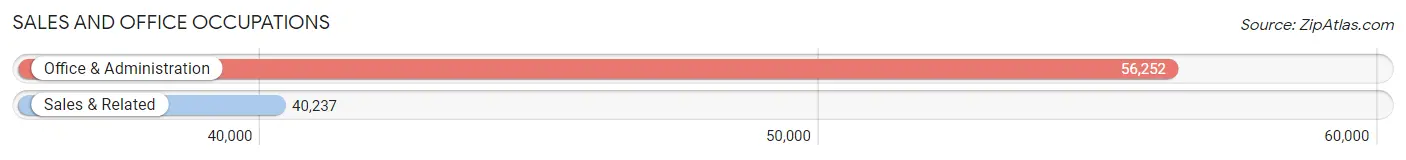
Sales and Office Occupations
The most common Sales and Office occupations in Area Code 216 are Office & Administration (56,252 | 12.5%), and Sales & Related (40,237 | 8.9%).
Sales and Office Occupations by Sex
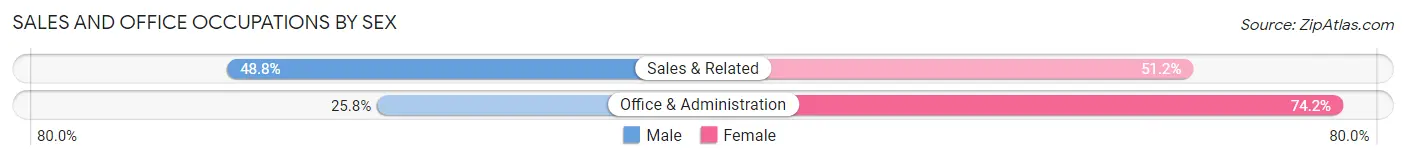
| Occupation | Male | Female |
| Sales & Related | 19,643 (48.8%) | 20,594 (51.2%) |
| Office & Administration | 14,509 (25.8%) | 41,743 (74.2%) |
| Total (Category) | 34,152 (35.4%) | 62,337 (64.6%) |
| Total (Overall) | 221,738 (49.3%) | 227,700 (50.7%) |
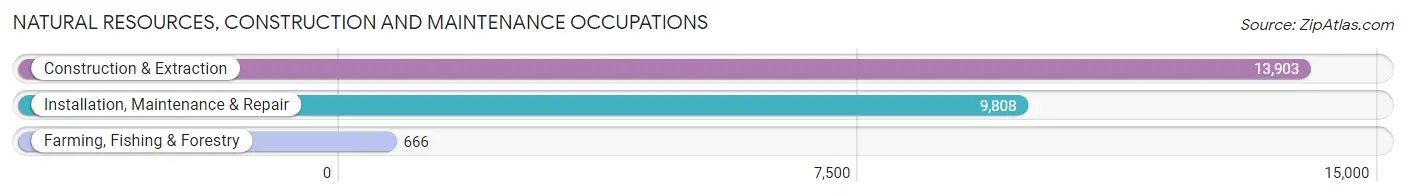
Natural Resources, Construction and Maintenance Occupations
The most common Natural Resources, Construction and Maintenance occupations in Area Code 216 are Construction & Extraction (13,903 | 3.1%), Installation, Maintenance & Repair (9,808 | 2.2%), and Farming, Fishing & Forestry (666 | 0.2%).
Natural Resources, Construction and Maintenance Occupations by Sex
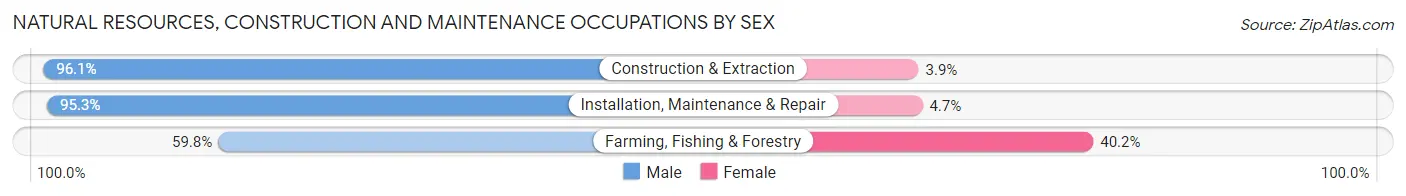
| Occupation | Male | Female |
| Farming, Fishing & Forestry | 398 (59.8%) | 268 (40.2%) |
| Construction & Extraction | 13,362 (96.1%) | 541 (3.9%) |
| Installation, Maintenance & Repair | 9,348 (95.3%) | 460 (4.7%) |
| Total (Category) | 23,108 (94.8%) | 1,269 (5.2%) |
| Total (Overall) | 221,738 (49.3%) | 227,700 (50.7%) |
Production, Transportation and Moving Occupations
The most common Production, Transportation and Moving occupations in Area Code 216 are Production (27,790 | 6.2%), Material Moving (19,594 | 4.4%), and Transportation (15,762 | 3.5%).
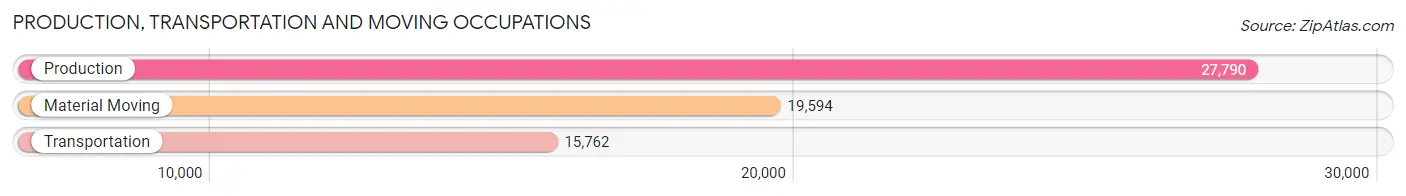
Production, Transportation and Moving Occupations by Sex
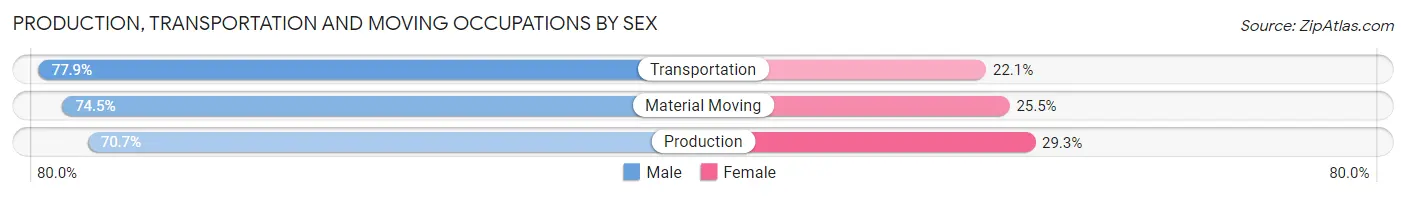
| Occupation | Male | Female |
| Production | 19,652 (70.7%) | 8,138 (29.3%) |
| Transportation | 12,280 (77.9%) | 3,482 (22.1%) |
| Material Moving | 14,592 (74.5%) | 5,002 (25.5%) |
| Total (Category) | 46,524 (73.7%) | 16,622 (26.3%) |
| Total (Overall) | 221,738 (49.3%) | 227,700 (50.7%) |
Employment Industries by Sex in Area Code 216
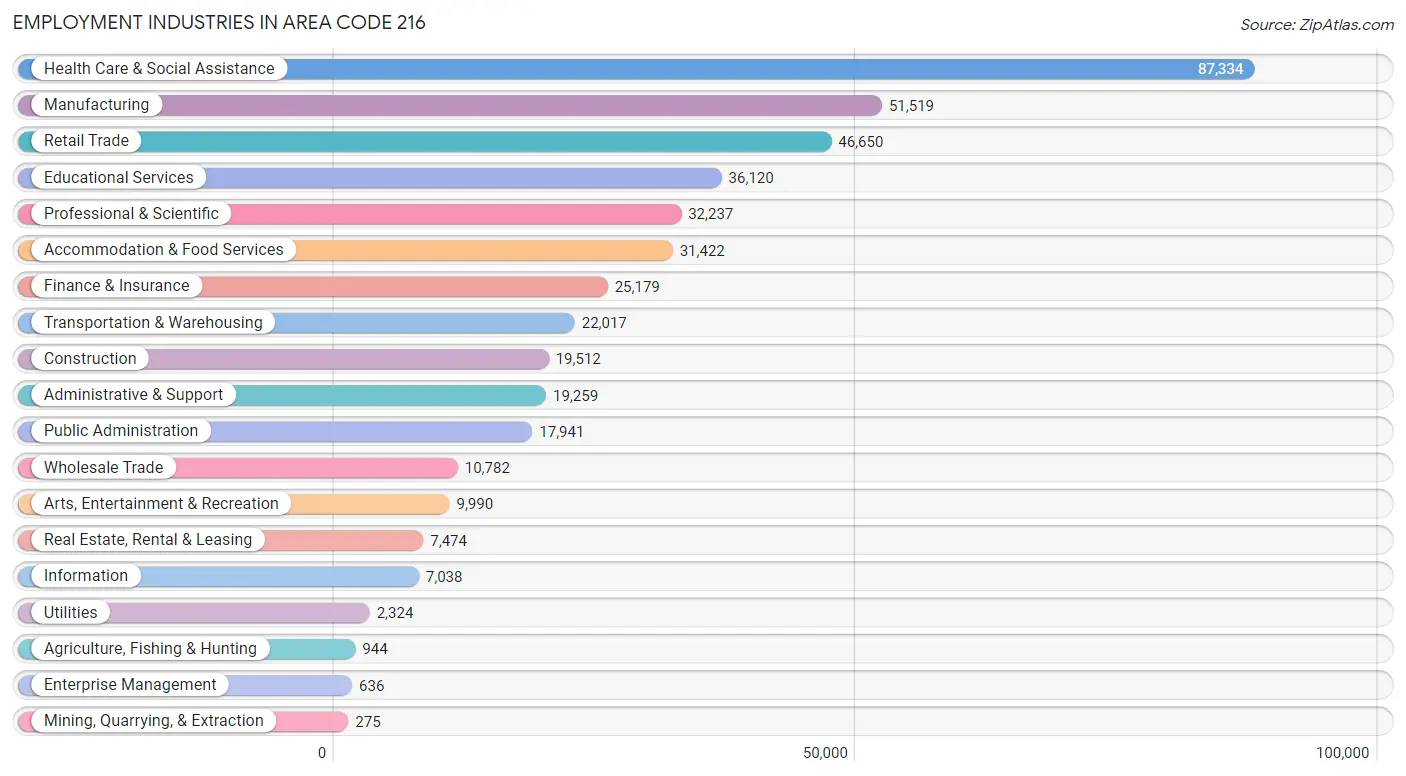
Employment Industries in Area Code 216
The major employment industries in Area Code 216 include Health Care & Social Assistance (87,334 | 19.4%), Manufacturing (51,519 | 11.5%), Retail Trade (46,650 | 10.4%), Educational Services (36,120 | 8.0%), and Professional & Scientific (32,237 | 7.2%).
Employment Industries by Sex in Area Code 216
The Area Code 216 industries that see more men than women are Construction (90.6%), Mining, Quarrying, & Extraction (84.0%), and Utilities (73.3%), whereas the industries that tend to have a higher number of women are Health Care & Social Assistance (75.3%), Educational Services (68.5%), and Enterprise Management (61.0%).
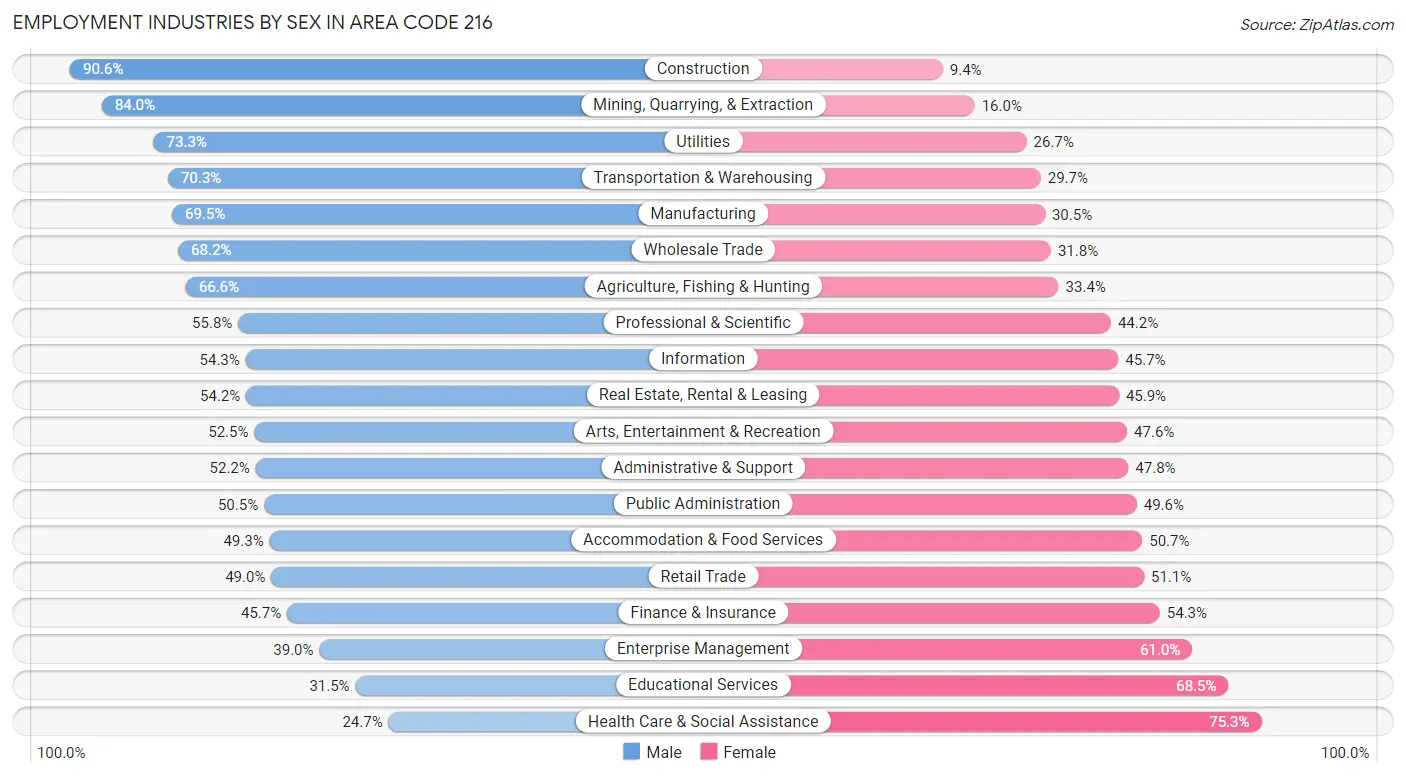
| Industry | Male | Female |
| Agriculture, Fishing & Hunting | 629 (66.6%) | 315 (33.4%) |
| Mining, Quarrying, & Extraction | 231 (84.0%) | 44 (16.0%) |
| Construction | 17,676 (90.6%) | 1,836 (9.4%) |
| Manufacturing | 35,783 (69.5%) | 15,736 (30.5%) |
| Wholesale Trade | 7,354 (68.2%) | 3,428 (31.8%) |
| Retail Trade | 22,836 (48.9%) | 23,814 (51.0%) |
| Transportation & Warehousing | 15,483 (70.3%) | 6,534 (29.7%) |
| Utilities | 1,703 (73.3%) | 621 (26.7%) |
| Information | 3,819 (54.3%) | 3,219 (45.7%) |
| Finance & Insurance | 11,502 (45.7%) | 13,677 (54.3%) |
| Real Estate, Rental & Leasing | 4,047 (54.1%) | 3,427 (45.9%) |
| Professional & Scientific | 17,987 (55.8%) | 14,250 (44.2%) |
| Enterprise Management | 248 (39.0%) | 388 (61.0%) |
| Administrative & Support | 10,052 (52.2%) | 9,207 (47.8%) |
| Educational Services | 11,385 (31.5%) | 24,735 (68.5%) |
| Health Care & Social Assistance | 21,557 (24.7%) | 65,777 (75.3%) |
| Arts, Entertainment & Recreation | 5,240 (52.4%) | 4,750 (47.5%) |
| Accommodation & Food Services | 15,493 (49.3%) | 15,929 (50.7%) |
| Public Administration | 9,052 (50.4%) | 8,889 (49.5%) |
| Total | 221,738 (49.3%) | 227,700 (50.7%) |
Education in Area Code 216
School Enrollment in Area Code 216
The most common levels of schooling among the 215,784 students in Area Code 216 are high school (46,210 | 21.4%), college / undergraduate (44,222 | 20.5%), and middle school (43,259 | 20.1%).
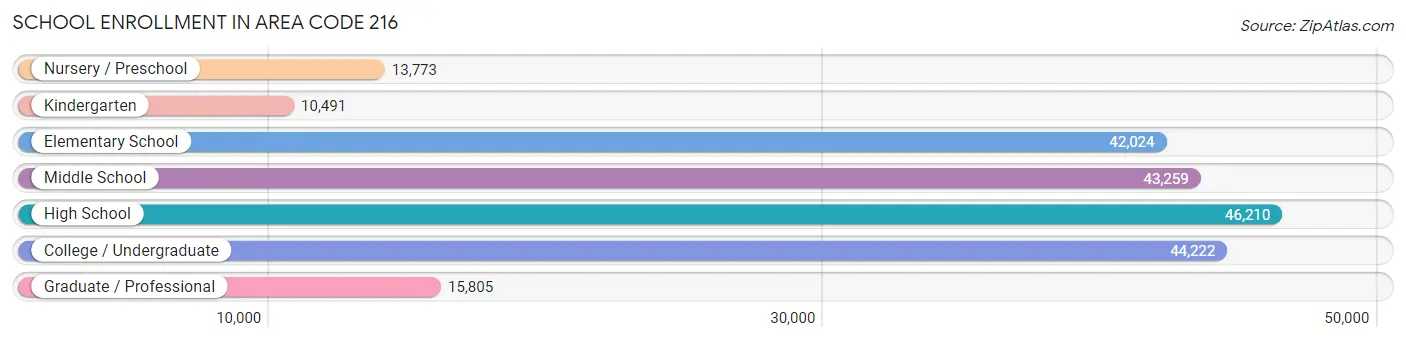
| School Level | # Students | % Students |
| Nursery / Preschool | 13,773 | 6.4% |
| Kindergarten | 10,491 | 4.9% |
| Elementary School | 42,024 | 19.5% |
| Middle School | 43,259 | 20.1% |
| High School | 46,210 | 21.4% |
| College / Undergraduate | 44,222 | 20.5% |
| Graduate / Professional | 15,805 | 7.3% |
| Total | 215,784 | 100.0% |
School Enrollment by Age by Funding Source in Area Code 216
Out of a total of 215,784 students who are enrolled in schools in Area Code 216, 57,360 (26.6%) attend a private institution, while the remaining 158,424 (73.4%) are enrolled in public schools. The age group of 3 to 4 year olds has the highest likelihood of being enrolled in private schools, with 4,603 (43.2% in the age bracket) enrolled. Conversely, the age group of 15 to 17 year olds has the lowest likelihood of being enrolled in a private school, with 25,589 (79.3% in the age bracket) attending a public institution.
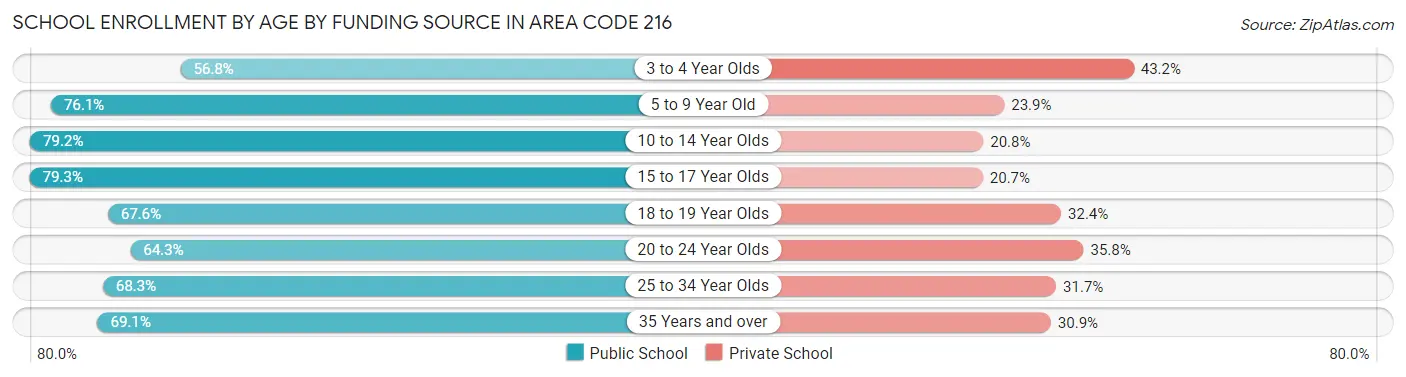
| Age Bracket | Public School | Private School |
| 3 to 4 Year Olds | 6,044 (56.8%) | 4,603 (43.2%) |
| 5 to 9 Year Old | 37,799 (76.1%) | 11,892 (23.9%) |
| 10 to 14 Year Olds | 42,654 (79.2%) | 11,206 (20.8%) |
| 15 to 17 Year Olds | 25,589 (79.3%) | 6,695 (20.7%) |
| 18 to 19 Year Olds | 11,296 (67.6%) | 5,415 (32.4%) |
| 20 to 24 Year Olds | 15,459 (64.2%) | 8,603 (35.7%) |
| 25 to 34 Year Olds | 11,368 (68.3%) | 5,267 (31.7%) |
| 35 Years and over | 8,221 (69.1%) | 3,673 (30.9%) |
| Total | 158,424 (73.4%) | 57,360 (26.6%) |
Educational Attainment by Field of Study in Area Code 216
Business (43,317 | 18.4%), education (25,060 | 10.6%), science & technology (24,996 | 10.6%), social sciences (19,977 | 8.5%), and bio, nature & agricultural (15,701 | 6.7%) are the most common fields of study among 235,494 individuals in Area Code 216 who have obtained a bachelor's degree or higher.
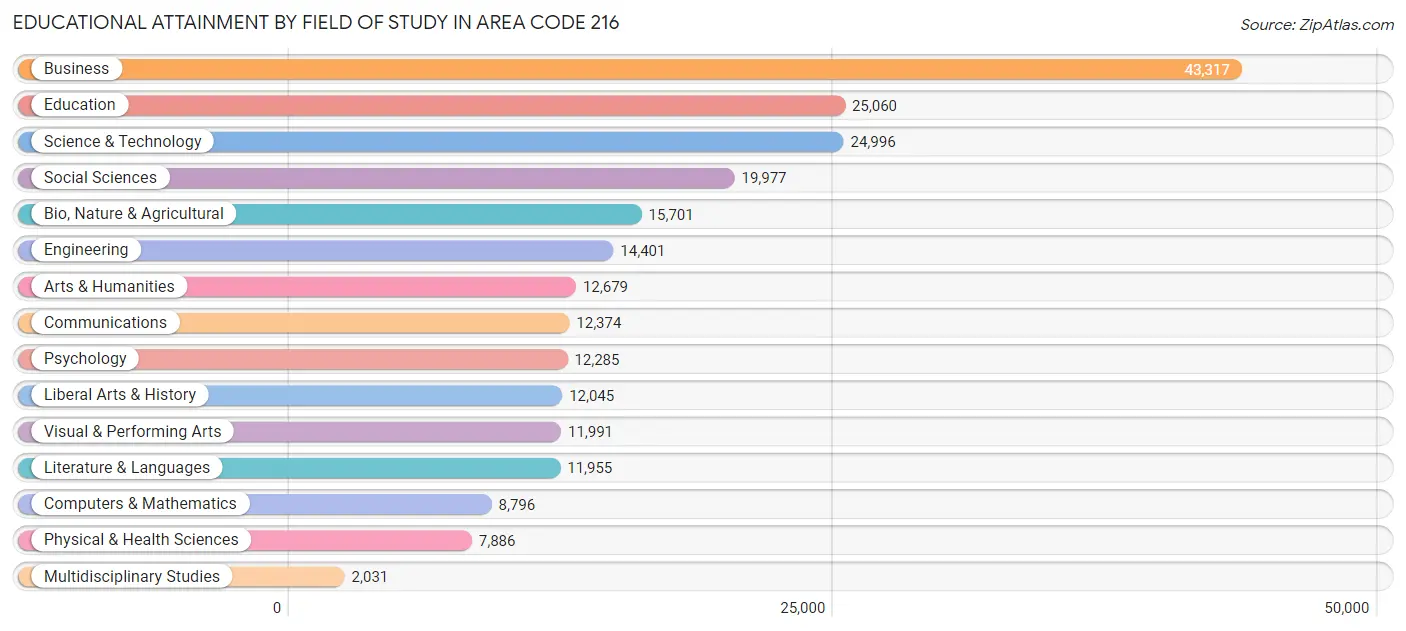
| Field of Study | # Graduates | % Graduates |
| Computers & Mathematics | 8,796 | 3.7% |
| Bio, Nature & Agricultural | 15,701 | 6.7% |
| Physical & Health Sciences | 7,886 | 3.4% |
| Psychology | 12,285 | 5.2% |
| Social Sciences | 19,977 | 8.5% |
| Engineering | 14,401 | 6.1% |
| Multidisciplinary Studies | 2,031 | 0.9% |
| Science & Technology | 24,996 | 10.6% |
| Business | 43,317 | 18.4% |
| Education | 25,060 | 10.6% |
| Literature & Languages | 11,955 | 5.1% |
| Liberal Arts & History | 12,045 | 5.1% |
| Visual & Performing Arts | 11,991 | 5.1% |
| Communications | 12,374 | 5.2% |
| Arts & Humanities | 12,679 | 5.4% |
| Total | 235,494 | 100.0% |
Transportation & Commute in Area Code 216
Vehicle Availability by Sex in Area Code 216
The most prevalent vehicle ownership categories in Area Code 216 are males with 2 vehicles (96,323, accounting for 44.5%) and females with 2 vehicles (88,691, making up 43.8%).
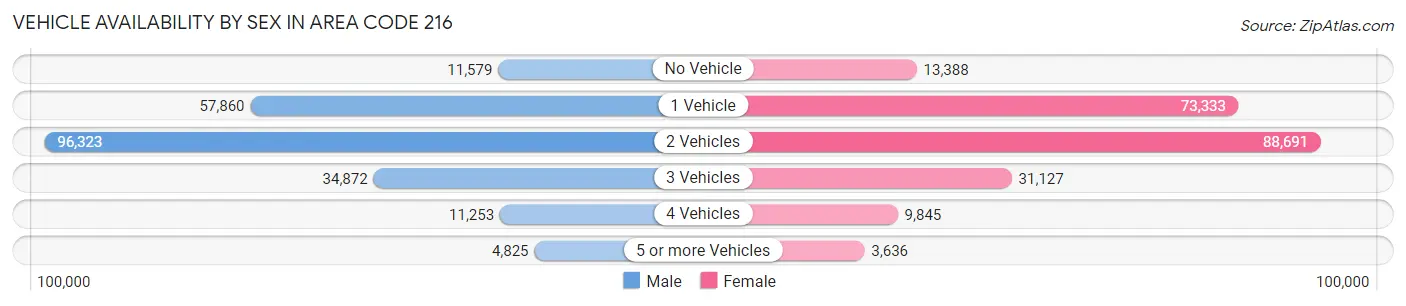
| Vehicles Available | Male | Female |
| No Vehicle | 11,579 (5.3%) | 13,388 (6.1%) |
| 1 Vehicle | 57,860 (26.7%) | 73,333 (33.3%) |
| 2 Vehicles | 96,323 (44.5%) | 88,691 (40.3%) |
| 3 Vehicles | 34,872 (16.1%) | 31,127 (14.1%) |
| 4 Vehicles | 11,253 (5.2%) | 9,845 (4.5%) |
| 5 or more Vehicles | 4,825 (2.2%) | 3,636 (1.7%) |
| Total | 216,712 (100.0%) | 220,020 (100.0%) |
Commute Time in Area Code 216
The most frequently occuring commute durations in Area Code 216 are 20 to 24 minutes (73,964 commuters, 18.9%), 15 to 19 minutes (67,158 commuters, 17.1%), and 30 to 34 minutes (58,725 commuters, 15.0%).
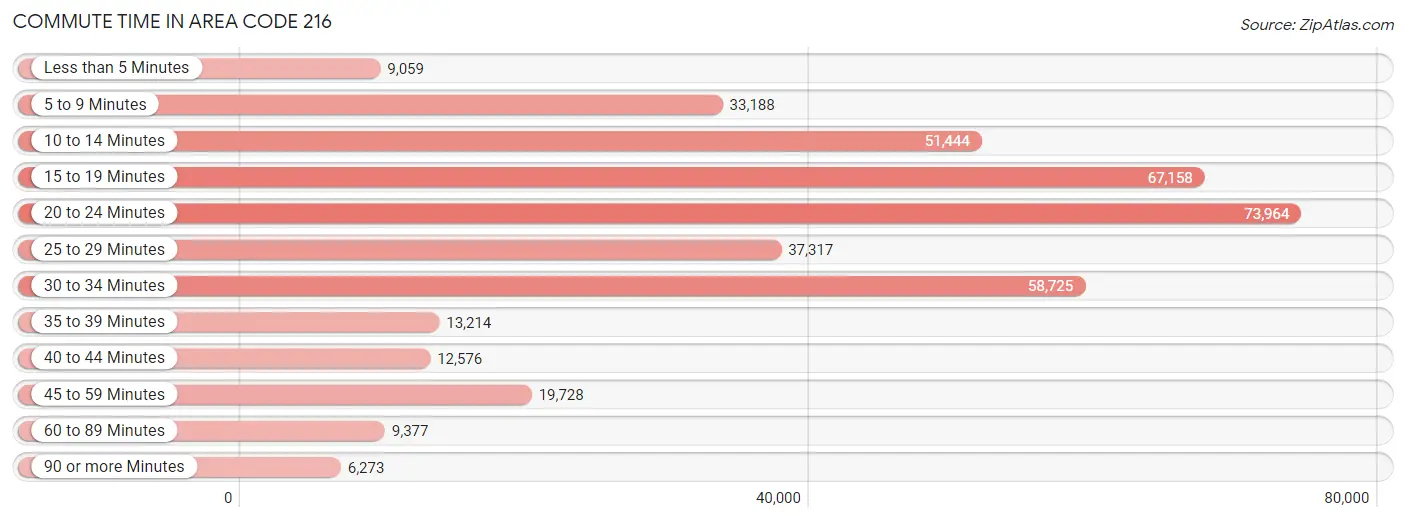
| Commute Time | # Commuters | % Commuters |
| Less than 5 Minutes | 9,059 | 2.3% |
| 5 to 9 Minutes | 33,188 | 8.5% |
| 10 to 14 Minutes | 51,444 | 13.1% |
| 15 to 19 Minutes | 67,158 | 17.1% |
| 20 to 24 Minutes | 73,964 | 18.9% |
| 25 to 29 Minutes | 37,317 | 9.5% |
| 30 to 34 Minutes | 58,725 | 15.0% |
| 35 to 39 Minutes | 13,214 | 3.4% |
| 40 to 44 Minutes | 12,576 | 3.2% |
| 45 to 59 Minutes | 19,728 | 5.0% |
| 60 to 89 Minutes | 9,377 | 2.4% |
| 90 or more Minutes | 6,273 | 1.6% |
Commute Time by Sex in Area Code 216
The most common commute times in Area Code 216 are 20 to 24 minutes (36,456 commuters, 18.6%) for males and 20 to 24 minutes (37,508 commuters, 19.2%) for females.
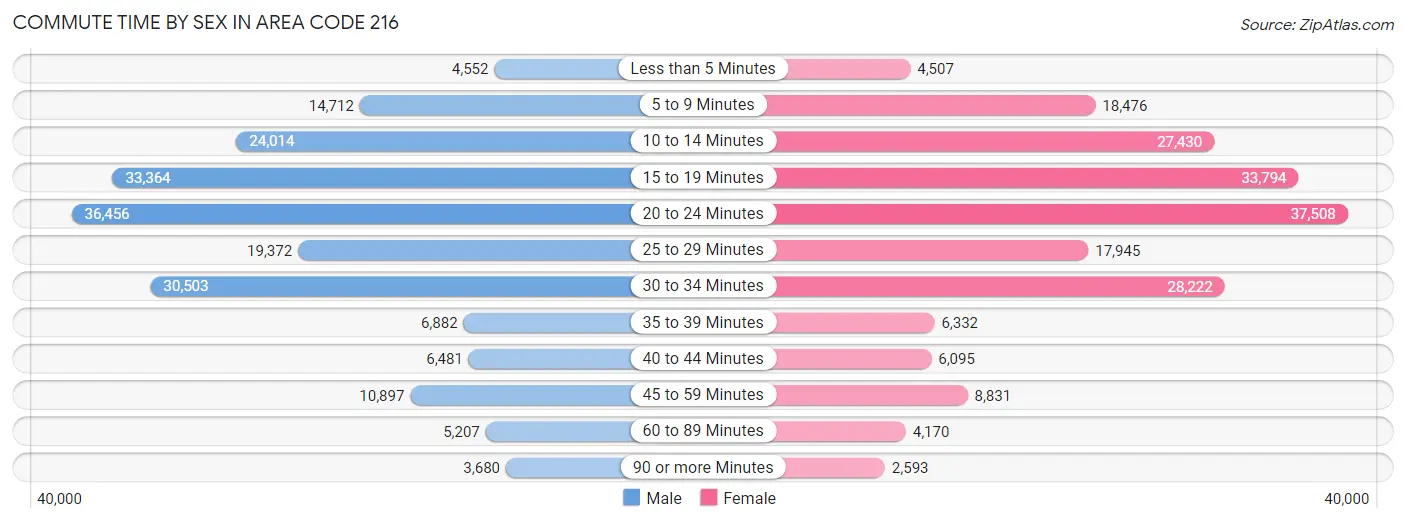
| Commute Time | Male | Female |
| Less than 5 Minutes | 4,552 (2.3%) | 4,507 (2.3%) |
| 5 to 9 Minutes | 14,712 (7.5%) | 18,476 (9.4%) |
| 10 to 14 Minutes | 24,014 (12.2%) | 27,430 (14.0%) |
| 15 to 19 Minutes | 33,364 (17.0%) | 33,794 (17.2%) |
| 20 to 24 Minutes | 36,456 (18.6%) | 37,508 (19.2%) |
| 25 to 29 Minutes | 19,372 (9.9%) | 17,945 (9.2%) |
| 30 to 34 Minutes | 30,503 (15.5%) | 28,222 (14.4%) |
| 35 to 39 Minutes | 6,882 (3.5%) | 6,332 (3.2%) |
| 40 to 44 Minutes | 6,481 (3.3%) | 6,095 (3.1%) |
| 45 to 59 Minutes | 10,897 (5.6%) | 8,831 (4.5%) |
| 60 to 89 Minutes | 5,207 (2.7%) | 4,170 (2.1%) |
| 90 or more Minutes | 3,680 (1.9%) | 2,593 (1.3%) |
Time of Departure to Work by Sex in Area Code 216
The most frequent times of departure to work in Area Code 216 are 7:00 AM to 7:29 AM (24,329, 12.4%) for males and 7:00 AM to 7:29 AM (27,236, 13.9%) for females.
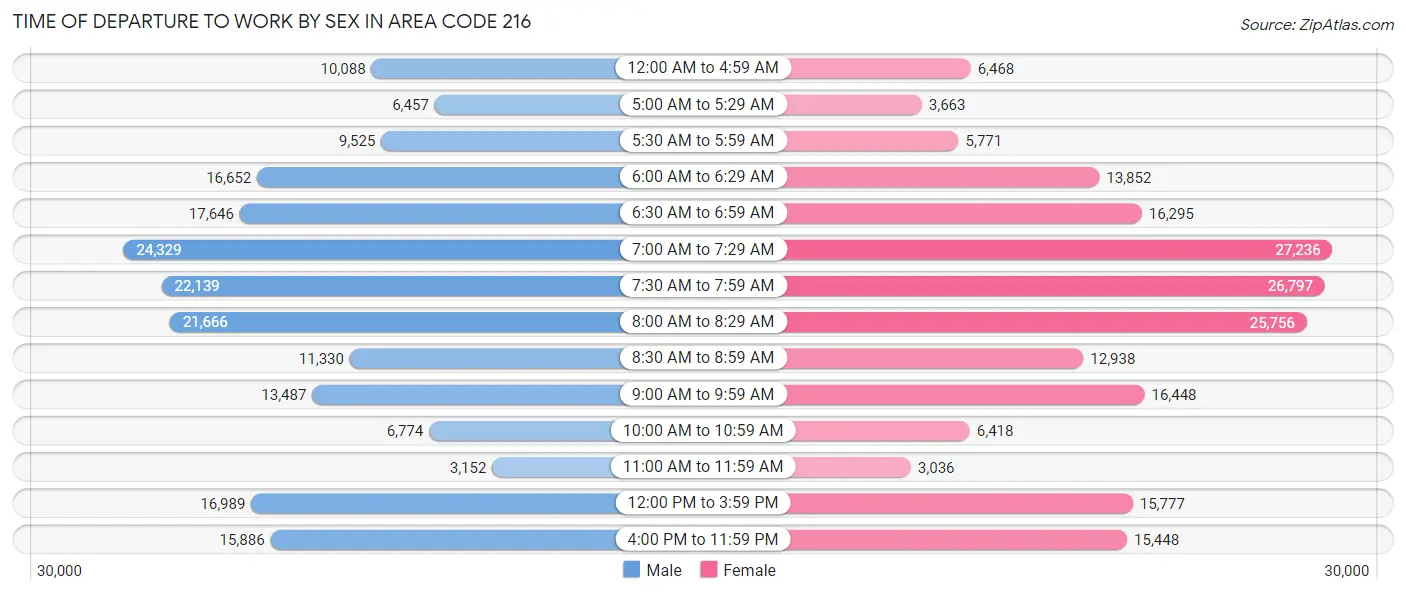
| Time of Departure | Male | Female |
| 12:00 AM to 4:59 AM | 10,088 (5.1%) | 6,468 (3.3%) |
| 5:00 AM to 5:29 AM | 6,457 (3.3%) | 3,663 (1.9%) |
| 5:30 AM to 5:59 AM | 9,525 (4.9%) | 5,771 (2.9%) |
| 6:00 AM to 6:29 AM | 16,652 (8.5%) | 13,852 (7.1%) |
| 6:30 AM to 6:59 AM | 17,646 (9.0%) | 16,295 (8.3%) |
| 7:00 AM to 7:29 AM | 24,329 (12.4%) | 27,236 (13.9%) |
| 7:30 AM to 7:59 AM | 22,139 (11.3%) | 26,797 (13.7%) |
| 8:00 AM to 8:29 AM | 21,666 (11.1%) | 25,756 (13.2%) |
| 8:30 AM to 8:59 AM | 11,330 (5.8%) | 12,938 (6.6%) |
| 9:00 AM to 9:59 AM | 13,487 (6.9%) | 16,448 (8.4%) |
| 10:00 AM to 10:59 AM | 6,774 (3.5%) | 6,418 (3.3%) |
| 11:00 AM to 11:59 AM | 3,152 (1.6%) | 3,036 (1.5%) |
| 12:00 PM to 3:59 PM | 16,989 (8.7%) | 15,777 (8.1%) |
| 4:00 PM to 11:59 PM | 15,886 (8.1%) | 15,448 (7.9%) |
| Total | 196,120 (100.0%) | 195,903 (100.0%) |
Housing Occupancy in Area Code 216
Occupancy by Ownership in Area Code 216
Of the total 422,543 dwellings in Area Code 216, owner-occupied units account for 225,334 (53.3%), while renter-occupied units make up 197,209 (46.7%).
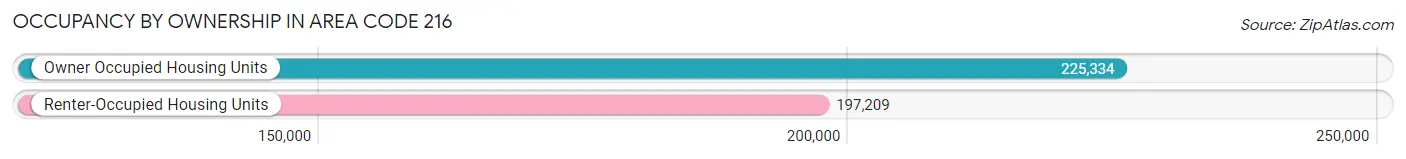
| Occupancy | # Housing Units | % Housing Units |
| Owner Occupied Housing Units | 225,334 | 53.3% |
| Renter-Occupied Housing Units | 197,209 | 46.7% |
| Total Occupied Housing Units | 422,543 | 100.0% |
Occupancy by Household Size in Area Code 216
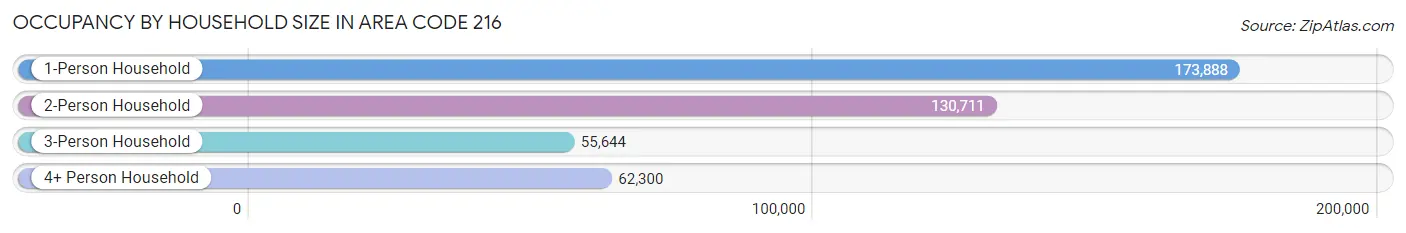
| Household Size | # Housing Units | % Housing Units |
| 1-Person Household | 173,888 | 41.1% |
| 2-Person Household | 130,711 | 30.9% |
| 3-Person Household | 55,644 | 13.2% |
| 4+ Person Household | 62,300 | 14.7% |
| Total Housing Units | 422,543 | 100.0% |
Occupancy by Ownership by Household Size in Area Code 216
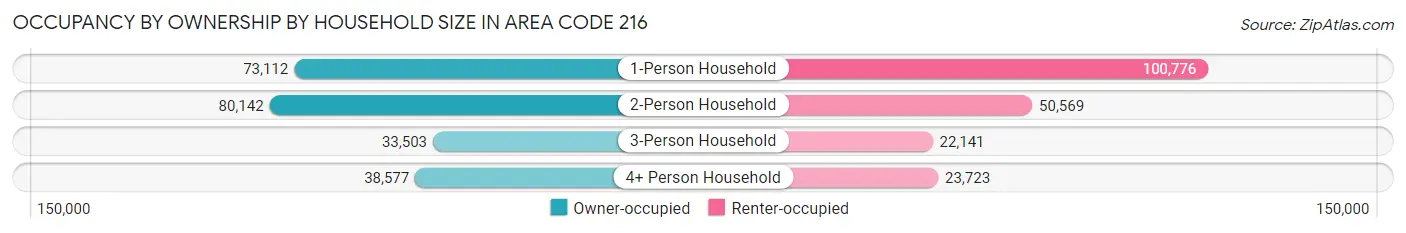
| Household Size | Owner-occupied | Renter-occupied |
| 1-Person Household | 73,112 (42.0%) | 100,776 (58.0%) |
| 2-Person Household | 80,142 (61.3%) | 50,569 (38.7%) |
| 3-Person Household | 33,503 (60.2%) | 22,141 (39.8%) |
| 4+ Person Household | 38,577 (61.9%) | 23,723 (38.1%) |
| Total Housing Units | 225,334 (53.3%) | 197,209 (46.7%) |
Occupancy by Educational Attainment in Area Code 216
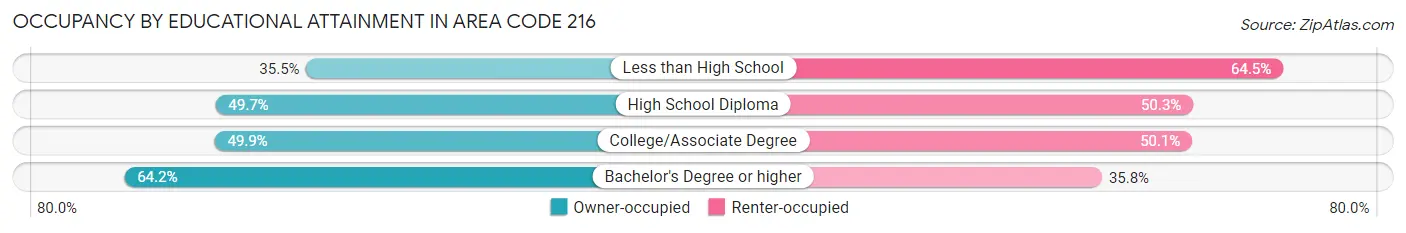
| Household Size | Owner-occupied | Renter-occupied |
| Less than High School | 14,204 (35.5%) | 25,852 (64.5%) |
| High School Diploma | 53,171 (49.7%) | 53,757 (50.3%) |
| College/Associate Degree | 65,938 (49.9%) | 66,261 (50.1%) |
| Bachelor's Degree or higher | 92,021 (64.2%) | 51,339 (35.8%) |
Occupancy by Age of Householder in Area Code 216
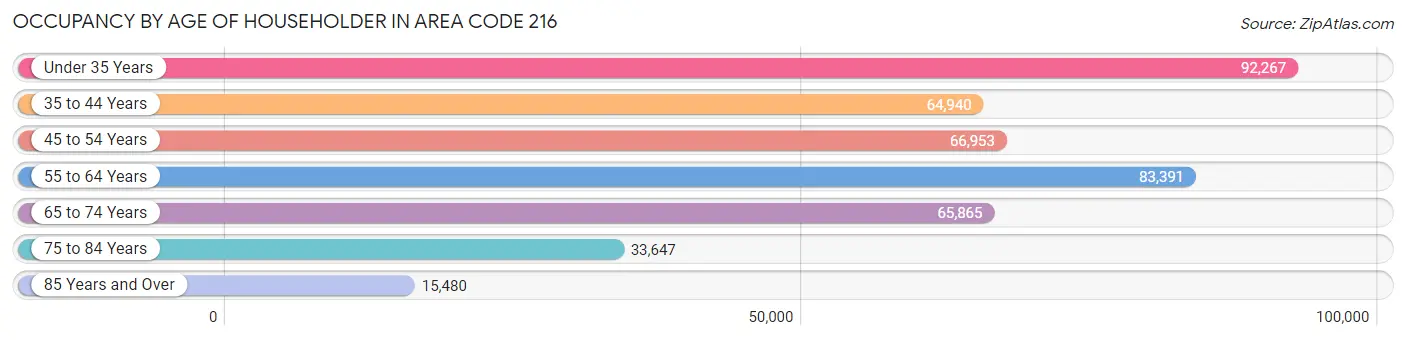
| Age Bracket | # Households | % Households |
| Under 35 Years | 92,267 | 21.8% |
| 35 to 44 Years | 64,940 | 15.4% |
| 45 to 54 Years | 66,953 | 15.9% |
| 55 to 64 Years | 83,391 | 19.7% |
| 65 to 74 Years | 65,865 | 15.6% |
| 75 to 84 Years | 33,647 | 8.0% |
| 85 Years and Over | 15,480 | 3.7% |
| Total | 422,543 | 100.0% |
Housing Finances in Area Code 216
Median Income by Occupancy in Area Code 216
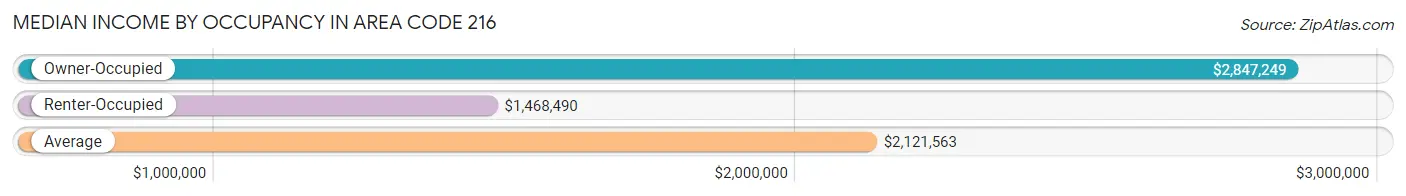
| Occupancy Type | # Households | Median Income |
| Owner-Occupied | 225,334 (53.3%) | $2,847,249 |
| Renter-Occupied | 197,209 (46.7%) | $1,468,490 |
| Average | 422,543 (100.0%) | $2,121,563 |
Occupancy by Householder Income Bracket in Area Code 216
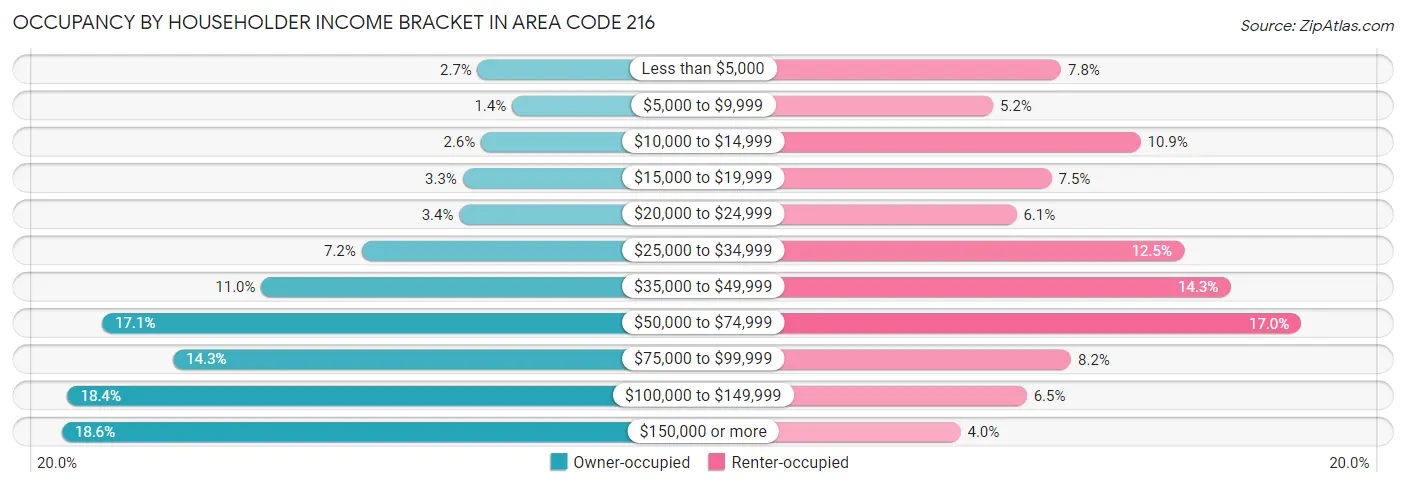
| Income Bracket | Owner-occupied | Renter-occupied |
| Less than $5,000 | 6,181 (2.7%) | 15,437 (7.8%) |
| $5,000 to $9,999 | 3,232 (1.4%) | 10,343 (5.2%) |
| $10,000 to $14,999 | 5,872 (2.6%) | 21,424 (10.9%) |
| $15,000 to $19,999 | 7,468 (3.3%) | 14,724 (7.5%) |
| $20,000 to $24,999 | 7,748 (3.4%) | 12,094 (6.1%) |
| $25,000 to $34,999 | 16,145 (7.2%) | 24,645 (12.5%) |
| $35,000 to $49,999 | 24,734 (11.0%) | 28,140 (14.3%) |
| $50,000 to $74,999 | 38,409 (17.1%) | 33,464 (17.0%) |
| $75,000 to $99,999 | 32,321 (14.3%) | 16,184 (8.2%) |
| $100,000 to $149,999 | 41,368 (18.4%) | 12,867 (6.5%) |
| $150,000 or more | 41,856 (18.6%) | 7,887 (4.0%) |
| Total | 225,334 (100.0%) | 197,209 (100.0%) |
Monthly Housing Cost Tiers in Area Code 216
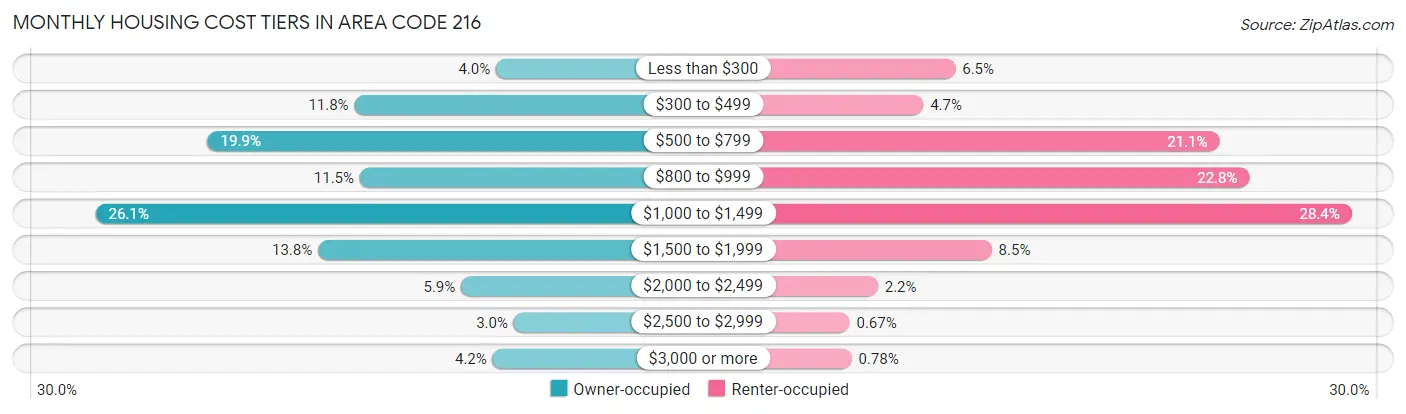
| Monthly Cost | Owner-occupied | Renter-occupied |
| Less than $300 | 8,919 (4.0%) | 12,844 (6.5%) |
| $300 to $499 | 26,544 (11.8%) | 9,339 (4.7%) |
| $500 to $799 | 44,819 (19.9%) | 41,584 (21.1%) |
| $800 to $999 | 25,865 (11.5%) | 44,860 (22.8%) |
| $1,000 to $1,499 | 58,758 (26.1%) | 56,015 (28.4%) |
| $1,500 to $1,999 | 31,081 (13.8%) | 16,795 (8.5%) |
| $2,000 to $2,499 | 13,272 (5.9%) | 4,401 (2.2%) |
| $2,500 to $2,999 | 6,721 (3.0%) | 1,316 (0.7%) |
| $3,000 or more | 9,355 (4.2%) | 1,543 (0.8%) |
| Total | 225,334 (100.0%) | 197,209 (100.0%) |
Physical Housing Characteristics in Area Code 216
Housing Structures in Area Code 216
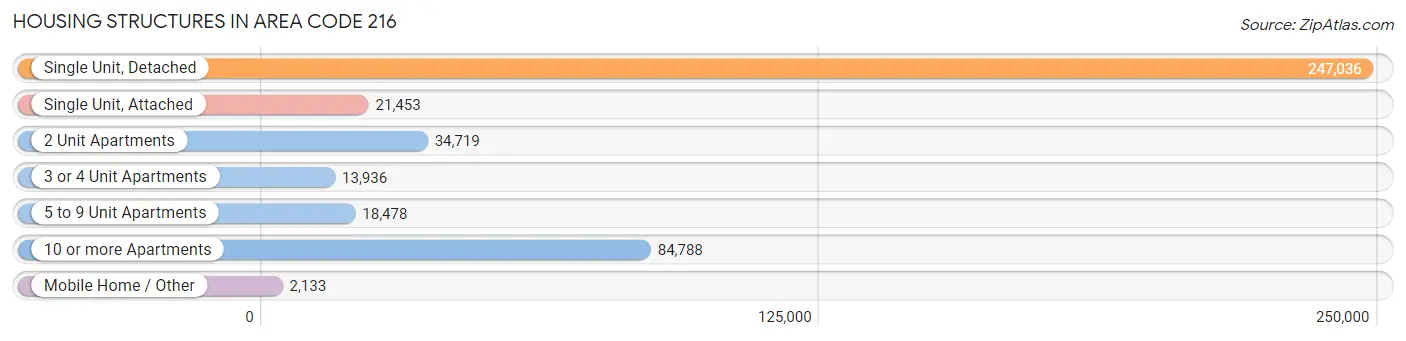
| Structure Type | # Housing Units | % Housing Units |
| Single Unit, Detached | 247,036 | 58.5% |
| Single Unit, Attached | 21,453 | 5.1% |
| 2 Unit Apartments | 34,719 | 8.2% |
| 3 or 4 Unit Apartments | 13,936 | 3.3% |
| 5 to 9 Unit Apartments | 18,478 | 4.4% |
| 10 or more Apartments | 84,788 | 20.1% |
| Mobile Home / Other | 2,133 | 0.5% |
| Total | 422,543 | 100.0% |
Housing Structures by Occupancy in Area Code 216
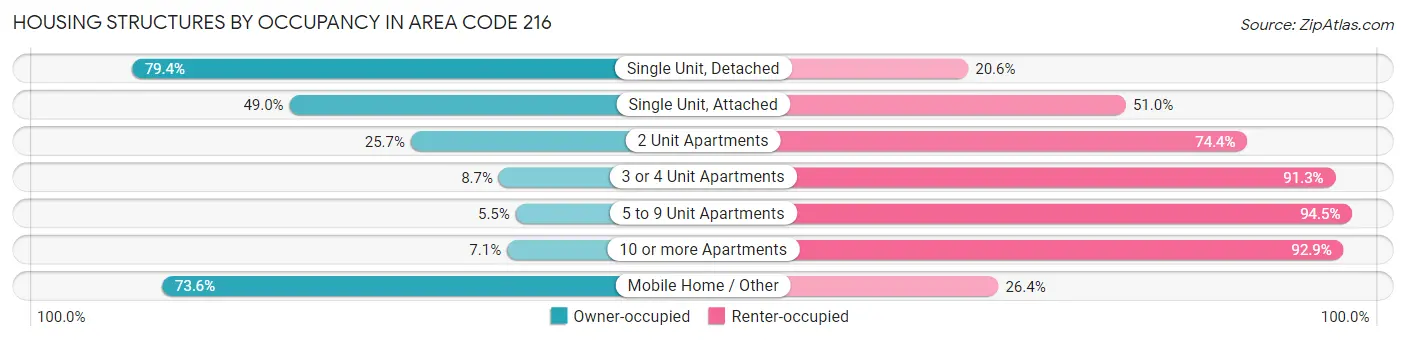
| Structure Type | Owner-occupied | Renter-occupied |
| Single Unit, Detached | 196,082 (79.4%) | 50,954 (20.6%) |
| Single Unit, Attached | 10,515 (49.0%) | 10,938 (51.0%) |
| 2 Unit Apartments | 8,906 (25.7%) | 25,813 (74.4%) |
| 3 or 4 Unit Apartments | 1,213 (8.7%) | 12,723 (91.3%) |
| 5 to 9 Unit Apartments | 1,009 (5.5%) | 17,469 (94.5%) |
| 10 or more Apartments | 6,040 (7.1%) | 78,748 (92.9%) |
| Mobile Home / Other | 1,569 (73.6%) | 564 (26.4%) |
| Total | 225,334 (53.3%) | 197,209 (46.7%) |
Housing Structures by Number of Rooms in Area Code 216
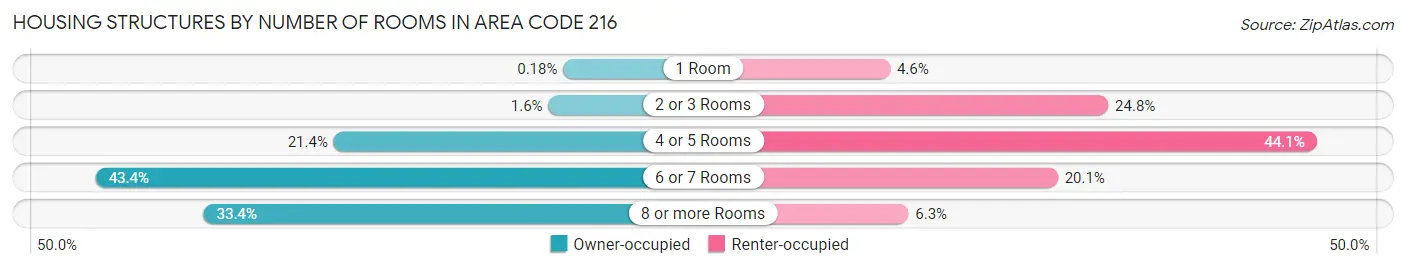
| Number of Rooms | Owner-occupied | Renter-occupied |
| 1 Room | 416 (0.2%) | 9,128 (4.6%) |
| 2 or 3 Rooms | 3,494 (1.5%) | 48,934 (24.8%) |
| 4 or 5 Rooms | 48,240 (21.4%) | 86,932 (44.1%) |
| 6 or 7 Rooms | 97,832 (43.4%) | 39,726 (20.1%) |
| 8 or more Rooms | 75,352 (33.4%) | 12,489 (6.3%) |
| Total | 225,334 (100.0%) | 197,209 (100.0%) |
Housing Structure by Heating Type in Area Code 216
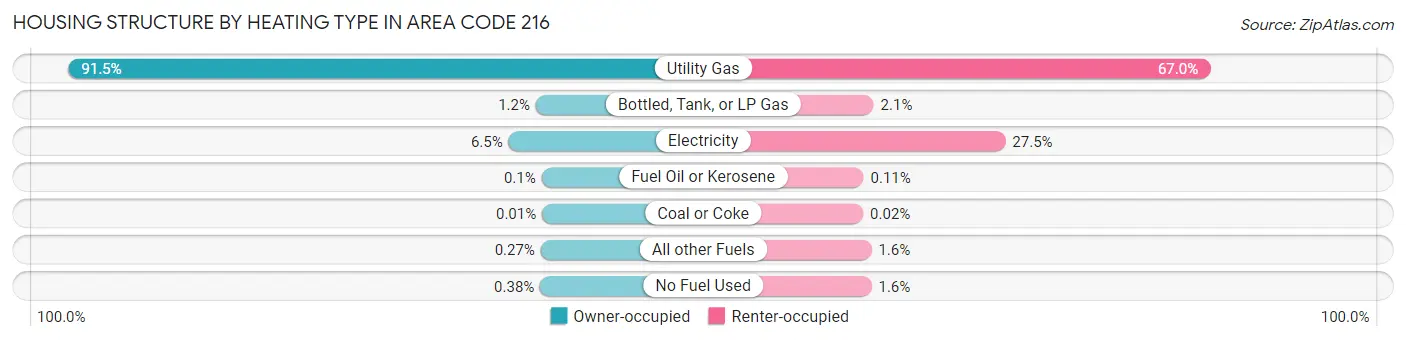
| Heating Type | Owner-occupied | Renter-occupied |
| Utility Gas | 206,276 (91.5%) | 132,199 (67.0%) |
| Bottled, Tank, or LP Gas | 2,751 (1.2%) | 4,039 (2.1%) |
| Electricity | 14,600 (6.5%) | 54,260 (27.5%) |
| Fuel Oil or Kerosene | 217 (0.1%) | 216 (0.1%) |
| Coal or Coke | 30 (0.0%) | 48 (0.0%) |
| All other Fuels | 606 (0.3%) | 3,210 (1.6%) |
| No Fuel Used | 854 (0.4%) | 3,237 (1.6%) |
| Total | 225,334 (100.0%) | 197,209 (100.0%) |
Household Vehicle Usage in Area Code 216
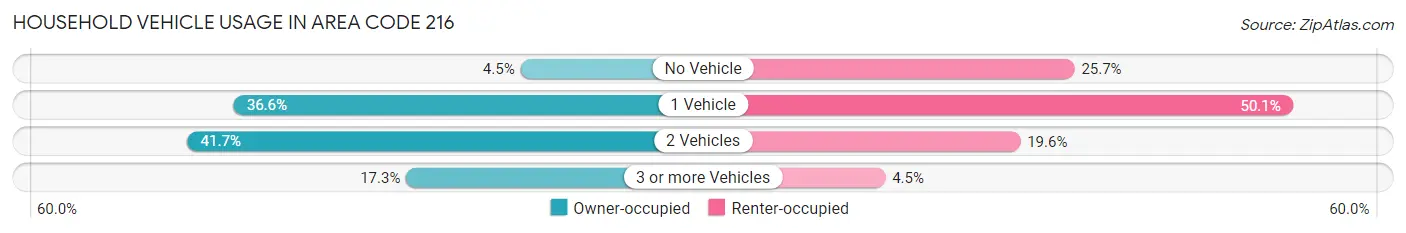
| Vehicles per Household | Owner-occupied | Renter-occupied |
| No Vehicle | 10,034 (4.4%) | 50,707 (25.7%) |
| 1 Vehicle | 82,391 (36.6%) | 98,879 (50.1%) |
| 2 Vehicles | 94,030 (41.7%) | 38,731 (19.6%) |
| 3 or more Vehicles | 38,879 (17.2%) | 8,892 (4.5%) |
| Total | 225,334 (100.0%) | 197,209 (100.0%) |
Real Estate & Mortgages in Area Code 216
Real Estate and Mortgage Overview in Area Code 216
| Characteristic | Without Mortgage | With Mortgage |
| Housing Units | 92,908 | 132,426 |
| Median Property Value | $4,791,200 | $6,134,900 |
| Median Household Income | $2,137,121 | $30,202 |
| Monthly Housing Costs | $21,497 | $8,723 |
| Real Estate Taxes | $107,262 | $3,326 |
Property Value by Mortgage Status in Area Code 216
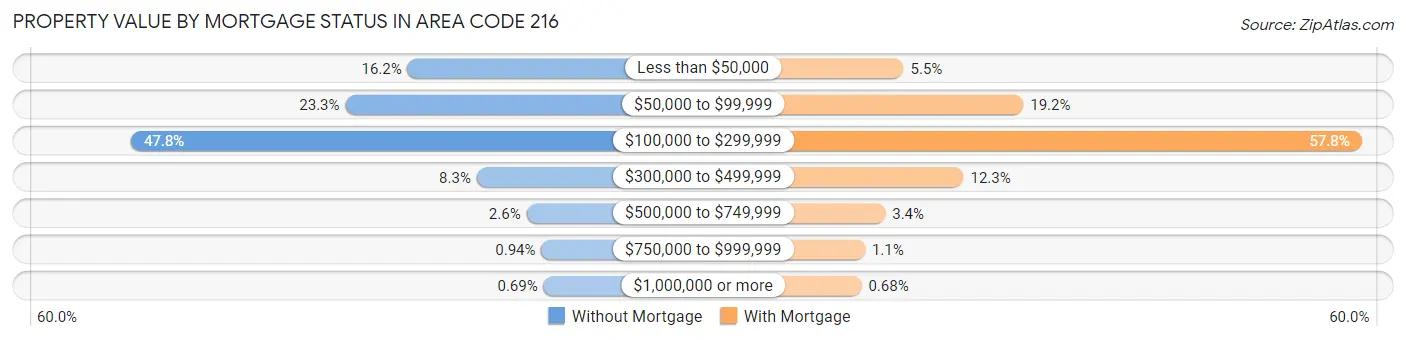
| Property Value | Without Mortgage | With Mortgage |
| Less than $50,000 | 15,075 (16.2%) | 7,275 (5.5%) |
| $50,000 to $99,999 | 21,681 (23.3%) | 25,383 (19.2%) |
| $100,000 to $299,999 | 44,447 (47.8%) | 76,588 (57.8%) |
| $300,000 to $499,999 | 7,735 (8.3%) | 16,343 (12.3%) |
| $500,000 to $749,999 | 2,455 (2.6%) | 4,509 (3.4%) |
| $750,000 to $999,999 | 871 (0.9%) | 1,433 (1.1%) |
| $1,000,000 or more | 644 (0.7%) | 895 (0.7%) |
| Total | 92,908 (100.0%) | 132,426 (100.0%) |
Household Income by Mortgage Status in Area Code 216
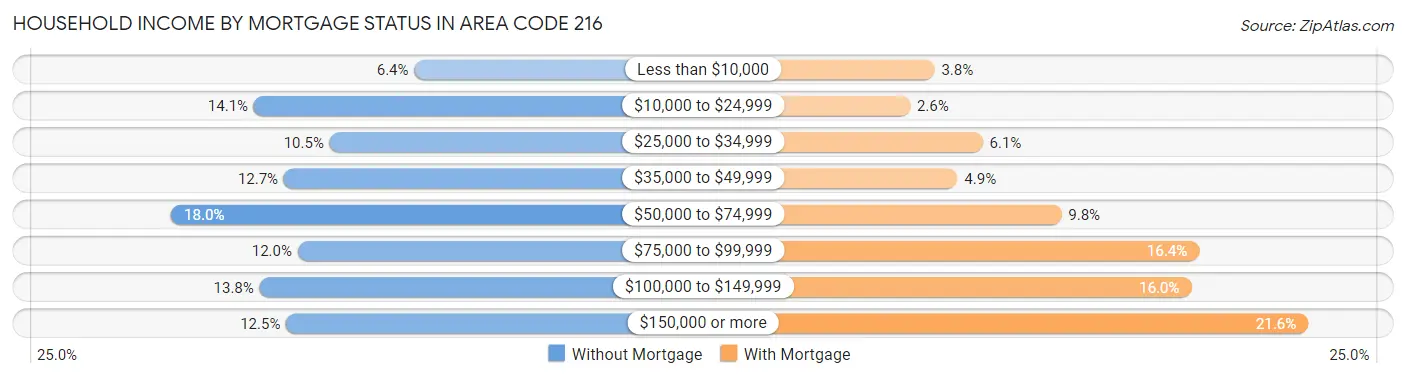
| Household Income | Without Mortgage | With Mortgage |
| Less than $10,000 | 5,984 (6.4%) | 4,979 (3.8%) |
| $10,000 to $24,999 | 13,082 (14.1%) | 3,429 (2.6%) |
| $25,000 to $34,999 | 9,724 (10.5%) | 8,006 (6.0%) |
| $35,000 to $49,999 | 11,754 (12.7%) | 6,421 (4.9%) |
| $50,000 to $74,999 | 16,738 (18.0%) | 12,980 (9.8%) |
| $75,000 to $99,999 | 11,144 (12.0%) | 21,671 (16.4%) |
| $100,000 to $149,999 | 12,828 (13.8%) | 21,177 (16.0%) |
| $150,000 or more | 11,654 (12.5%) | 28,540 (21.5%) |
| Total | 92,908 (100.0%) | 132,426 (100.0%) |
Property Value to Household Income Ratio in Area Code 216
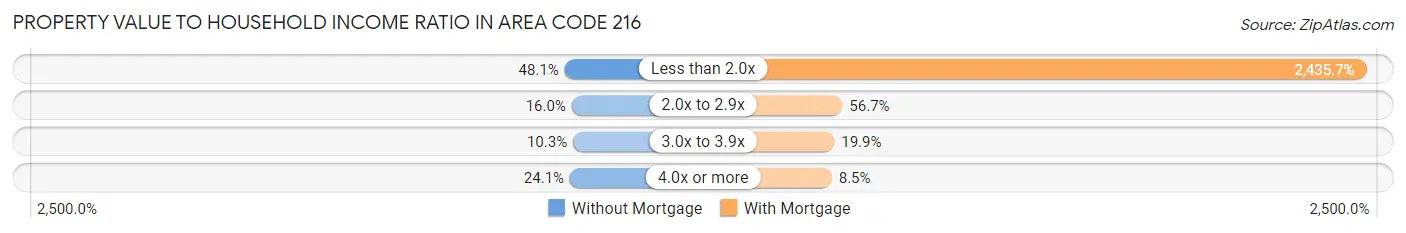
| Value-to-Income Ratio | Without Mortgage | With Mortgage |
| Less than 2.0x | 44,652 (48.1%) | 3,225,452 (2,435.7%) |
| 2.0x to 2.9x | 14,842 (16.0%) | 75,042 (56.7%) |
| 3.0x to 3.9x | 9,532 (10.3%) | 26,395 (19.9%) |
| 4.0x or more | 22,378 (24.1%) | 11,303 (8.5%) |
| Total | 92,908 (100.0%) | 132,426 (100.0%) |
Real Estate Taxes by Mortgage Status in Area Code 216
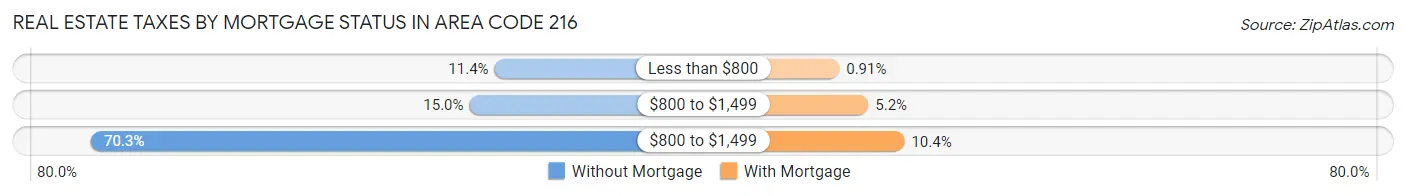
| Property Taxes | Without Mortgage | With Mortgage |
| Less than $800 | 10,545 (11.4%) | 1,210 (0.9%) |
| $800 to $1,499 | 13,943 (15.0%) | 6,838 (5.2%) |
| $800 to $1,499 | 65,299 (70.3%) | 13,827 (10.4%) |
| Total | 92,908 (100.0%) | 132,426 (100.0%) |
Health & Disability in Area Code 216
Health Insurance Coverage by Age in Area Code 216
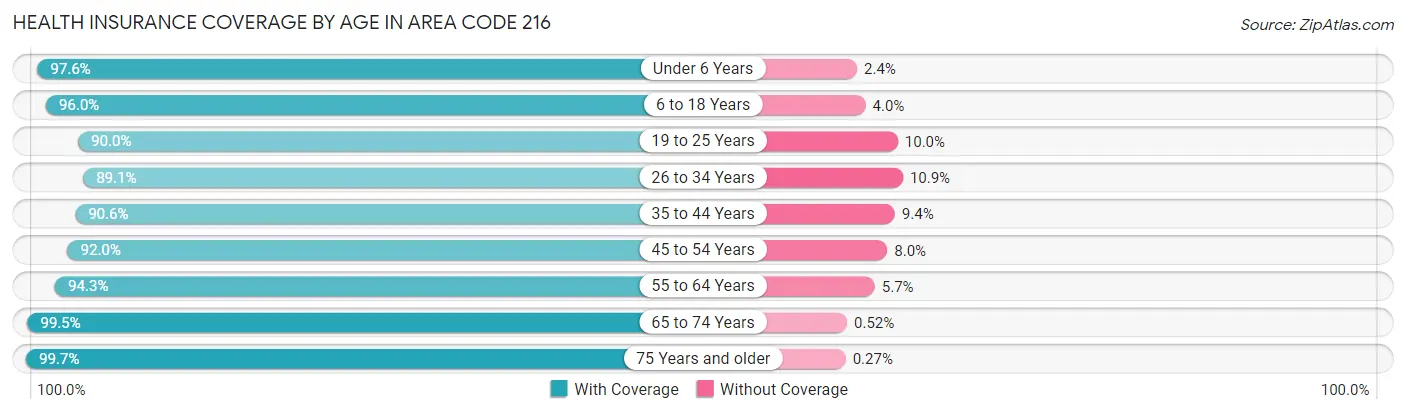
| Age Bracket | With Coverage | Without Coverage |
| Under 6 Years | 63,018 (97.6%) | 1,541 (2.4%) |
| 6 to 18 Years | 136,437 (96.0%) | 5,662 (4.0%) |
| 19 to 25 Years | 80,931 (90.0%) | 8,981 (10.0%) |
| 26 to 34 Years | 114,574 (89.1%) | 14,069 (10.9%) |
| 35 to 44 Years | 102,375 (90.6%) | 10,675 (9.4%) |
| 45 to 54 Years | 100,146 (92.0%) | 8,743 (8.0%) |
| 55 to 64 Years | 120,390 (94.3%) | 7,276 (5.7%) |
| 65 to 74 Years | 94,669 (99.5%) | 499 (0.5%) |
| 75 Years and older | 66,480 (99.7%) | 177 (0.3%) |
| Total | 879,020 (93.9%) | 57,623 (6.1%) |
Health Insurance Coverage by Citizenship Status in Area Code 216
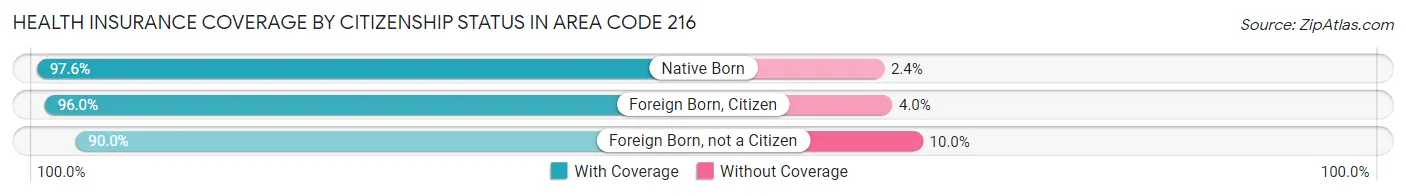
| Citizenship Status | With Coverage | Without Coverage |
| Native Born | 63,018 (97.6%) | 1,541 (2.4%) |
| Foreign Born, Citizen | 136,437 (96.0%) | 5,662 (4.0%) |
| Foreign Born, not a Citizen | 80,931 (90.0%) | 8,981 (10.0%) |
Health Insurance Coverage by Household Income in Area Code 216
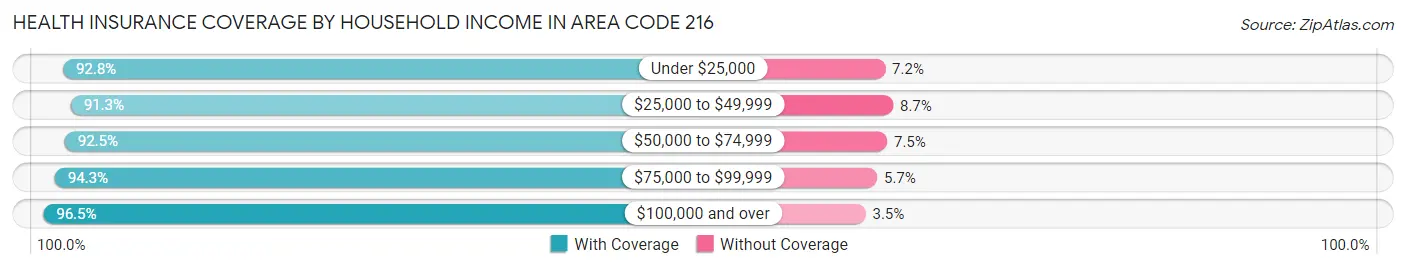
| Household Income | With Coverage | Without Coverage |
| Under $25,000 | 158,023 (92.8%) | 12,238 (7.2%) |
| $25,000 to $49,999 | 169,238 (91.3%) | 16,054 (8.7%) |
| $50,000 to $74,999 | 142,868 (92.5%) | 11,658 (7.5%) |
| $75,000 to $99,999 | 110,258 (94.3%) | 6,627 (5.7%) |
| $100,000 and over | 288,492 (96.5%) | 10,485 (3.5%) |
Public vs Private Health Insurance Coverage by Age in Area Code 216
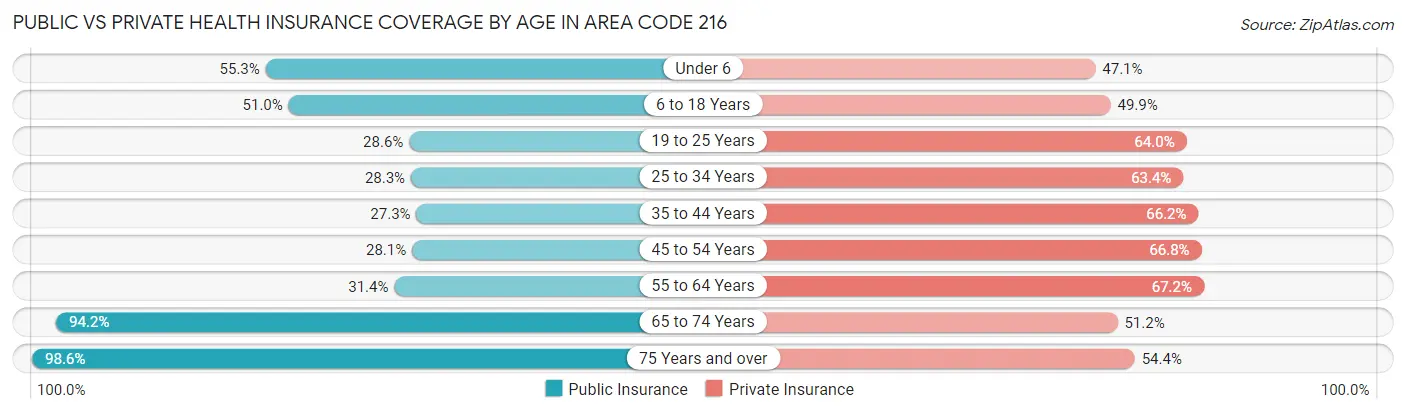
| Age Bracket | Public Insurance | Private Insurance |
| Under 6 | 35,680 (55.3%) | 30,379 (47.1%) |
| 6 to 18 Years | 72,453 (51.0%) | 70,882 (49.9%) |
| 19 to 25 Years | 25,732 (28.6%) | 57,522 (64.0%) |
| 25 to 34 Years | 36,395 (28.3%) | 81,506 (63.4%) |
| 35 to 44 Years | 30,840 (27.3%) | 74,816 (66.2%) |
| 45 to 54 Years | 30,587 (28.1%) | 72,685 (66.7%) |
| 55 to 64 Years | 40,065 (31.4%) | 85,780 (67.2%) |
| 65 to 74 Years | 89,600 (94.2%) | 48,695 (51.2%) |
| 75 Years and over | 65,724 (98.6%) | 36,241 (54.4%) |
| Total | 427,076 (45.6%) | 558,506 (59.6%) |
Disability Status by Sex by Age in Area Code 216
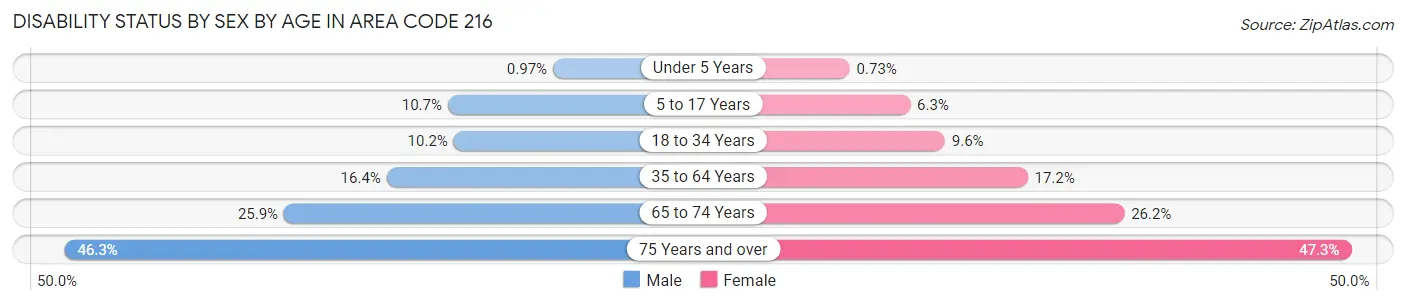
| Age Bracket | Male | Female |
| Under 5 Years | 267 (1.0%) | 194 (0.7%) |
| 5 to 17 Years | 7,705 (10.7%) | 4,397 (6.3%) |
| 18 to 34 Years | 11,474 (10.2%) | 11,183 (9.6%) |
| 35 to 64 Years | 27,510 (16.4%) | 31,345 (17.2%) |
| 65 to 74 Years | 11,233 (25.9%) | 13,588 (26.2%) |
| 75 Years and over | 11,549 (46.3%) | 19,727 (47.3%) |
Disability Class by Sex by Age in Area Code 216
Disability Class: Hearing Difficulty
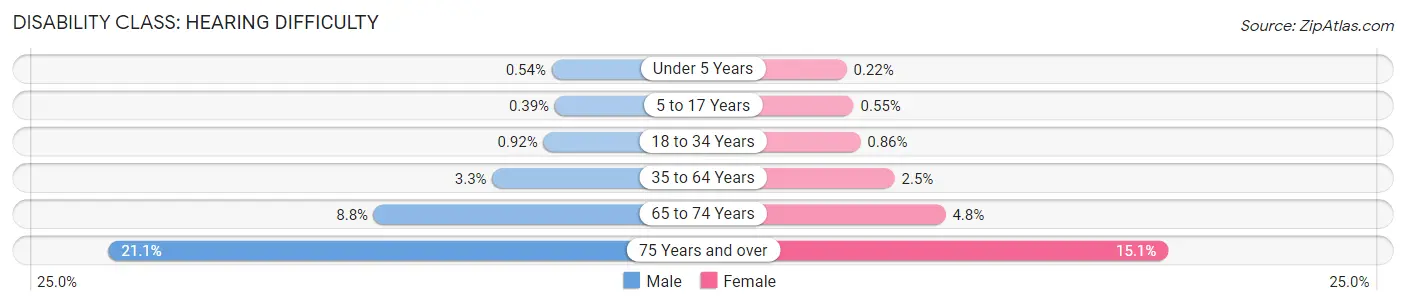
| Age Bracket | Male | Female |
| Under 5 Years | 150 (0.5%) | 58 (0.2%) |
| 5 to 17 Years | 282 (0.4%) | 385 (0.5%) |
| 18 to 34 Years | 1,035 (0.9%) | 1,007 (0.9%) |
| 35 to 64 Years | 5,526 (3.3%) | 4,461 (2.5%) |
| 65 to 74 Years | 3,807 (8.8%) | 2,495 (4.8%) |
| 75 Years and over | 5,265 (21.1%) | 6,314 (15.1%) |
Disability Class: Vision Difficulty
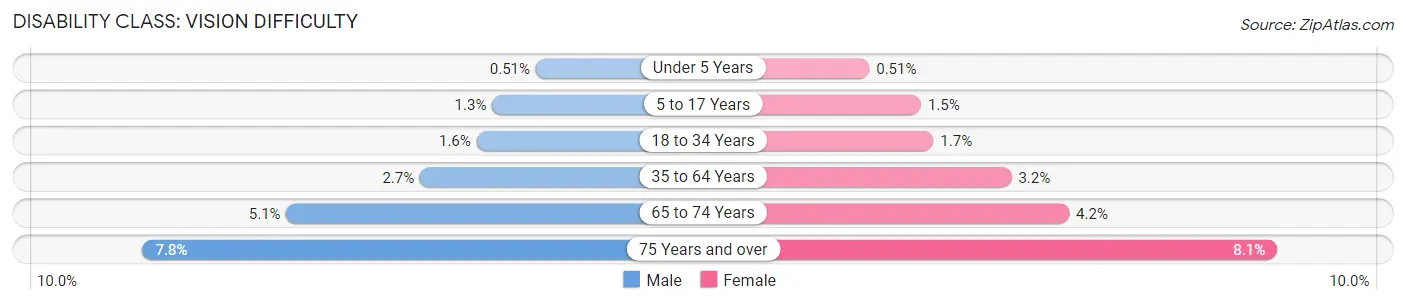
| Age Bracket | Male | Female |
| Under 5 Years | 142 (0.5%) | 136 (0.5%) |
| 5 to 17 Years | 952 (1.3%) | 1,020 (1.5%) |
| 18 to 34 Years | 1,819 (1.6%) | 1,983 (1.7%) |
| 35 to 64 Years | 4,465 (2.7%) | 5,729 (3.2%) |
| 65 to 74 Years | 2,229 (5.1%) | 2,189 (4.2%) |
| 75 Years and over | 1,948 (7.8%) | 3,372 (8.1%) |
Disability Class: Cognitive Difficulty
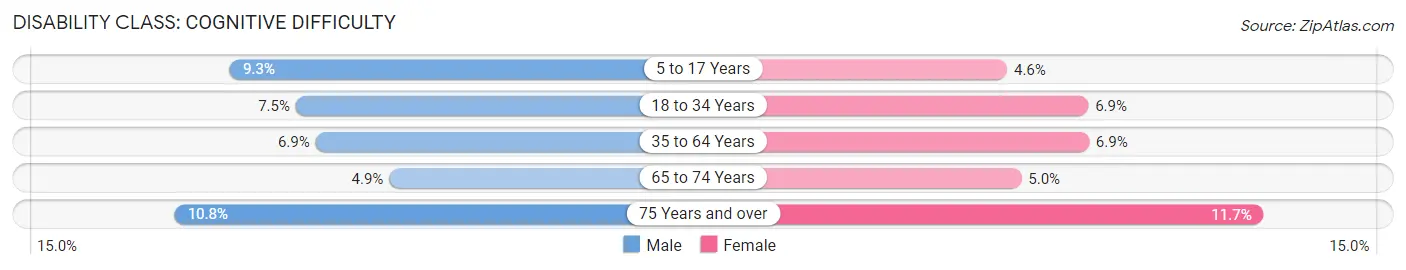
| Age Bracket | Male | Female |
| 5 to 17 Years | 6,672 (9.3%) | 3,191 (4.6%) |
| 18 to 34 Years | 8,392 (7.4%) | 8,021 (6.9%) |
| 35 to 64 Years | 11,586 (6.9%) | 12,506 (6.9%) |
| 65 to 74 Years | 2,101 (4.9%) | 2,594 (5.0%) |
| 75 Years and over | 2,699 (10.8%) | 4,896 (11.7%) |
Disability Class: Ambulatory Difficulty
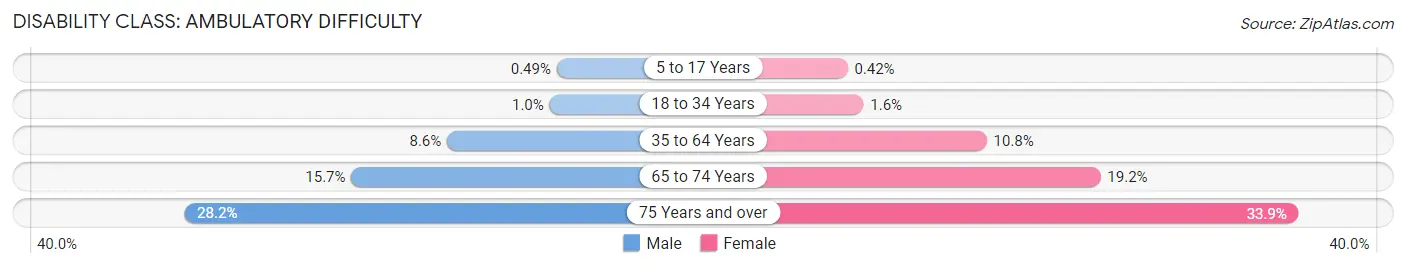
| Age Bracket | Male | Female |
| 5 to 17 Years | 349 (0.5%) | 294 (0.4%) |
| 18 to 34 Years | 1,146 (1.0%) | 1,871 (1.6%) |
| 35 to 64 Years | 14,479 (8.6%) | 19,548 (10.7%) |
| 65 to 74 Years | 6,821 (15.7%) | 9,954 (19.2%) |
| 75 Years and over | 7,021 (28.1%) | 14,148 (33.9%) |
Disability Class: Self-Care Difficulty
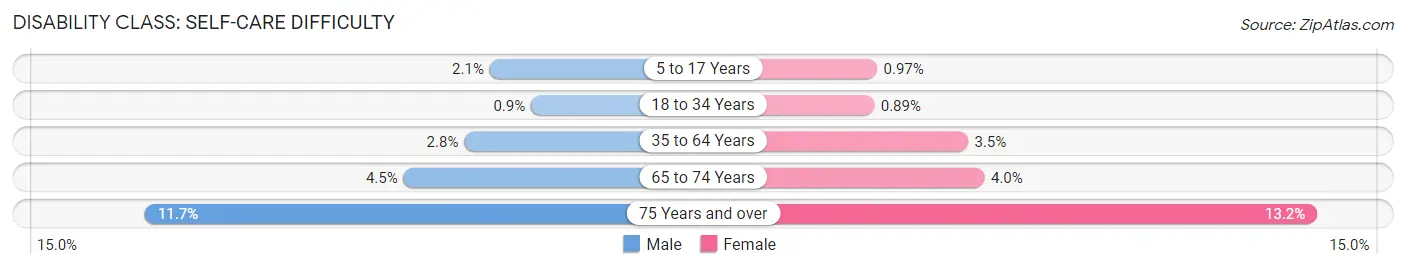
| Age Bracket | Male | Female |
| 5 to 17 Years | 1,470 (2.1%) | 671 (1.0%) |
| 18 to 34 Years | 1,016 (0.9%) | 1,040 (0.9%) |
| 35 to 64 Years | 4,635 (2.8%) | 6,369 (3.5%) |
| 65 to 74 Years | 1,929 (4.4%) | 2,054 (4.0%) |
| 75 Years and over | 2,907 (11.7%) | 5,518 (13.2%) |
Technology Access in Area Code 216
Computing Device Access in Area Code 216
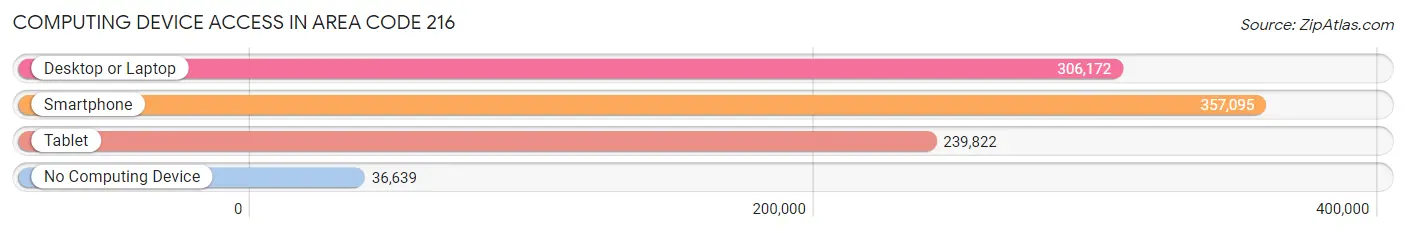
| Device Type | # Households | % Households |
| Desktop or Laptop | 306,172 | 72.5% |
| Smartphone | 357,095 | 84.5% |
| Tablet | 239,822 | 56.8% |
| No Computing Device | 36,639 | 8.7% |
| Total | 422,543 | 100.0% |
Internet Access in Area Code 216
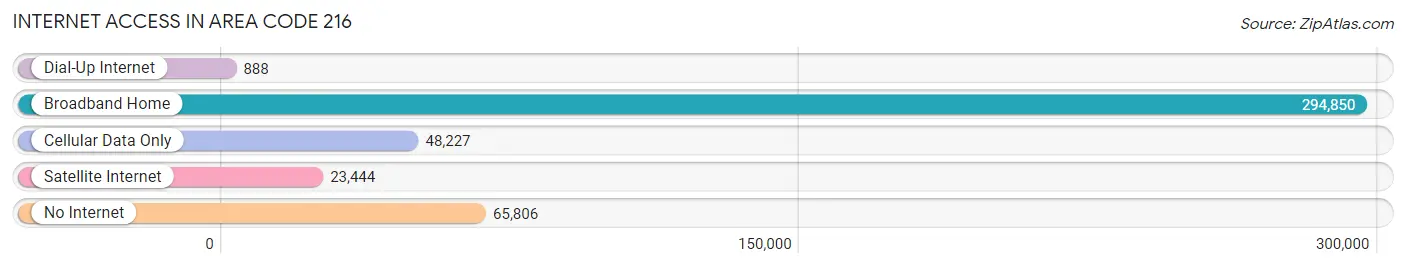
| Internet Type | # Households | % Households |
| Dial-Up Internet | 888 | 0.2% |
| Broadband Home | 294,850 | 69.8% |
| Cellular Data Only | 48,227 | 11.4% |
| Satellite Internet | 23,444 | 5.6% |
| No Internet | 65,806 | 15.6% |
| Total | 422,543 | 100.0% |
Area Code 216 Summary
Geography
Area code 216 is a telephone area code in the North American Numbering Plan (NANP) for the city of Cleveland, Ohio. It covers the entire city and its surrounding suburbs, including the cities of Euclid, Lakewood, and Shaker Heights.
Social
Area code 216 is a major hub for social activity in the Cleveland area. It is home to a variety of cultural institutions, including the Cleveland Museum of Art, the Cleveland Orchestra, and the Rock and Roll Hall of Fame. It is also home to a number of professional sports teams, including the Cleveland Cavaliers, the Cleveland Indians, and the Cleveland Browns.
Economics
Area code 216 is a major economic center in the Cleveland area. It is home to a number of Fortune 500 companies, including KeyCorp, Eaton Corporation, and Sherwin-Williams. It is also home to a number of major healthcare institutions, including the Cleveland Clinic and University Hospitals.
Demographics
Area code 216 is home to a diverse population. According to the 2010 census, the population of the area code is approximately 1.2 million people. The population is predominantly African American, with a significant Hispanic population as well. The median household income is approximately $41,000, and the median age is 36.
Common Questions
What is Per Capita Income in Area Code 216?
Per Capita income in Area Code 216 is $34,228.
What is the Median Family Income in Area Code 216?
Median Family Income in Area Code 216 is $72,070.
What is the Median Household income in Area Code 216?
Median Household Income in Area Code 216 is $55,831.
What is Income or Wage Gap in Area Code 216?
Income or Wage Gap in Area Code 216 is 18.4%.
Women in Area Code 216 earn 81.6 cents for every dollar earned by a man.
What is Family Income Deficit in Area Code 216?
Family Income Deficit in Area Code 216 is $10,602.
Families that are below poverty line in Area Code 216 earn $10,602 less on average than the poverty threshold level.
What is Inequality or Gini Index in Area Code 216?
Inequality or Gini Index in Area Code 216 is 18.08.
What is the Total Population of Area Code 216?
Total Population of Area Code 216 is 947,610.
What is the Total Male Population of Area Code 216?
Total Male Population of Area Code 216 is 454,049.
What is the Total Female Population of Area Code 216?
Total Female Population of Area Code 216 is 493,561.
What is the Ratio of Males per 100 Females in Area Code 216?
There are 91.99 Males per 100 Females in Area Code 216.
What is the Ratio of Females per 100 Males in Area Code 216?
There are 108.70 Females per 100 Males in Area Code 216.
What is the Median Population Age in Area Code 216?
Median Population Age in Area Code 216 is 39.3 Years.
What is the Average Family Size in Area Code 216
Average Family Size in Area Code 216 is 3.1 People.
What is the Average Household Size in Area Code 216
Average Household Size in Area Code 216 is 2.2 People.
How Large is the Labor Force in Area Code 216?
There are 481,857 People in the Labor Forcein in Area Code 216.
What is the Percentage of People in the Labor Force in Area Code 216?
62.3% of People are in the Labor Force in Area Code 216.
What is the Unemployment Rate in Area Code 216?
Unemployment Rate in Area Code 216 is 8.9%.