Area Code 617 Map & Demographics
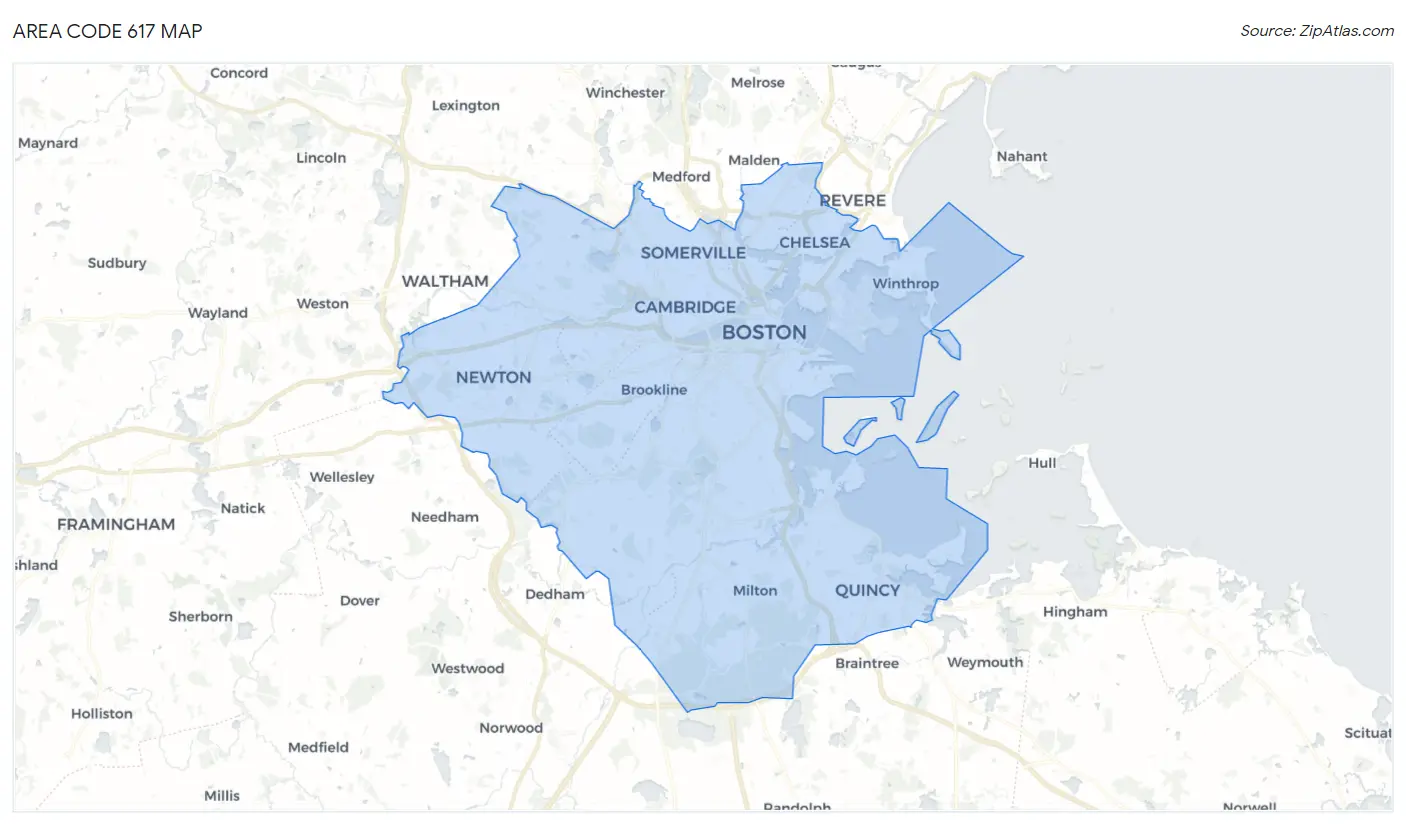
Area Code 617 Map
Area Code 617 Overview
$68,804
PER CAPITA INCOME
$149,426
AVG FAMILY INCOME
$116,814
AVG HOUSEHOLD INCOME
26.1%
WAGE / INCOME GAP [ % ]
73.9¢/ $1
WAGE / INCOME GAP [ $ ]
$10,502
FAMILY INCOME DEFICIT
36.83
INEQUALITY / GINI INDEX
1,875,867
TOTAL POPULATION
916,595
MALE POPULATION
959,272
FEMALE POPULATION
95.55
MALES / 100 FEMALES
104.66
FEMALES / 100 MALES
37.3
MEDIAN AGE
3.0
AVG FAMILY SIZE
2.3
AVG HOUSEHOLD SIZE
1,103,254
LABOR FORCE [ PEOPLE ]
69.3%
PERCENT IN LABOR FORCE
5.1%
UNEMPLOYMENT RATE
Income in Area Code 617
Income Overview in Area Code 617
Per Capita Income in Area Code 617 is $68,804, while median incomes of families and households are $149,426 and $116,814 respectively.
| Characteristic | Number | Measure |
| Per Capita Income | 1,875,867 | $68,804 |
| Median Family Income | 404,306 | $149,426 |
| Mean Family Income | 404,306 | $15,471,759 |
| Median Household Income | 756,293 | $116,814 |
| Mean Household Income | 756,293 | $12,475,870 |
| Income Deficit | 404,306 | $10,502 |
| Wage / Income Gap (%) | 1,875,867 | 26.13% |
| Wage / Income Gap ($) | 1,875,867 | 73.87¢ per $1 |
| Gini / Inequality Index | 1,875,867 | 36.83 |
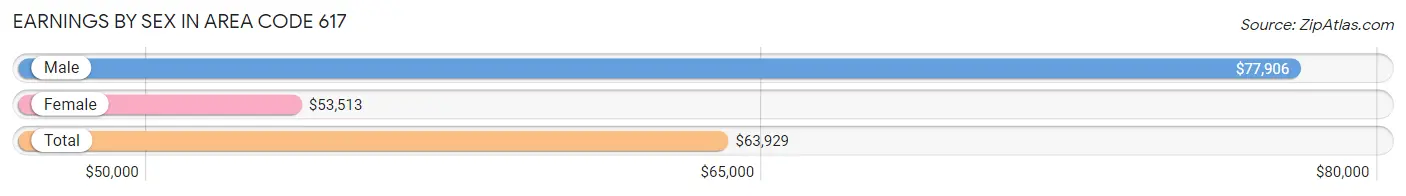
Earnings by Sex in Area Code 617
Average Earnings in Area Code 617 are $63,929, $77,906 for men and $53,513 for women, a difference of 31.3%.
| Sex | Number | Average Earnings |
| Male | 594,153 (50.7%) | $77,906 |
| Female | 577,155 (49.3%) | $53,513 |
| Total | 1,171,308 (100.0%) | $63,929 |
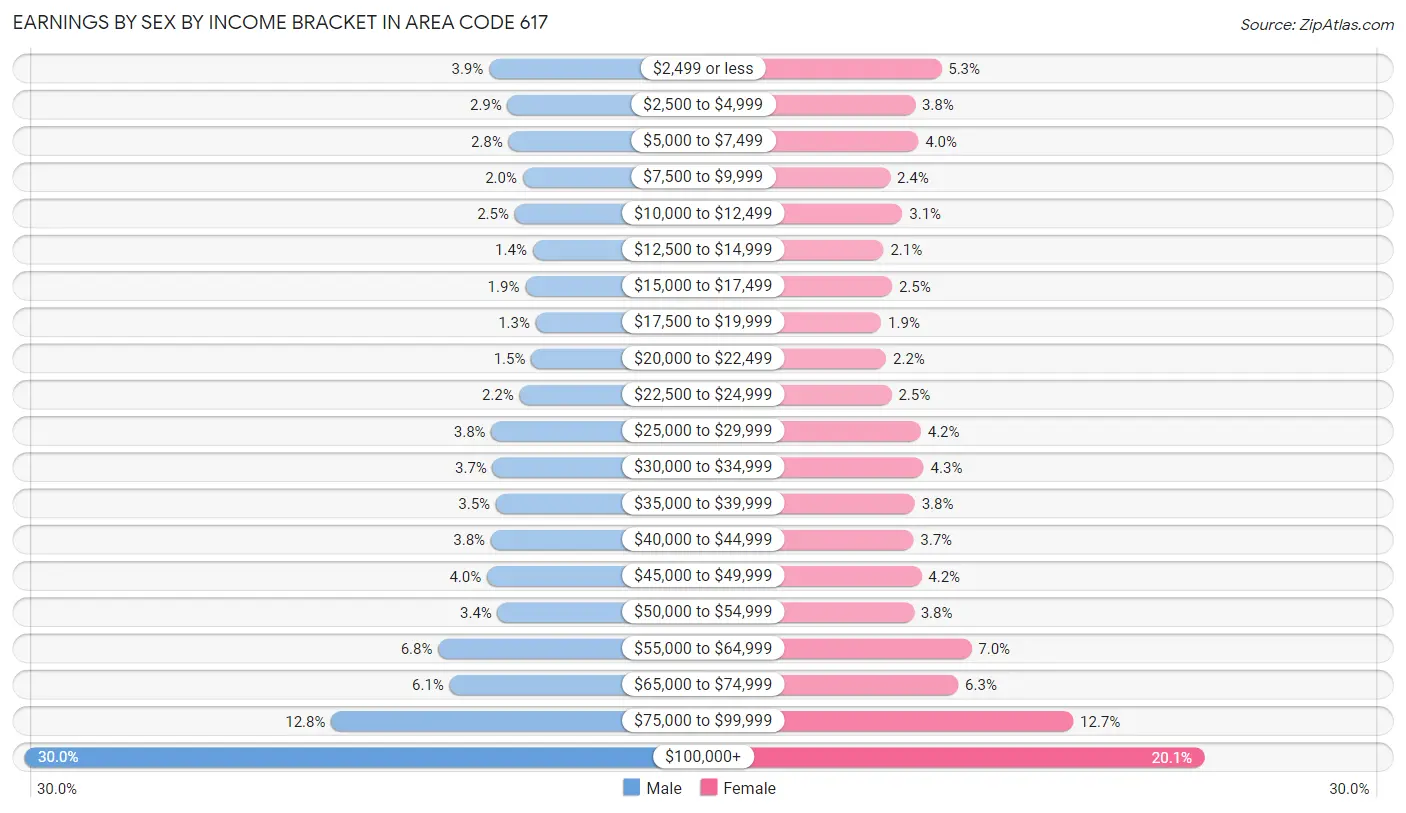
Earnings by Sex by Income Bracket in Area Code 617
The most common earnings brackets in Area Code 617 are $100,000+ for men (178,053 | 30.0%) and $100,000+ for women (115,808 | 20.1%).
| Income | Male | Female |
| $2,499 or less | 23,139 (3.9%) | 30,623 (5.3%) |
| $2,500 to $4,999 | 16,924 (2.9%) | 22,114 (3.8%) |
| $5,000 to $7,499 | 16,611 (2.8%) | 23,195 (4.0%) |
| $7,500 to $9,999 | 11,874 (2.0%) | 14,053 (2.4%) |
| $10,000 to $12,499 | 14,532 (2.5%) | 17,990 (3.1%) |
| $12,500 to $14,999 | 8,535 (1.4%) | 11,917 (2.1%) |
| $15,000 to $17,499 | 11,035 (1.9%) | 14,658 (2.5%) |
| $17,500 to $19,999 | 7,568 (1.3%) | 11,151 (1.9%) |
| $20,000 to $22,499 | 9,007 (1.5%) | 12,765 (2.2%) |
| $22,500 to $24,999 | 12,945 (2.2%) | 14,481 (2.5%) |
| $25,000 to $29,999 | 22,312 (3.8%) | 24,008 (4.2%) |
| $30,000 to $34,999 | 21,953 (3.7%) | 24,940 (4.3%) |
| $35,000 to $39,999 | 20,879 (3.5%) | 22,040 (3.8%) |
| $40,000 to $44,999 | 22,502 (3.8%) | 21,575 (3.7%) |
| $45,000 to $49,999 | 23,844 (4.0%) | 24,176 (4.2%) |
| $50,000 to $54,999 | 20,258 (3.4%) | 21,677 (3.8%) |
| $55,000 to $64,999 | 40,091 (6.8%) | 40,395 (7.0%) |
| $65,000 to $74,999 | 36,285 (6.1%) | 36,156 (6.3%) |
| $75,000 to $99,999 | 75,806 (12.8%) | 73,433 (12.7%) |
| $100,000+ | 178,053 (30.0%) | 115,808 (20.1%) |
| Total | 594,153 (100.0%) | 577,155 (100.0%) |
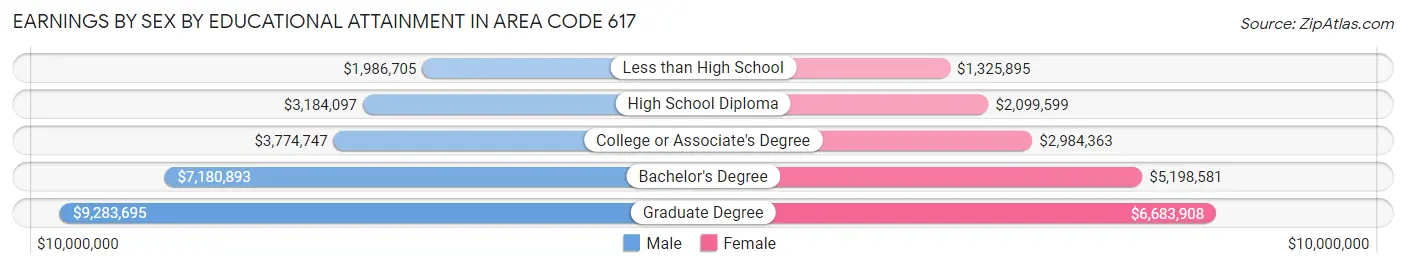
Earnings by Sex by Educational Attainment in Area Code 617
Average earnings in Area Code 617 are $7,007,877 for men and $4,970,827 for women, a difference of 29.1%. Men with an educational attainment of graduate degree enjoy the highest average annual earnings of $9,283,695, while those with less than high school education earn the least with $1,986,705. Women with an educational attainment of graduate degree earn the most with the average annual earnings of $6,683,908, while those with less than high school education have the smallest earnings of $1,325,895.
| Educational Attainment | Male Income | Female Income |
| Less than High School | $1,986,705 | $1,325,895 |
| High School Diploma | $3,184,097 | $2,099,599 |
| College or Associate's Degree | $3,774,747 | $2,984,363 |
| Bachelor's Degree | $7,180,893 | $5,198,581 |
| Graduate Degree | $9,283,695 | $6,683,908 |
| Total | $7,007,877 | $4,970,827 |
Family Income in Area Code 617
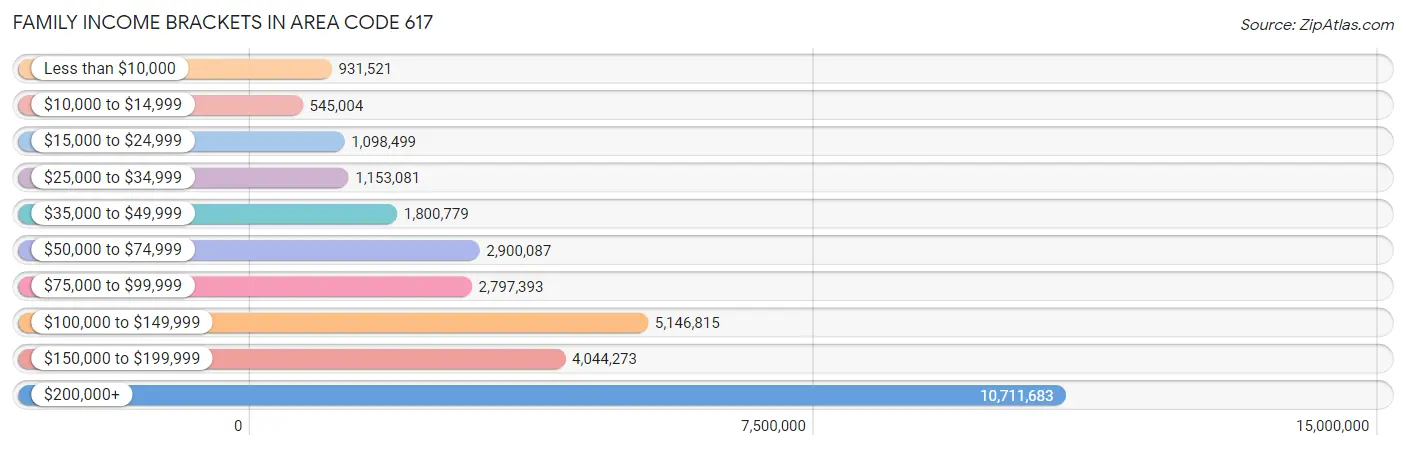
Family Income Brackets in Area Code 617
According to the Area Code 617 family income data, there are 10,711,683 families falling into the $200,000+ income range, which is the most common income bracket and makes up 2,649.4% of all families. Conversely, the $10,000 to $14,999 income bracket is the least frequent group with only 545,004 families (134.8%) belonging to this category.
| Income Bracket | # Families | % Families |
| Less than $10,000 | 931,521 | 230.4% |
| $10,000 to $14,999 | 545,004 | 134.8% |
| $15,000 to $24,999 | 1,098,499 | 271.7% |
| $25,000 to $34,999 | 1,153,081 | 285.2% |
| $35,000 to $49,999 | 1,800,779 | 445.4% |
| $50,000 to $74,999 | 2,900,087 | 717.3% |
| $75,000 to $99,999 | 2,797,393 | 691.9% |
| $100,000 to $149,999 | 5,146,815 | 1,273.0% |
| $150,000 to $199,999 | 4,044,273 | 1,000.3% |
| $200,000+ | 10,711,683 | 2,649.4% |
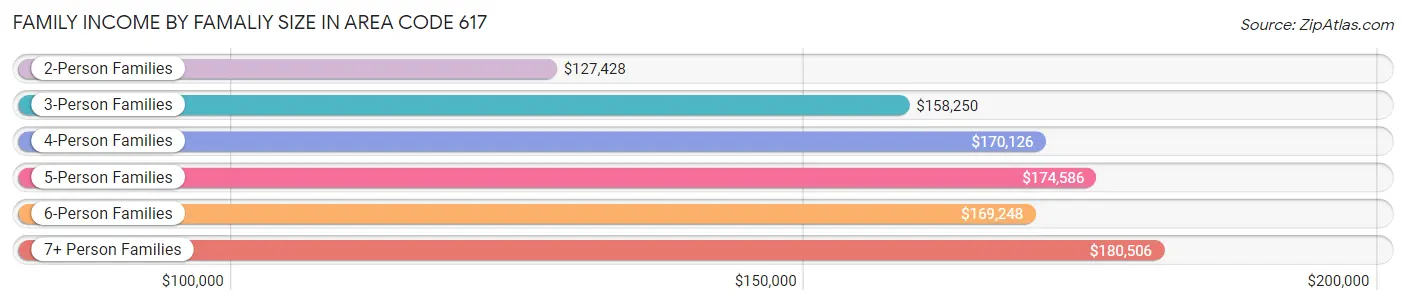
Family Income by Famaliy Size in Area Code 617
7+ person families (5,283 | 1.3%) account for the highest median family income in Area Code 617 with $180,506 per family, while 2-person families (183,219 | 45.3%) have the highest median income of $63,714 per family member.
| Income Bracket | # Families | Median Income |
| 2-Person Families | 183,219 (45.3%) | $127,428 |
| 3-Person Families | 97,280 (24.1%) | $158,250 |
| 4-Person Families | 79,140 (19.6%) | $170,126 |
| 5-Person Families | 29,933 (7.4%) | $174,586 |
| 6-Person Families | 9,451 (2.3%) | $169,248 |
| 7+ Person Families | 5,283 (1.3%) | $180,506 |
| Total | 404,306 (100.0%) | $149,426 |
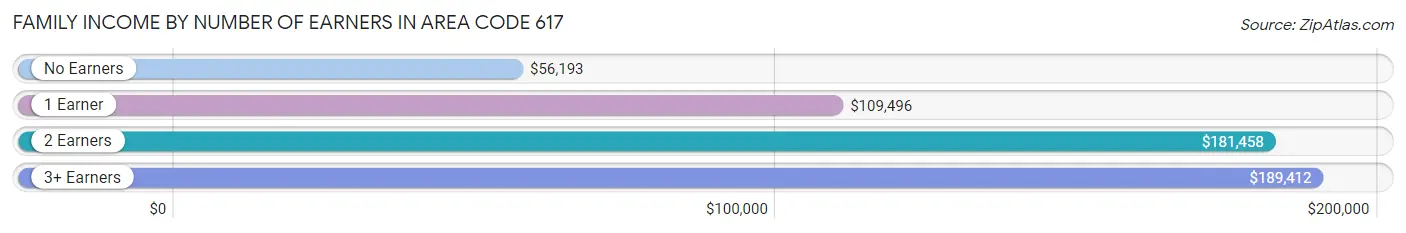
Family Income by Number of Earners in Area Code 617
The median family income in Area Code 617 is $149,426, with families comprising 3+ earners (58,741) having the highest median family income of $189,412, while families with no earners (41,020) have the lowest median family income of $56,193, accounting for 14.5% and 10.2% of families, respectively.
| Number of Earners | # Families | Median Income |
| No Earners | 41,020 (10.2%) | $56,193 |
| 1 Earner | 108,203 (26.8%) | $109,496 |
| 2 Earners | 196,342 (48.6%) | $181,458 |
| 3+ Earners | 58,741 (14.5%) | $189,412 |
| Total | 404,306 (100.0%) | $149,426 |
Household Income in Area Code 617
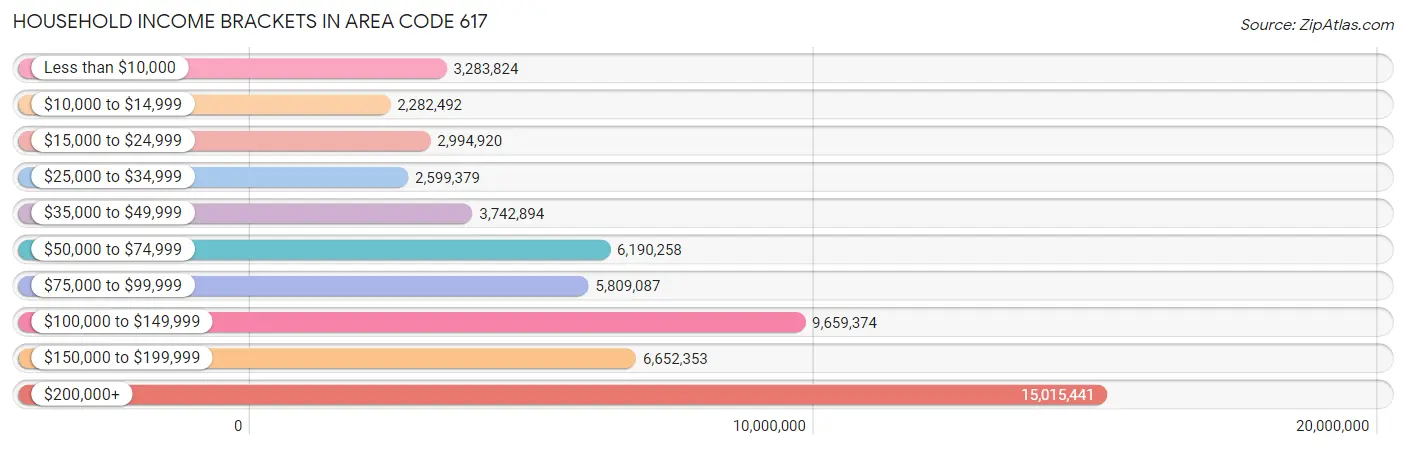
Household Income Brackets in Area Code 617
With 15,015,441 households falling in the category, the $200,000+ income range is the most frequent in Area Code 617, accounting for 1,985.4% of all households. In contrast, only 2,282,492 households (301.8%) fall into the $10,000 to $14,999 income bracket, making it the least populous group.
| Income Bracket | # Households | % Households |
| Less than $10,000 | 3,283,824 | 434.2% |
| $10,000 to $14,999 | 2,282,492 | 301.8% |
| $15,000 to $24,999 | 2,994,920 | 396.0% |
| $25,000 to $34,999 | 2,599,379 | 343.7% |
| $35,000 to $49,999 | 3,742,894 | 494.9% |
| $50,000 to $74,999 | 6,190,258 | 818.5% |
| $75,000 to $99,999 | 5,809,087 | 768.1% |
| $100,000 to $149,999 | 9,659,374 | 1,277.2% |
| $150,000 to $199,999 | 6,652,353 | 879.6% |
| $200,000+ | 15,015,441 | 1,985.4% |
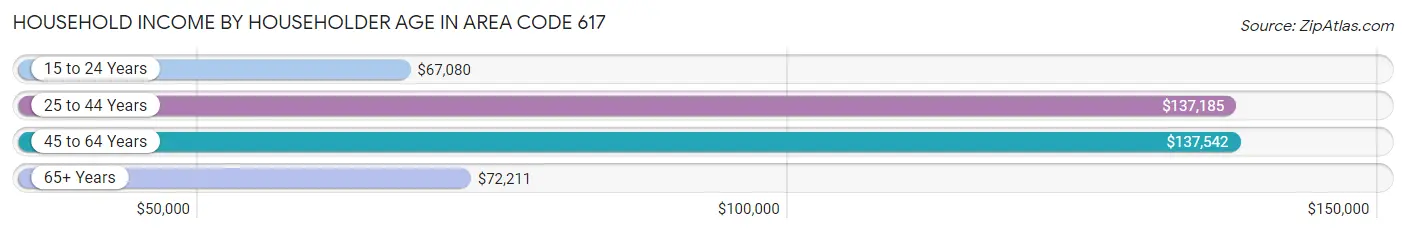
Household Income by Householder Age in Area Code 617
The median household income in Area Code 617 is $116,814, with the highest median household income of $137,542 found in the 45 to 64 years age bracket for the primary householder. A total of 246,287 households (32.6%) fall into this category. Meanwhile, the 15 to 24 years age bracket for the primary householder has the lowest median household income of $67,080, with 35,969 households (4.8%) in this group.
| Income Bracket | # Households | Median Income |
| 15 to 24 Years | 35,969 (4.8%) | $67,080 |
| 25 to 44 Years | 303,416 (40.1%) | $137,185 |
| 45 to 64 Years | 246,287 (32.6%) | $137,542 |
| 65+ Years | 170,621 (22.6%) | $72,211 |
| Total | 756,293 (100.0%) | $116,814 |
Poverty in Area Code 617
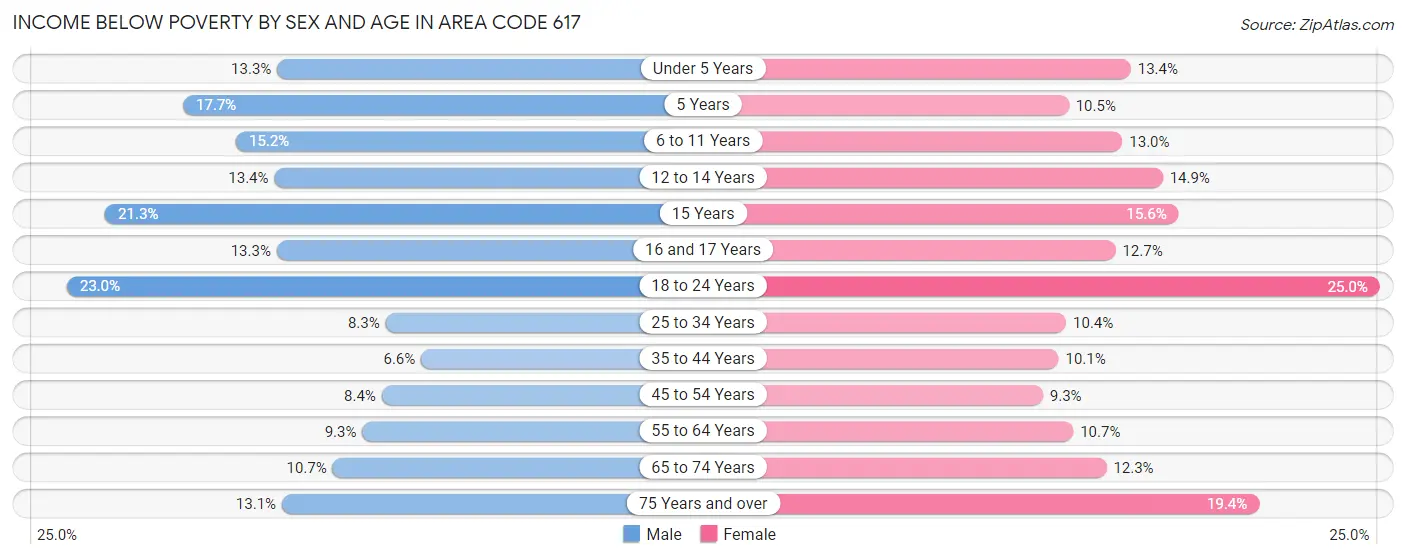
Income Below Poverty by Sex and Age in Area Code 617
With 11.1% poverty level for males and 13.0% for females among the residents of Area Code 617, 18 to 24 year old males and 18 to 24 year old females are the most vulnerable to poverty, with 19,131 males (23.0%) and 21,082 females (25.0%) in their respective age groups living below the poverty level.
| Age Bracket | Male | Female |
| Under 5 Years | 6,253 (13.3%) | 5,924 (13.4%) |
| 5 Years | 1,632 (17.6%) | 698 (10.5%) |
| 6 to 11 Years | 7,541 (15.2%) | 6,679 (13.0%) |
| 12 to 14 Years | 3,614 (13.4%) | 3,812 (14.9%) |
| 15 Years | 1,830 (21.3%) | 1,451 (15.6%) |
| 16 and 17 Years | 2,440 (13.3%) | 2,185 (12.7%) |
| 18 to 24 Years | 19,131 (23.0%) | 21,082 (25.0%) |
| 25 to 34 Years | 15,478 (8.3%) | 19,204 (10.4%) |
| 35 to 44 Years | 8,510 (6.6%) | 12,581 (10.1%) |
| 45 to 54 Years | 8,965 (8.4%) | 10,169 (9.3%) |
| 55 to 64 Years | 9,540 (9.3%) | 11,678 (10.7%) |
| 65 to 74 Years | 7,444 (10.7%) | 10,255 (12.3%) |
| 75 Years and over | 5,563 (13.1%) | 12,982 (19.4%) |
| Total | 97,941 (11.1%) | 118,700 (13.0%) |
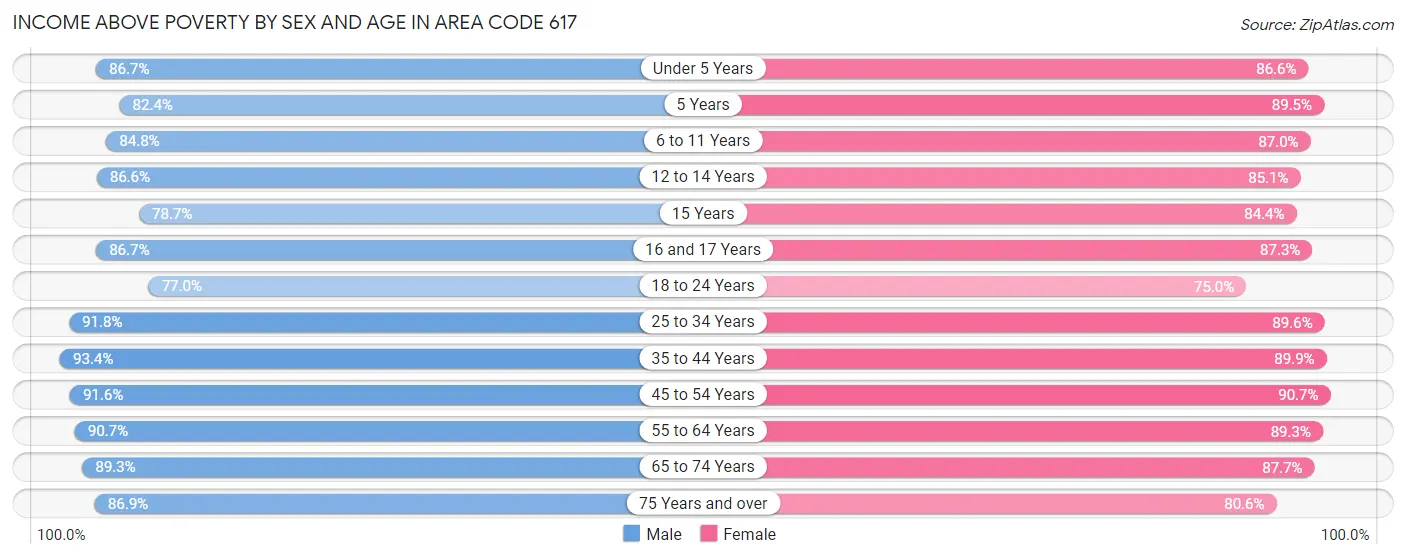
Income Above Poverty by Sex and Age in Area Code 617
According to the poverty statistics in Area Code 617, males aged 35 to 44 years and females aged 45 to 54 years are the age groups that are most secure financially, with 93.4% of males and 90.7% of females in these age groups living above the poverty line.
| Age Bracket | Male | Female |
| Under 5 Years | 40,818 (86.7%) | 38,260 (86.6%) |
| 5 Years | 7,612 (82.4%) | 5,928 (89.5%) |
| 6 to 11 Years | 42,111 (84.8%) | 44,621 (87.0%) |
| 12 to 14 Years | 23,334 (86.6%) | 21,786 (85.1%) |
| 15 Years | 6,779 (78.7%) | 7,835 (84.4%) |
| 16 and 17 Years | 15,901 (86.7%) | 15,018 (87.3%) |
| 18 to 24 Years | 63,890 (77.0%) | 63,383 (75.0%) |
| 25 to 34 Years | 172,121 (91.7%) | 165,283 (89.6%) |
| 35 to 44 Years | 120,337 (93.4%) | 112,432 (89.9%) |
| 45 to 54 Years | 97,435 (91.6%) | 98,847 (90.7%) |
| 55 to 64 Years | 92,661 (90.7%) | 97,041 (89.3%) |
| 65 to 74 Years | 62,087 (89.3%) | 73,234 (87.7%) |
| 75 Years and over | 37,043 (86.9%) | 54,087 (80.6%) |
| Total | 782,129 (88.9%) | 797,755 (87.1%) |
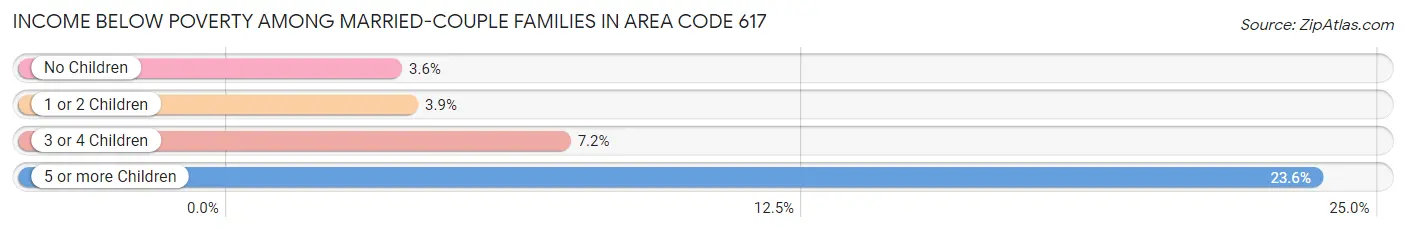
Income Below Poverty Among Married-Couple Families in Area Code 617
The poverty statistics for married-couple families in Area Code 617 show that 4.0% or 11,454 of the total 289,559 families live below the poverty line. Families with 5 or more children have the highest poverty rate of 23.6%, comprising of 185 families. On the other hand, families with no children have the lowest poverty rate of 3.6%, which includes 5,951 families.
| Children | Above Poverty | Below Poverty |
| No Children | 160,888 (96.4%) | 5,951 (3.6%) |
| 1 or 2 Children | 101,670 (96.1%) | 4,151 (3.9%) |
| 3 or 4 Children | 14,948 (92.8%) | 1,167 (7.2%) |
| 5 or more Children | 599 (76.4%) | 185 (23.6%) |
| Total | 278,105 (96.0%) | 11,454 (4.0%) |
Income Below Poverty Among Single-Parent Households in Area Code 617
According to the poverty data in Area Code 617, 11.6% or 3,629 single-father households and 19.8% or 16,530 single-mother households are living below the poverty line. Among single-father households, those with 3 or 4 children have the highest poverty rate, with 426 households (30.2%) experiencing poverty. Likewise, among single-mother households, those with 5 or more children have the highest poverty rate, with 157 households (82.2%) falling below the poverty line.
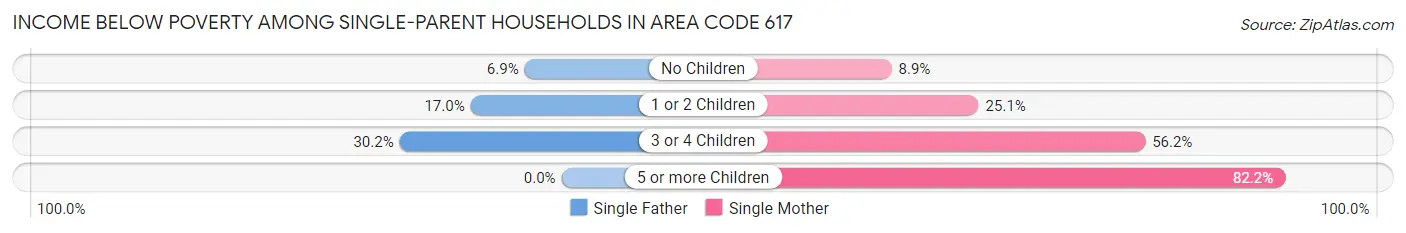
| Children | Single Father | Single Mother |
| No Children | 1,265 (6.9%) | 3,413 (8.9%) |
| 1 or 2 Children | 1,938 (17.0%) | 10,039 (25.1%) |
| 3 or 4 Children | 426 (30.2%) | 2,921 (56.2%) |
| 5 or more Children | 0 (0.0%) | 157 (82.2%) |
| Total | 3,629 (11.6%) | 16,530 (19.8%) |
Income Below Poverty Among Married-Couple vs Single-Parent Households in Area Code 617
The poverty data for Area Code 617 shows that 11,454 of the married-couple family households (4.0%) and 20,159 of the single-parent households (17.6%) are living below the poverty level. Within the married-couple family households, those with 5 or more children have the highest poverty rate, with 185 households (23.6%) falling below the poverty line. Among the single-parent households, those with 5 or more children have the highest poverty rate, with 157 household (82.2%) living below poverty.
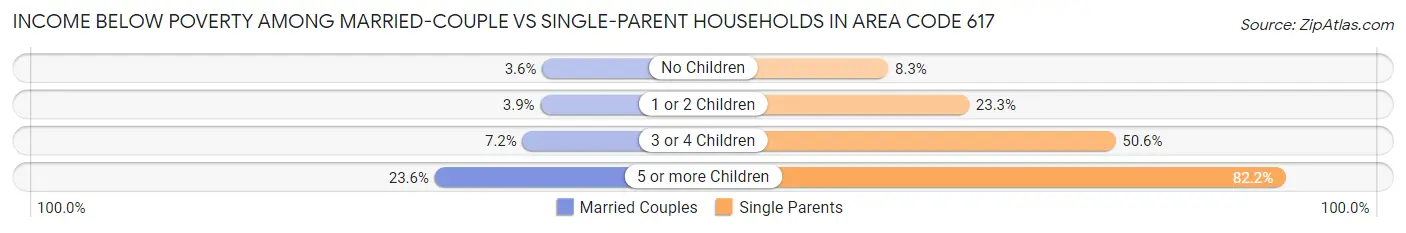
| Children | Married-Couple Families | Single-Parent Households |
| No Children | 5,951 (3.6%) | 4,678 (8.3%) |
| 1 or 2 Children | 4,151 (3.9%) | 11,977 (23.3%) |
| 3 or 4 Children | 1,167 (7.2%) | 3,347 (50.6%) |
| 5 or more Children | 185 (23.6%) | 157 (82.2%) |
| Total | 11,454 (4.0%) | 20,159 (17.6%) |
Race in Area Code 617
The most populous races in Area Code 617 are White / Caucasian (1,129,216 | 60.2%), Hispanic or Latino (282,260 | 15.0%), and Black / African American (228,423 | 12.2%).
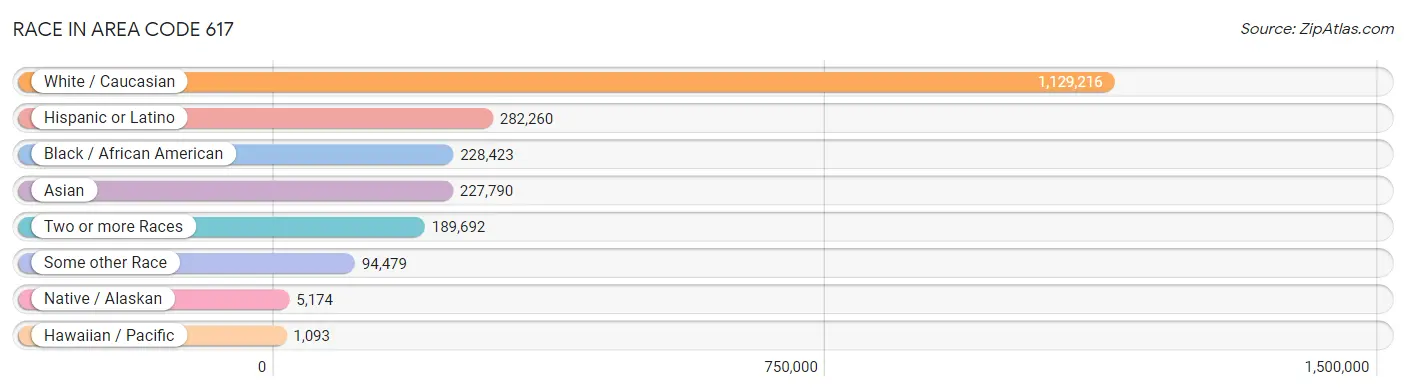
| Race | # Population | % Population |
| Asian | 227,790 | 12.1% |
| Black / African American | 228,423 | 12.2% |
| Hawaiian / Pacific | 1,093 | 0.1% |
| Hispanic or Latino | 282,260 | 15.0% |
| Native / Alaskan | 5,174 | 0.3% |
| White / Caucasian | 1,129,216 | 60.2% |
| Two or more Races | 189,692 | 10.1% |
| Some other Race | 94,479 | 5.0% |
| Total | 1,875,867 | 100.0% |
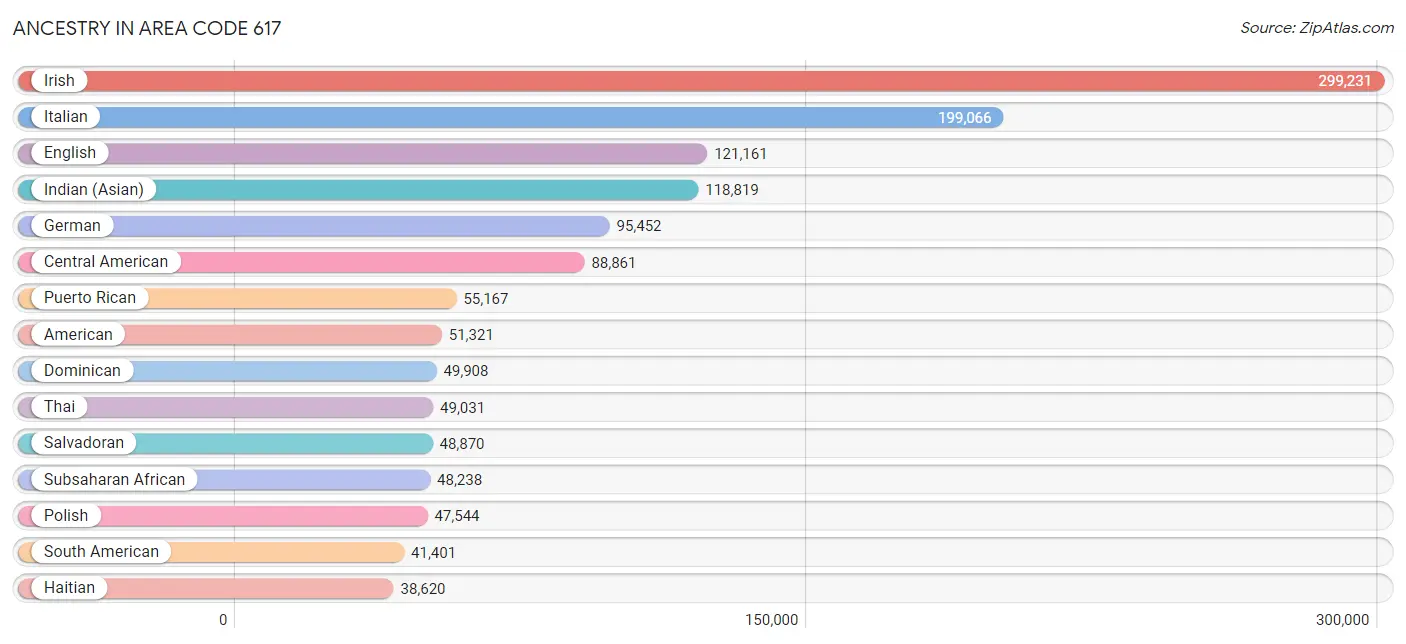
Ancestry in Area Code 617
The most populous ancestries reported in Area Code 617 are Irish (299,231 | 16.0%), Italian (199,066 | 10.6%), English (121,161 | 6.5%), Indian (Asian) (118,819 | 6.3%), and German (95,452 | 5.1%), together accounting for 44.4% of all Area Code 617 residents.
| Ancestry | # Population | % Population |
| Afghan | 395 | 0.0% |
| African | 11,020 | 0.6% |
| Alaska Native | 68 | 0.0% |
| Alaskan Athabascan | 27 | 0.0% |
| Albanian | 8,138 | 0.4% |
| Alsatian | 132 | 0.0% |
| American | 51,321 | 2.7% |
| Apache | 129 | 0.0% |
| Arab | 26,399 | 1.4% |
| Argentinean | 1,899 | 0.1% |
| Armenian | 8,926 | 0.5% |
| Assyrian / Chaldean / Syriac | 170 | 0.0% |
| Australian | 658 | 0.0% |
| Austrian | 3,331 | 0.2% |
| Bahamian | 155 | 0.0% |
| Bangladeshi | 79 | 0.0% |
| Barbadian | 3,428 | 0.2% |
| Basque | 248 | 0.0% |
| Belgian | 1,864 | 0.1% |
| Belizean | 208 | 0.0% |
| Bermudan | 154 | 0.0% |
| Bhutanese | 8,191 | 0.4% |
| Blackfeet | 705 | 0.0% |
| Bolivian | 759 | 0.0% |
| Brazilian | 23,852 | 1.3% |
| British | 9,222 | 0.5% |
| British West Indian | 2,720 | 0.1% |
| Bulgarian | 2,126 | 0.1% |
| Burmese | 16,334 | 0.9% |
| Cajun | 171 | 0.0% |
| Cambodian | 177 | 0.0% |
| Canadian | 8,664 | 0.5% |
| Cape Verdean | 15,124 | 0.8% |
| Carpatho Rusyn | 64 | 0.0% |
| Celtic | 277 | 0.0% |
| Central American | 88,861 | 4.7% |
| Central American Indian | 2,925 | 0.2% |
| Cherokee | 1,753 | 0.1% |
| Cheyenne | 115 | 0.0% |
| Chickasaw | 21 | 0.0% |
| Chilean | 1,748 | 0.1% |
| Chippewa | 55 | 0.0% |
| Choctaw | 203 | 0.0% |
| Colombian | 23,871 | 1.3% |
| Comanche | 20 | 0.0% |
| Costa Rican | 1,766 | 0.1% |
| Cree | 18 | 0.0% |
| Creek | 82 | 0.0% |
| Croatian | 1,593 | 0.1% |
| Crow | 15 | 0.0% |
| Cuban | 5,504 | 0.3% |
| Cypriot | 207 | 0.0% |
| Czech | 3,715 | 0.2% |
| Czechoslovakian | 414 | 0.0% |
| Danish | 4,269 | 0.2% |
| Delaware | 19 | 0.0% |
| Dominican | 49,908 | 2.7% |
| Dutch | 7,715 | 0.4% |
| Dutch West Indian | 55 | 0.0% |
| Eastern European | 16,641 | 0.9% |
| Ecuadorian | 3,770 | 0.2% |
| Egyptian | 1,952 | 0.1% |
| English | 121,161 | 6.5% |
| Estonian | 282 | 0.0% |
| Ethiopian | 4,999 | 0.3% |
| European | 23,877 | 1.3% |
| Filipino | 3,371 | 0.2% |
| Finnish | 3,347 | 0.2% |
| French | 38,149 | 2.0% |
| French American Indian | 121 | 0.0% |
| French Canadian | 27,381 | 1.5% |
| German | 95,452 | 5.1% |
| German Russian | 103 | 0.0% |
| Ghanaian | 1,409 | 0.1% |
| Greek | 19,388 | 1.0% |
| Guamanian / Chamorro | 401 | 0.0% |
| Guatemalan | 21,280 | 1.1% |
| Guyanese | 799 | 0.0% |
| Haitian | 38,620 | 2.1% |
| Honduran | 12,031 | 0.6% |
| Houma | 16 | 0.0% |
| Hungarian | 5,836 | 0.3% |
| Icelander | 202 | 0.0% |
| Indian (Asian) | 118,819 | 6.3% |
| Indonesian | 874 | 0.1% |
| Inupiat | 107 | 0.0% |
| Iranian | 4,635 | 0.3% |
| Iraqi | 574 | 0.0% |
| Irish | 299,231 | 16.0% |
| Iroquois | 163 | 0.0% |
| Israeli | 3,017 | 0.2% |
| Italian | 199,066 | 10.6% |
| Jamaican | 15,920 | 0.9% |
| Japanese | 3,873 | 0.2% |
| Jordanian | 649 | 0.0% |
| Kenyan | 2,583 | 0.1% |
| Korean | 10,362 | 0.5% |
| Laotian | 1,673 | 0.1% |
| Latvian | 1,486 | 0.1% |
| Lebanese | 6,861 | 0.4% |
| Liberian | 513 | 0.0% |
| Lithuanian | 8,298 | 0.4% |
| Luxembourger | 88 | 0.0% |
| Macedonian | 181 | 0.0% |
| Malaysian | 515 | 0.0% |
| Maltese | 122 | 0.0% |
| Mexican | 17,201 | 0.9% |
| Mexican American Indian | 737 | 0.0% |
| Mongolian | 825 | 0.0% |
| Moroccan | 5,667 | 0.3% |
| Native Hawaiian | 899 | 0.1% |
| Navajo | 274 | 0.0% |
| New Zealander | 321 | 0.0% |
| Nicaraguan | 973 | 0.1% |
| Nigerian | 6,081 | 0.3% |
| Northern European | 2,940 | 0.2% |
| Norwegian | 8,885 | 0.5% |
| Okinawan | 258 | 0.0% |
| Osage | 95 | 0.0% |
| Paiute | 12 | 0.0% |
| Pakistani | 2,122 | 0.1% |
| Palestinian | 1,212 | 0.1% |
| Panamanian | 1,166 | 0.1% |
| Paraguayan | 276 | 0.0% |
| Pennsylvania German | 106 | 0.0% |
| Peruvian | 4,892 | 0.3% |
| Polish | 47,544 | 2.5% |
| Portuguese | 24,950 | 1.3% |
| Potawatomi | 21 | 0.0% |
| Pueblo | 44 | 0.0% |
| Puerto Rican | 55,167 | 2.9% |
| Romanian | 3,425 | 0.2% |
| Russian | 30,810 | 1.6% |
| Salvadoran | 48,870 | 2.6% |
| Samoan | 236 | 0.0% |
| Scandinavian | 2,751 | 0.2% |
| Scotch-Irish | 8,446 | 0.4% |
| Scottish | 25,792 | 1.4% |
| Seminole | 11 | 0.0% |
| Senegalese | 59 | 0.0% |
| Serbian | 1,248 | 0.1% |
| Sierra Leonean | 530 | 0.0% |
| Sioux | 369 | 0.0% |
| Slavic | 464 | 0.0% |
| Slovak | 2,036 | 0.1% |
| Slovene | 324 | 0.0% |
| Somali | 1,570 | 0.1% |
| South African | 748 | 0.0% |
| South American | 41,401 | 2.2% |
| South American Indian | 680 | 0.0% |
| Spaniard | 4,802 | 0.3% |
| Spanish | 3,039 | 0.2% |
| Spanish American | 165 | 0.0% |
| Spanish American Indian | 12 | 0.0% |
| Sri Lankan | 29,667 | 1.6% |
| Subsaharan African | 48,238 | 2.6% |
| Sudanese | 486 | 0.0% |
| Swedish | 17,936 | 1.0% |
| Swiss | 3,664 | 0.2% |
| Syrian | 1,761 | 0.1% |
| Taiwanese | 10 | 0.0% |
| Thai | 49,031 | 2.6% |
| Tlingit-Haida | 76 | 0.0% |
| Tohono O'Odham | 8 | 0.0% |
| Tongan | 59 | 0.0% |
| Trinidadian and Tobagonian | 6,440 | 0.3% |
| Turkish | 3,971 | 0.2% |
| U.S. Virgin Islander | 210 | 0.0% |
| Ugandan | 1,511 | 0.1% |
| Ukrainian | 7,937 | 0.4% |
| Uruguayan | 357 | 0.0% |
| Venezuelan | 3,581 | 0.2% |
| Vietnamese | 1,524 | 0.1% |
| Welsh | 5,457 | 0.3% |
| West Indian | 2,931 | 0.2% |
| Yaqui | 13 | 0.0% |
| Yugoslavian | 1,565 | 0.1% |
| Yup'ik | 12 | 0.0% |
| Zimbabwean | 107 | 0.0% | View All 179 Rows |
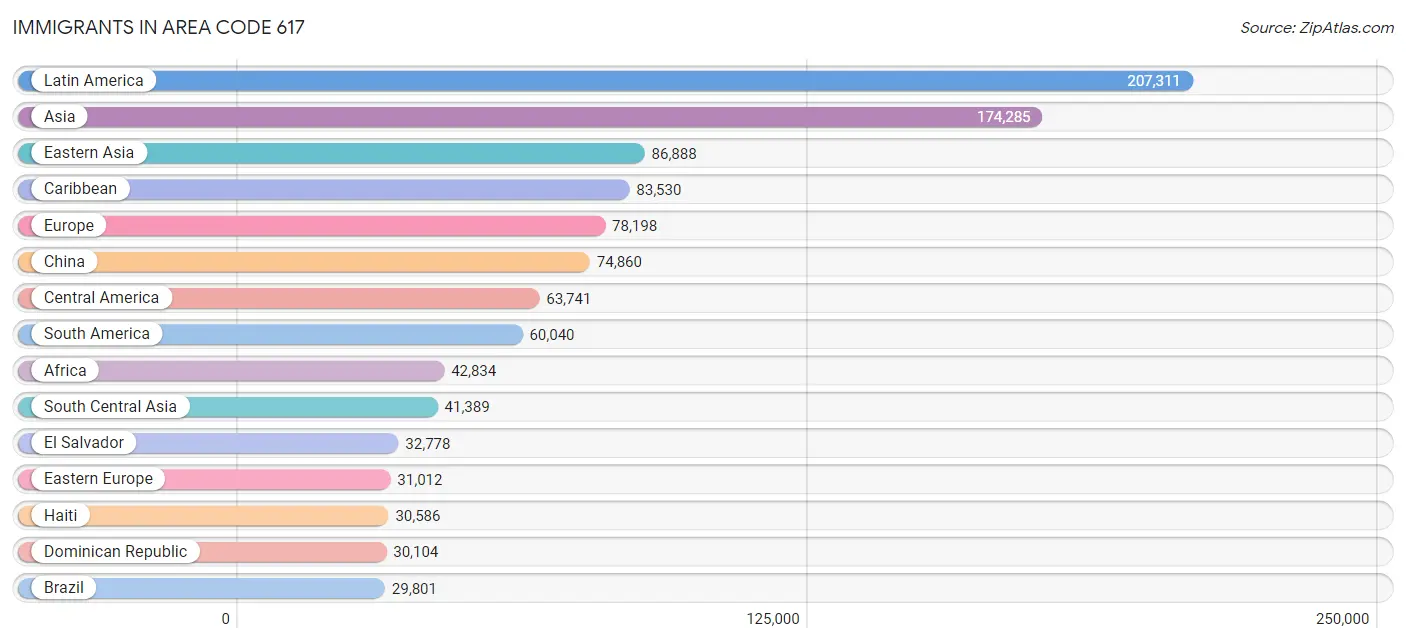
Immigrants in Area Code 617
The most numerous immigrant groups reported in Area Code 617 came from Latin America (207,311 | 11.1%), Asia (174,285 | 9.3%), Eastern Asia (86,888 | 4.6%), Caribbean (83,530 | 4.4%), and Europe (78,198 | 4.2%), together accounting for 33.6% of all Area Code 617 residents.
| Immigration Origin | # Population | % Population |
| Afghanistan | 387 | 0.0% |
| Africa | 42,834 | 2.3% |
| Albania | 6,117 | 0.3% |
| Argentina | 1,479 | 0.1% |
| Armenia | 839 | 0.0% |
| Asia | 174,285 | 9.3% |
| Australia | 1,130 | 0.1% |
| Austria | 270 | 0.0% |
| Azores | 684 | 0.0% |
| Bahamas | 92 | 0.0% |
| Bangladesh | 1,870 | 0.1% |
| Barbados | 1,946 | 0.1% |
| Belarus | 947 | 0.1% |
| Belgium | 432 | 0.0% |
| Belize | 41 | 0.0% |
| Bolivia | 389 | 0.0% |
| Bosnia and Herzegovina | 1,417 | 0.1% |
| Brazil | 29,801 | 1.6% |
| Bulgaria | 1,512 | 0.1% |
| Cabo Verde | 10,274 | 0.5% |
| Cambodia | 1,639 | 0.1% |
| Cameroon | 691 | 0.0% |
| Canada | 8,705 | 0.5% |
| Caribbean | 83,530 | 4.4% |
| Central America | 63,741 | 3.4% |
| Chile | 1,428 | 0.1% |
| China | 74,860 | 4.0% |
| Colombia | 17,695 | 0.9% |
| Congo | 12 | 0.0% |
| Costa Rica | 1,061 | 0.1% |
| Croatia | 370 | 0.0% |
| Cuba | 1,567 | 0.1% |
| Czechoslovakia | 819 | 0.0% |
| Denmark | 745 | 0.0% |
| Dominica | 1,081 | 0.1% |
| Dominican Republic | 30,104 | 1.6% |
| Eastern Africa | 11,522 | 0.6% |
| Eastern Asia | 86,888 | 4.6% |
| Eastern Europe | 31,012 | 1.7% |
| Ecuador | 2,268 | 0.1% |
| Egypt | 1,556 | 0.1% |
| El Salvador | 32,778 | 1.8% |
| England | 2,627 | 0.1% |
| Eritrea | 614 | 0.0% |
| Ethiopia | 4,740 | 0.3% |
| Europe | 78,198 | 4.2% |
| Fiji | 14 | 0.0% |
| France | 3,905 | 0.2% |
| Germany | 4,606 | 0.3% |
| Ghana | 1,976 | 0.1% |
| Greece | 3,195 | 0.2% |
| Grenada | 425 | 0.0% |
| Guatemala | 13,798 | 0.7% |
| Guyana | 720 | 0.0% |
| Haiti | 30,586 | 1.6% |
| Honduras | 7,830 | 0.4% |
| Hong Kong | 5,252 | 0.3% |
| Hungary | 704 | 0.0% |
| India | 27,824 | 1.5% |
| Indonesia | 931 | 0.1% |
| Iran | 3,676 | 0.2% |
| Iraq | 529 | 0.0% |
| Ireland | 5,933 | 0.3% |
| Israel | 4,039 | 0.2% |
| Italy | 8,813 | 0.5% |
| Jamaica | 10,009 | 0.5% |
| Japan | 3,597 | 0.2% |
| Jordan | 783 | 0.0% |
| Kazakhstan | 334 | 0.0% |
| Kenya | 2,579 | 0.1% |
| Korea | 8,285 | 0.4% |
| Kuwait | 807 | 0.0% |
| Laos | 220 | 0.0% |
| Latin America | 207,311 | 11.1% |
| Latvia | 422 | 0.0% |
| Lebanon | 1,742 | 0.1% |
| Liberia | 324 | 0.0% |
| Lithuania | 311 | 0.0% |
| Malaysia | 952 | 0.1% |
| Mexico | 5,028 | 0.3% |
| Middle Africa | 1,531 | 0.1% |
| Moldova | 598 | 0.0% |
| Morocco | 5,767 | 0.3% |
| Nepal | 3,423 | 0.2% |
| Netherlands | 1,149 | 0.1% |
| Nicaragua | 425 | 0.0% |
| Nigeria | 3,202 | 0.2% |
| North Macedonia | 40 | 0.0% |
| Northern Africa | 9,159 | 0.5% |
| Northern Europe | 15,927 | 0.9% |
| Norway | 132 | 0.0% |
| Oceania | 1,742 | 0.1% |
| Pakistan | 2,730 | 0.2% |
| Panama | 686 | 0.0% |
| Peru | 3,431 | 0.2% |
| Philippines | 4,185 | 0.2% |
| Poland | 2,307 | 0.1% |
| Portugal | 4,535 | 0.2% |
| Romania | 1,306 | 0.1% |
| Russia | 7,775 | 0.4% |
| Saudi Arabia | 1,102 | 0.1% |
| Scotland | 376 | 0.0% |
| Senegal | 120 | 0.0% |
| Serbia | 623 | 0.0% |
| Sierra Leone | 773 | 0.0% |
| Singapore | 742 | 0.0% |
| Somalia | 928 | 0.1% |
| South Africa | 1,389 | 0.1% |
| South America | 60,040 | 3.2% |
| South Central Asia | 41,389 | 2.2% |
| South Eastern Asia | 29,670 | 1.6% |
| Southern Europe | 19,617 | 1.1% |
| Spain | 3,068 | 0.2% |
| Sri Lanka | 612 | 0.0% |
| St. Vincent and the Grenadines | 174 | 0.0% |
| Sudan | 473 | 0.0% |
| Sweden | 619 | 0.0% |
| Switzerland | 1,064 | 0.1% |
| Syria | 1,140 | 0.1% |
| Taiwan | 3,964 | 0.2% |
| Thailand | 1,804 | 0.1% |
| Trinidad and Tobago | 5,400 | 0.3% |
| Turkey | 3,088 | 0.2% |
| Uganda | 1,729 | 0.1% |
| Ukraine | 3,790 | 0.2% |
| Uruguay | 193 | 0.0% |
| Uzbekistan | 249 | 0.0% |
| Venezuela | 2,378 | 0.1% |
| Vietnam | 18,292 | 1.0% |
| West Indies | 463 | 0.0% |
| Western Africa | 17,913 | 0.9% |
| Western Asia | 15,958 | 0.9% |
| Western Europe | 11,437 | 0.6% |
| Yemen | 246 | 0.0% |
| Zaire | 212 | 0.0% |
| Zimbabwe | 288 | 0.0% | View All 136 Rows |
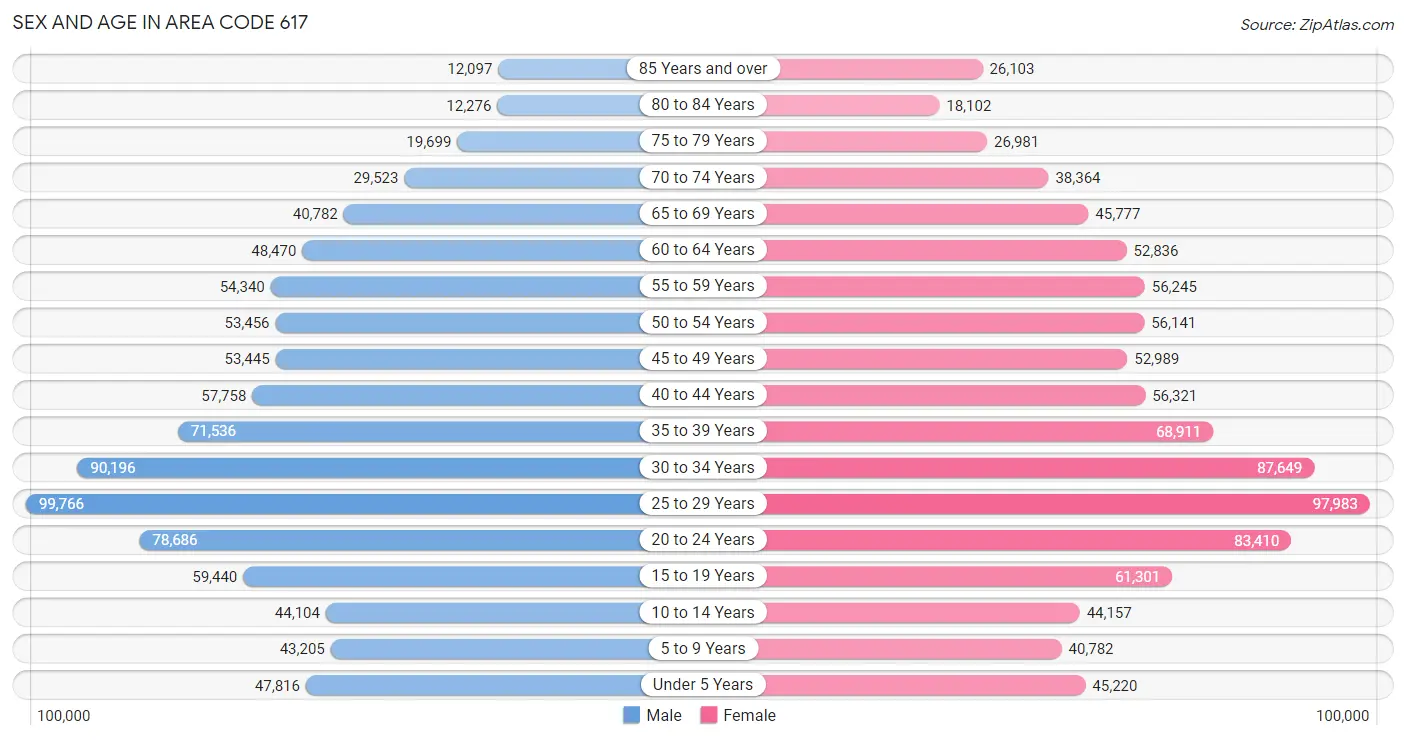
Sex and Age in Area Code 617
Sex and Age in Area Code 617
The most populous age groups in Area Code 617 are 25 to 29 Years (99,766 | 10.9%) for men and 25 to 29 Years (97,983 | 10.2%) for women.
| Age Bracket | Male | Female |
| Under 5 Years | 47,816 (5.2%) | 45,220 (4.7%) |
| 5 to 9 Years | 43,205 (4.7%) | 40,782 (4.3%) |
| 10 to 14 Years | 44,104 (4.8%) | 44,157 (4.6%) |
| 15 to 19 Years | 59,440 (6.5%) | 61,301 (6.4%) |
| 20 to 24 Years | 78,686 (8.6%) | 83,410 (8.7%) |
| 25 to 29 Years | 99,766 (10.9%) | 97,983 (10.2%) |
| 30 to 34 Years | 90,196 (9.8%) | 87,649 (9.1%) |
| 35 to 39 Years | 71,536 (7.8%) | 68,911 (7.2%) |
| 40 to 44 Years | 57,758 (6.3%) | 56,321 (5.9%) |
| 45 to 49 Years | 53,445 (5.8%) | 52,989 (5.5%) |
| 50 to 54 Years | 53,456 (5.8%) | 56,141 (5.9%) |
| 55 to 59 Years | 54,340 (5.9%) | 56,245 (5.9%) |
| 60 to 64 Years | 48,470 (5.3%) | 52,836 (5.5%) |
| 65 to 69 Years | 40,782 (4.4%) | 45,777 (4.8%) |
| 70 to 74 Years | 29,523 (3.2%) | 38,364 (4.0%) |
| 75 to 79 Years | 19,699 (2.1%) | 26,981 (2.8%) |
| 80 to 84 Years | 12,276 (1.3%) | 18,102 (1.9%) |
| 85 Years and over | 12,097 (1.3%) | 26,103 (2.7%) |
| Total | 916,595 (100.0%) | 959,272 (100.0%) |
Families and Households in Area Code 617
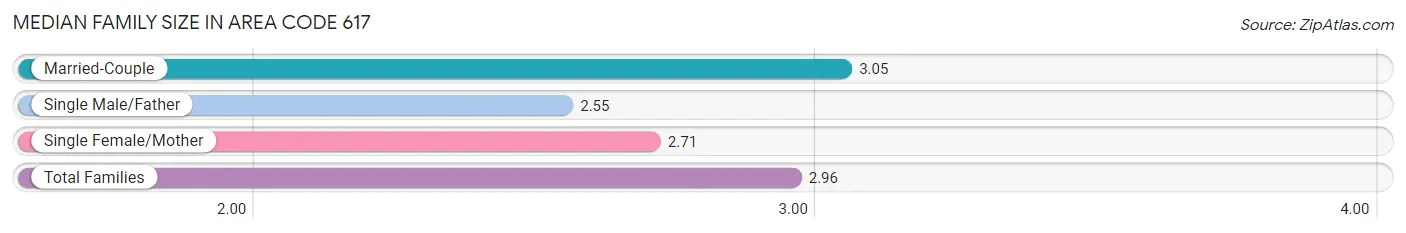
Median Family Size in Area Code 617
The median family size in Area Code 617 is 2.96 persons per family, with married-couple families (289,559 | 71.6%) accounting for the largest median family size of 3.04649 persons per family. On the other hand, single male/father families (31,197 | 7.7%) represent the smallest median family size with 2.55 persons per family.
| Family Type | # Families | Family Size |
| Married-Couple | 289,559 (71.6%) | 3.05 |
| Single Male/Father | 31,197 (7.7%) | 2.55 |
| Single Female/Mother | 83,550 (20.7%) | 2.71 |
| Total Families | 404,306 (100.0%) | 2.96 |
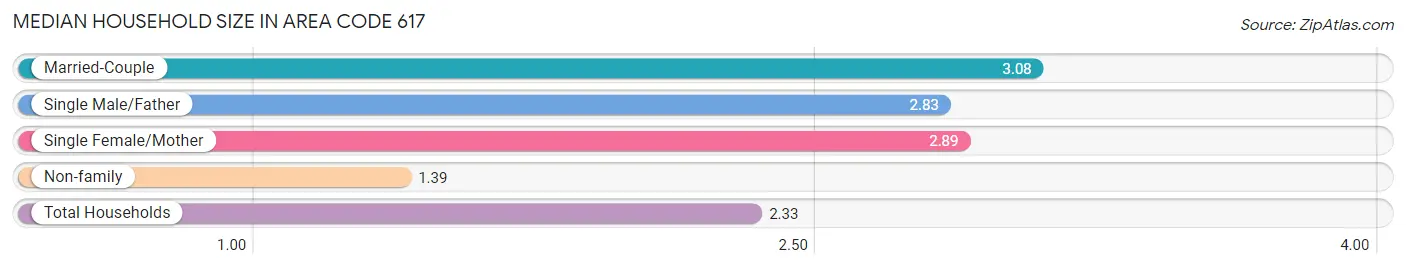
Median Household Size in Area Code 617
The median household size in Area Code 617 is 2.33 persons per household, with married-couple households (289,559 | 38.3%) accounting for the largest median household size of 3.0809 persons per household. non-family households (351,987 | 46.5%) represent the smallest median household size with 1.39 persons per household.
| Household Type | # Households | Household Size |
| Married-Couple | 289,559 (38.3%) | 3.08 |
| Single Male/Father | 31,197 (4.1%) | 2.83 |
| Single Female/Mother | 83,550 (11.1%) | 2.89 |
| Non-family | 351,987 (46.5%) | 1.39 |
| Total Households | 756,293 (100.0%) | 2.33 |
Household Size by Marriage Status in Area Code 617
Out of a total of 756,293 households in Area Code 617, 404,306 (53.5%) are family households, while 351,987 (46.5%) are nonfamily households. The most numerous type of family households are 2-person households, comprising 170,116, and the most common type of nonfamily households are 1-person households, comprising 243,130.
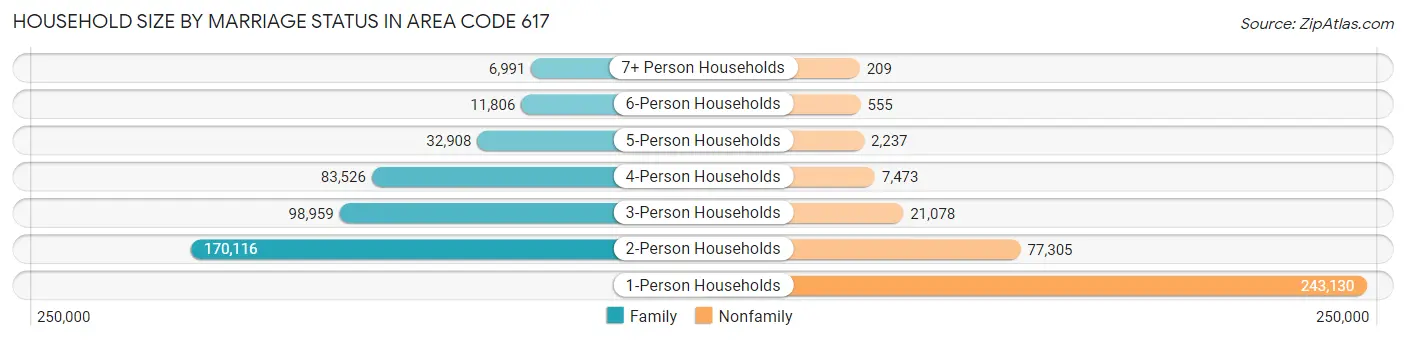
| Household Size | Family Households | Nonfamily Households |
| 1-Person Households | - | 243,130 (32.2%) |
| 2-Person Households | 170,116 (22.5%) | 77,305 (10.2%) |
| 3-Person Households | 98,959 (13.1%) | 21,078 (2.8%) |
| 4-Person Households | 83,526 (11.0%) | 7,473 (1.0%) |
| 5-Person Households | 32,908 (4.3%) | 2,237 (0.3%) |
| 6-Person Households | 11,806 (1.6%) | 555 (0.1%) |
| 7+ Person Households | 6,991 (0.9%) | 209 (0.0%) |
| Total | 404,306 (53.5%) | 351,987 (46.5%) |
Female Fertility in Area Code 617
Fertility by Age in Area Code 617
Average fertility rate in Area Code 617 is 35.9 births per 1,000 women. Women in the age bracket of 35 to 50 years have the highest fertility rate with 45.9 births per 1,000 women. Women in the age bracket of 20 to 34 years acount for 55.3% of all women with births.
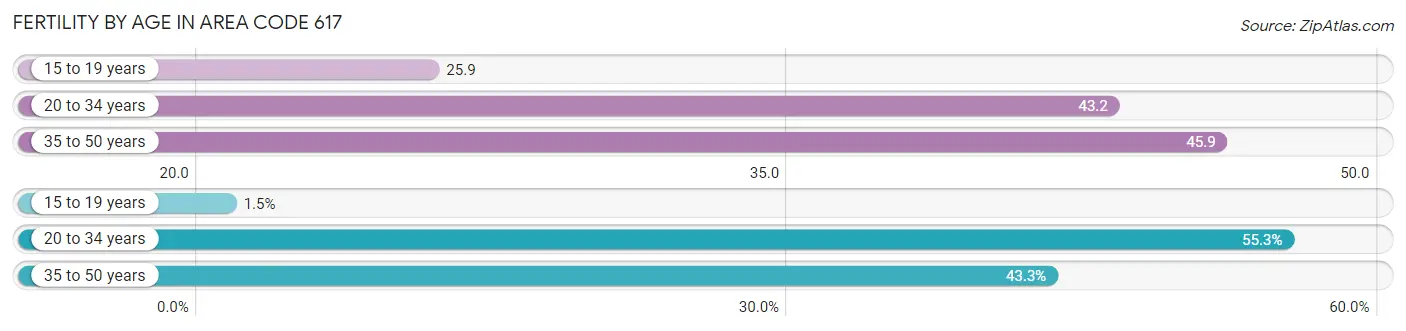
| Age Bracket | Women with Births | Births / 1,000 Women |
| 15 to 19 years | 274 (1.5%) | 25.9 |
| 20 to 34 years | 10,353 (55.3%) | 43.2 |
| 35 to 50 years | 8,101 (43.3%) | 45.9 |
| Total | 18,728 (100.0%) | 35.9 |
Fertility by Age by Marriage Status in Area Code 617
77.0% of women with births (18,728) in Area Code 617 are married. The highest percentage of unmarried women with births falls into 15 to 19 years age bracket with 100.0% of them unmarried at the time of birth, while the lowest percentage of unmarried women with births belong to 20 to 34 years age bracket with 29.2% of them unmarried.
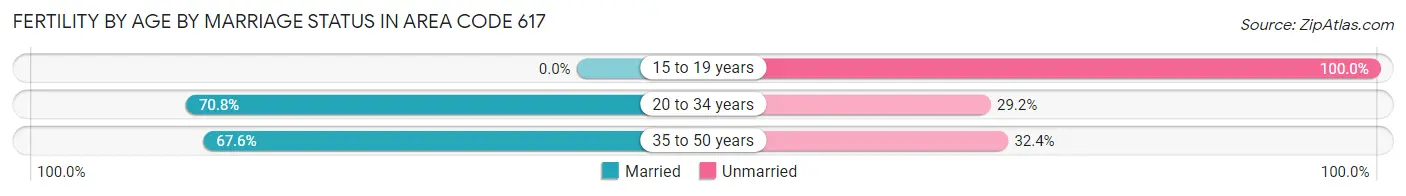
| Age Bracket | Married | Unmarried |
| 15 to 19 years | 0 (0.0%) | 274 (100.0%) |
| 20 to 34 years | 7,326 (70.8%) | 3,027 (29.2%) |
| 35 to 50 years | 5,477 (67.6%) | 2,624 (32.4%) |
| Total | 14,424 (77.0%) | 4,304 (23.0%) |
Fertility by Education in Area Code 617
Average fertility rate in Area Code 617 is 35.9 births per 1,000 women. Women with the education attainment of graduate degree have the highest fertility rate of 58.7 births per 1,000 women, while women with the education attainment of bachelor's degree have the lowest fertility at 37.8 births per 1,000 women. Women with the education attainment of graduate degree represent 36.9% of all women with births.
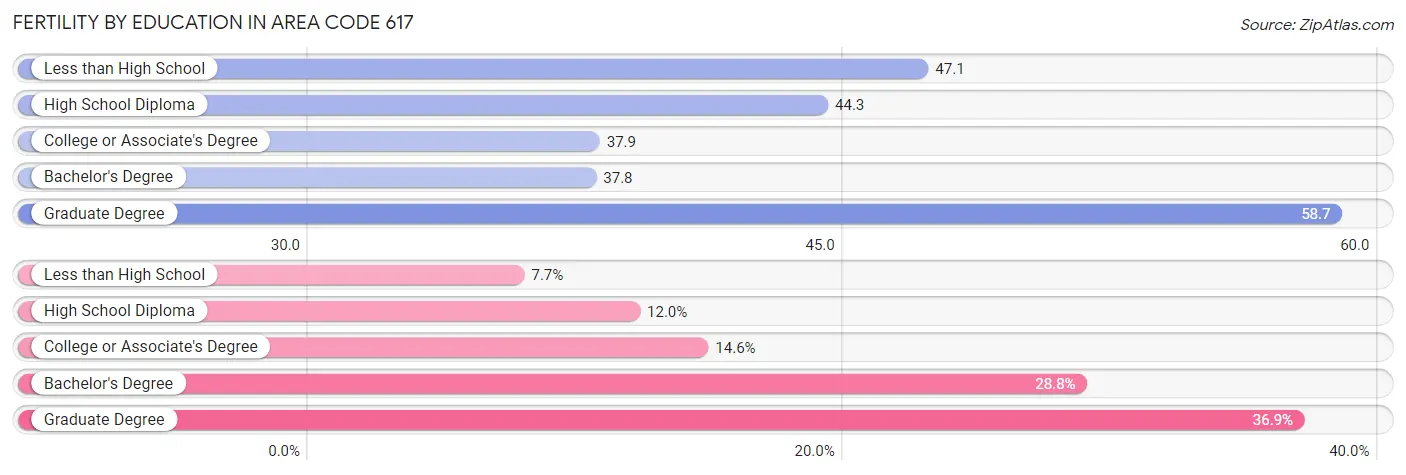
| Educational Attainment | Women with Births | Births / 1,000 Women |
| Less than High School | 1,440 (7.7%) | 47.1 |
| High School Diploma | 2,251 (12.0%) | 44.3 |
| College or Associate's Degree | 2,731 (14.6%) | 37.9 |
| Bachelor's Degree | 5,389 (28.8%) | 37.8 |
| Graduate Degree | 6,917 (36.9%) | 58.7 |
| Total | 18,728 (100.0%) | 35.9 |
Fertility by Education by Marriage Status in Area Code 617
23.0% of women with births in Area Code 617 are unmarried. Women with the educational attainment of graduate degree are most likely to be married with 80.1% of them married at childbirth, while women with the educational attainment of college or associate's degree are least likely to be married with 67.6% of them unmarried at childbirth.
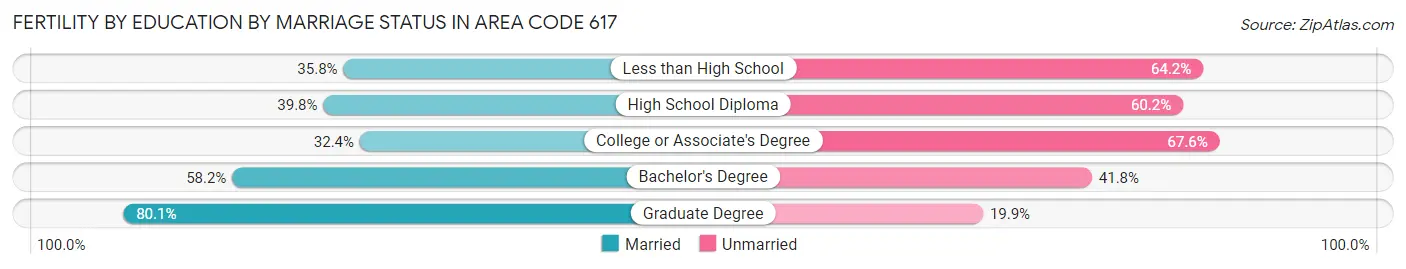
| Educational Attainment | Married | Unmarried |
| Less than High School | 515 (35.8%) | 925 (64.2%) |
| High School Diploma | 896 (39.8%) | 1,355 (60.2%) |
| College or Associate's Degree | 886 (32.4%) | 1,845 (67.6%) |
| Bachelor's Degree | 3,135 (58.2%) | 2,254 (41.8%) |
| Graduate Degree | 5,542 (80.1%) | 1,375 (19.9%) |
| Total | 14,424 (77.0%) | 4,304 (23.0%) |
Employment Characteristics in Area Code 617
Employment by Class of Employer in Area Code 617
Among the 1,034,550 employed individuals in Area Code 617, private company employees (656,555 | 63.5%), not-for-profit organizations (190,043 | 18.4%), and local government employees (59,009 | 5.7%) make up the most common classes of employment.
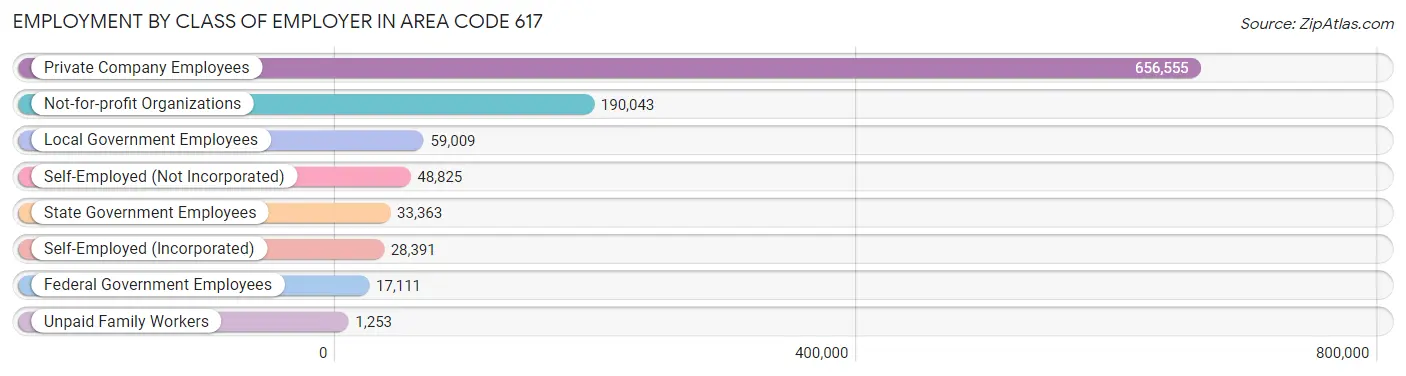
| Employer Class | # Employees | % Employees |
| Private Company Employees | 656,555 | 63.5% |
| Self-Employed (Incorporated) | 28,391 | 2.7% |
| Self-Employed (Not Incorporated) | 48,825 | 4.7% |
| Not-for-profit Organizations | 190,043 | 18.4% |
| Local Government Employees | 59,009 | 5.7% |
| State Government Employees | 33,363 | 3.2% |
| Federal Government Employees | 17,111 | 1.7% |
| Unpaid Family Workers | 1,253 | 0.1% |
| Total | 1,034,550 | 100.0% |
Employment Status by Age in Area Code 617
According to the labor force statistics for Area Code 617, out of the total population over 16 years of age (1,592,654), 69.3% or 1,103,231 individuals are in the labor force, with 5.1% or 55,713 of them unemployed. The age group with the highest labor force participation rate is 30 to 34 years, with 89.9% or 159,883 individuals in the labor force. Within the labor force, the 16 to 19 years age range has the highest percentage of unemployed individuals, with 1,152.5% or 465,310 of them being unemployed.
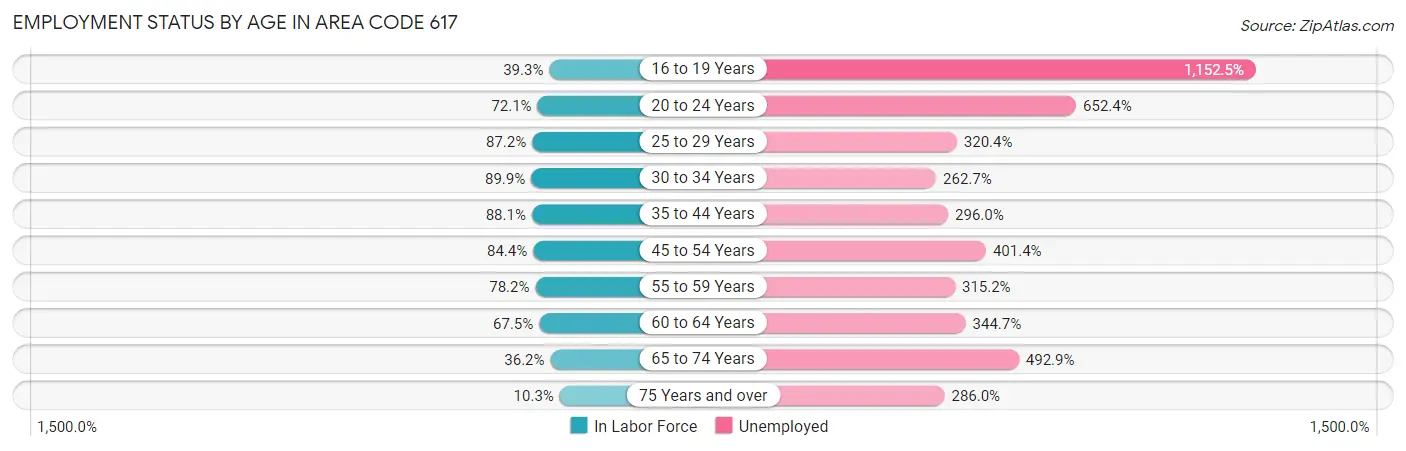
| Age Bracket | In Labor Force | Unemployed |
| 16 to 19 Years | 40,373 (39.3%) | 465,310 (1,152.5%) |
| 20 to 24 Years | 116,859 (72.1%) | 762,362 (652.4%) |
| 25 to 29 Years | 172,483 (87.2%) | 552,616 (320.4%) |
| 30 to 34 Years | 159,883 (89.9%) | 420,013 (262.7%) |
| 35 to 44 Years | 224,198 (88.1%) | 663,594 (296.0%) |
| 45 to 54 Years | 182,288 (84.4%) | 731,700 (401.4%) |
| 55 to 59 Years | 86,425 (78.1%) | 272,402 (315.2%) |
| 60 to 64 Years | 68,356 (67.5%) | 235,640 (344.7%) |
| 65 to 74 Years | 55,887 (36.2%) | 275,502 (492.9%) |
| 75 Years and over | 11,862 (10.3%) | 33,920 (286.0%) |
| Total | 1,103,254 (69.3%) | 55,763 (5.1%) |
Employment Status by Educational Attainment in Area Code 617
According to labor force statistics for Area Code 617, 84.2% of individuals (890,660) out of the total population between 25 and 64 years of age (1,058,042) are in the labor force, with 319.3% or 2,843,877 of them being unemployed. The group with the highest labor force participation rate are those with the educational attainment of bachelor's degree or higher, with 88.9% or 554,815 individuals in the labor force. Within the labor force, individuals with high school diploma education have the highest percentage of unemployment, with 648.0% or 835,408 of them being unemployed.
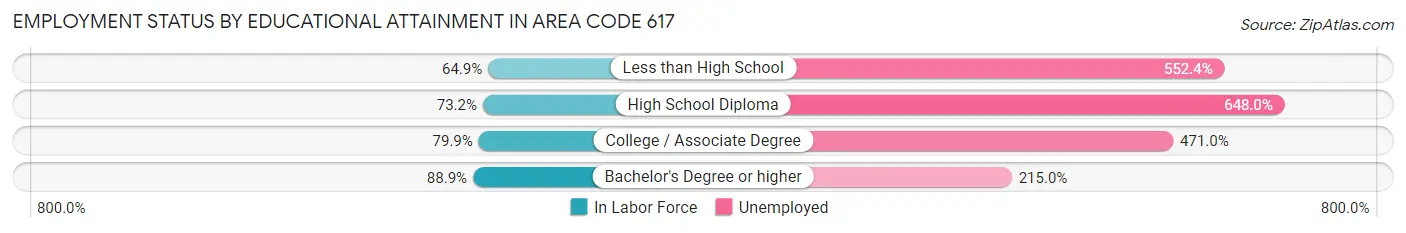
| Educational Attainment | In Labor Force | Unemployed |
| Less than High School | 52,771 (64.9%) | 448,969 (552.4%) |
| High School Diploma | 128,916 (73.2%) | 1,141,264 (648.0%) |
| College / Associate Degree | 141,279 (79.9%) | 832,573 (471.0%) |
| Bachelor's Degree or higher | 554,822 (88.9%) | 1,341,338 (215.0%) |
| Total | 890,652 (84.2%) | 3,378,328 (319.3%) |
Employment Occupations by Sex in Area Code 617
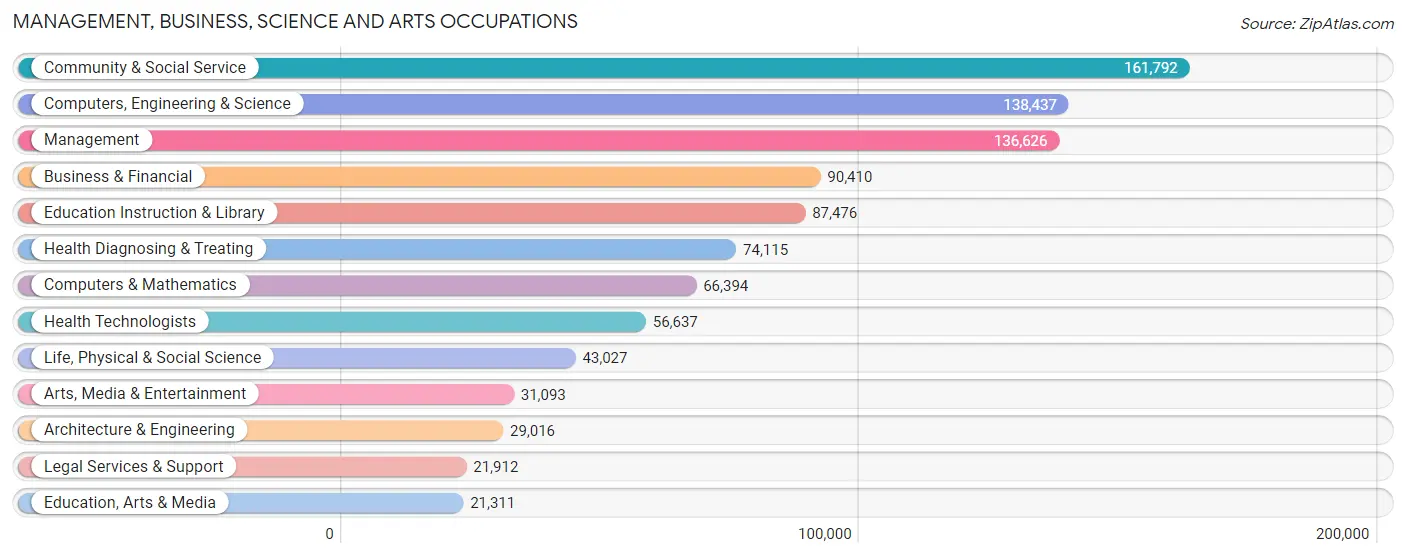
Management, Business, Science and Arts Occupations
The most common Management, Business, Science and Arts occupations in Area Code 617 are Community & Social Service (161,792 | 15.3%), Computers, Engineering & Science (138,437 | 13.1%), Management (136,626 | 12.9%), Business & Financial (90,410 | 8.6%), and Education Instruction & Library (87,476 | 8.3%).
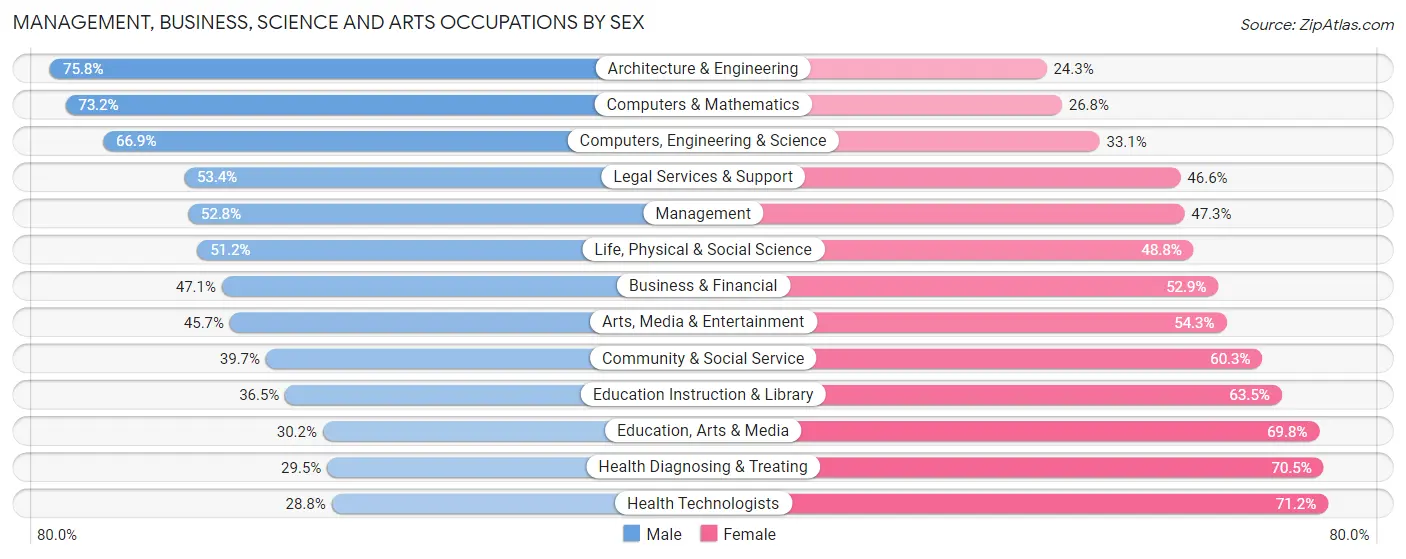
Management, Business, Science and Arts Occupations by Sex
Within the Management, Business, Science and Arts occupations in Area Code 617, the most male-oriented occupations are Architecture & Engineering (75.7%), Computers & Mathematics (73.2%), and Computers, Engineering & Science (66.9%), while the most female-oriented occupations are Health Technologists (71.2%), Health Diagnosing & Treating (70.5%), and Education, Arts & Media (69.8%).
| Occupation | Male | Female |
| Management | 72,068 (52.7%) | 64,558 (47.2%) |
| Business & Financial | 42,572 (47.1%) | 47,838 (52.9%) |
| Computers, Engineering & Science | 92,609 (66.9%) | 45,828 (33.1%) |
| Computers & Mathematics | 48,603 (73.2%) | 17,791 (26.8%) |
| Architecture & Engineering | 21,980 (75.7%) | 7,036 (24.2%) |
| Life, Physical & Social Science | 22,026 (51.2%) | 21,001 (48.8%) |
| Community & Social Service | 64,303 (39.7%) | 97,489 (60.3%) |
| Education, Arts & Media | 6,444 (30.2%) | 14,867 (69.8%) |
| Legal Services & Support | 11,701 (53.4%) | 10,211 (46.6%) |
| Education Instruction & Library | 31,935 (36.5%) | 55,541 (63.5%) |
| Arts, Media & Entertainment | 14,223 (45.7%) | 16,870 (54.3%) |
| Health Diagnosing & Treating | 21,868 (29.5%) | 52,247 (70.5%) |
| Health Technologists | 16,298 (28.8%) | 40,339 (71.2%) |
| Total (Category) | 293,420 (48.8%) | 307,960 (51.2%) |
| Total (Overall) | 535,310 (50.6%) | 521,487 (49.3%) |
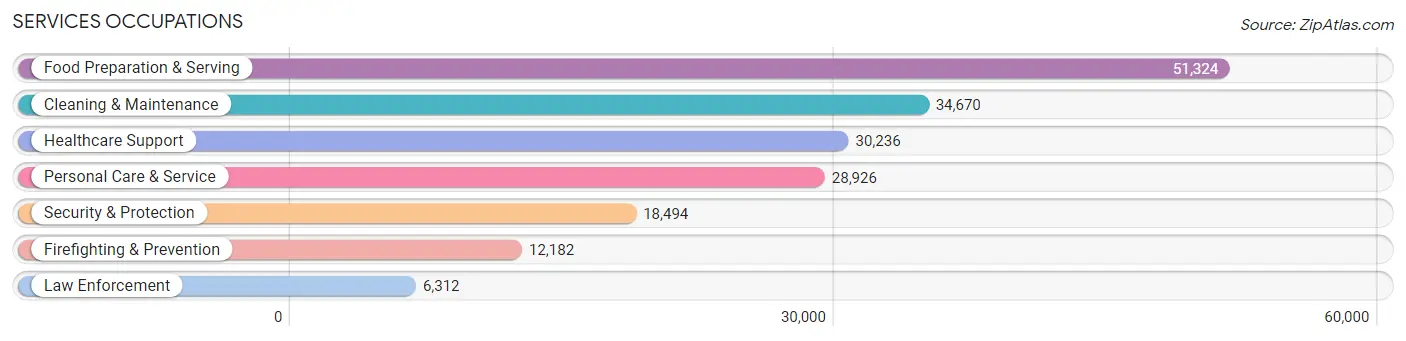
Services Occupations
The most common Services occupations in Area Code 617 are Food Preparation & Serving (51,324 | 4.9%), Cleaning & Maintenance (34,670 | 3.3%), Healthcare Support (30,236 | 2.9%), Personal Care & Service (28,926 | 2.7%), and Security & Protection (18,494 | 1.8%).
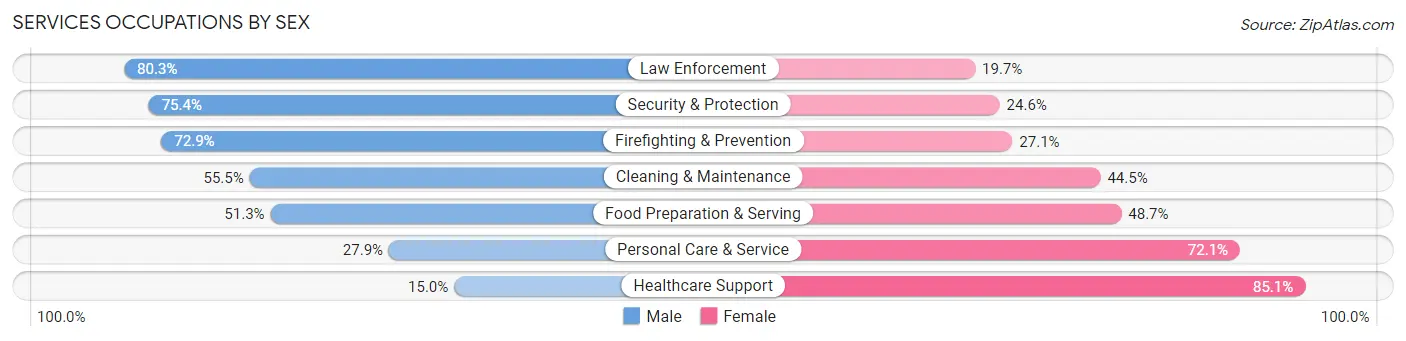
Services Occupations by Sex
Within the Services occupations in Area Code 617, the most male-oriented occupations are Law Enforcement (80.3%), Security & Protection (75.4%), and Firefighting & Prevention (72.9%), while the most female-oriented occupations are Healthcare Support (85.1%), Personal Care & Service (72.1%), and Food Preparation & Serving (48.7%).
| Occupation | Male | Female |
| Healthcare Support | 4,521 (14.9%) | 25,715 (85.1%) |
| Security & Protection | 13,949 (75.4%) | 4,545 (24.6%) |
| Firefighting & Prevention | 8,881 (72.9%) | 3,301 (27.1%) |
| Law Enforcement | 5,068 (80.3%) | 1,244 (19.7%) |
| Food Preparation & Serving | 26,347 (51.3%) | 24,977 (48.7%) |
| Cleaning & Maintenance | 19,228 (55.5%) | 15,442 (44.5%) |
| Personal Care & Service | 8,058 (27.9%) | 20,868 (72.1%) |
| Total (Category) | 72,103 (44.1%) | 91,547 (55.9%) |
| Total (Overall) | 535,310 (50.6%) | 521,487 (49.3%) |
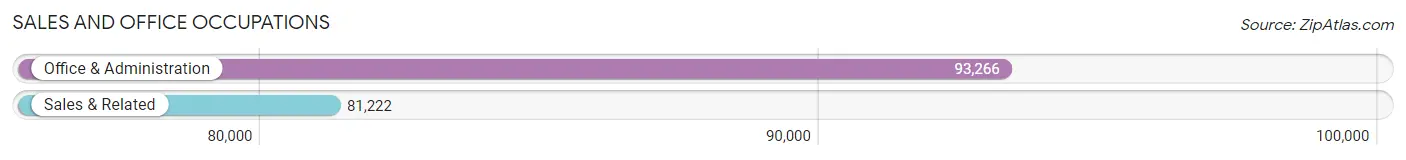
Sales and Office Occupations
The most common Sales and Office occupations in Area Code 617 are Office & Administration (93,266 | 8.8%), and Sales & Related (81,222 | 7.7%).
Sales and Office Occupations by Sex
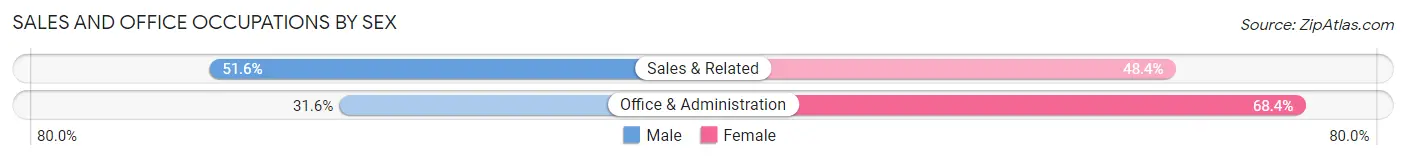
| Occupation | Male | Female |
| Sales & Related | 41,897 (51.6%) | 39,325 (48.4%) |
| Office & Administration | 29,491 (31.6%) | 63,775 (68.4%) |
| Total (Category) | 71,388 (40.9%) | 103,100 (59.1%) |
| Total (Overall) | 535,310 (50.6%) | 521,487 (49.3%) |
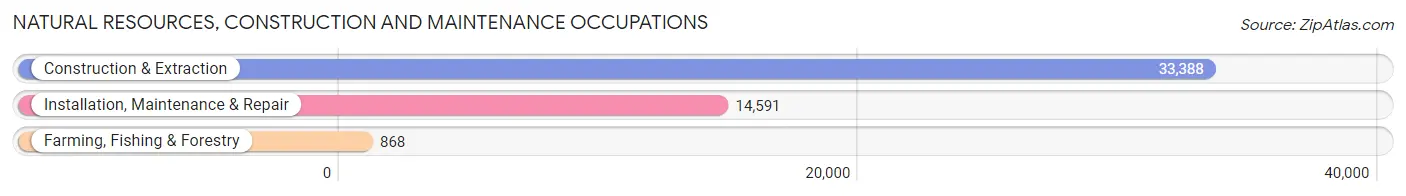
Natural Resources, Construction and Maintenance Occupations
The most common Natural Resources, Construction and Maintenance occupations in Area Code 617 are Construction & Extraction (33,388 | 3.2%), Installation, Maintenance & Repair (14,591 | 1.4%), and Farming, Fishing & Forestry (868 | 0.1%).
Natural Resources, Construction and Maintenance Occupations by Sex
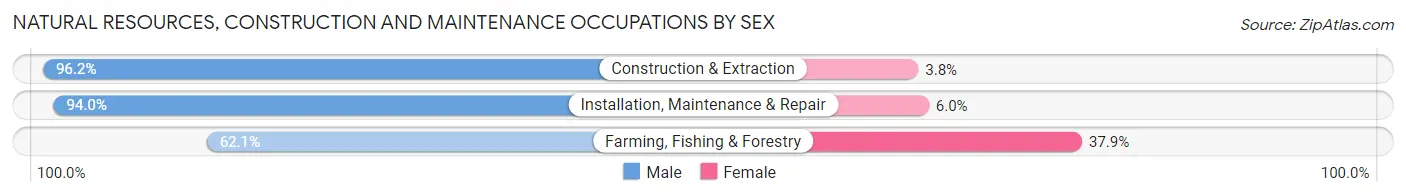
| Occupation | Male | Female |
| Farming, Fishing & Forestry | 539 (62.1%) | 329 (37.9%) |
| Construction & Extraction | 32,109 (96.2%) | 1,279 (3.8%) |
| Installation, Maintenance & Repair | 13,713 (94.0%) | 878 (6.0%) |
| Total (Category) | 46,361 (94.9%) | 2,486 (5.1%) |
| Total (Overall) | 535,310 (50.6%) | 521,487 (49.3%) |
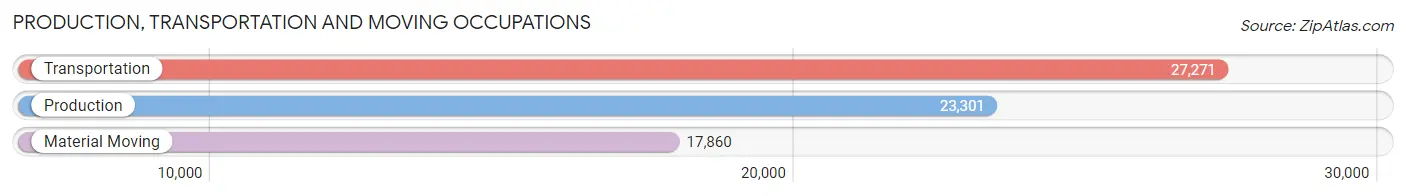
Production, Transportation and Moving Occupations
The most common Production, Transportation and Moving occupations in Area Code 617 are Transportation (27,271 | 2.6%), Production (23,301 | 2.2%), and Material Moving (17,860 | 1.7%).
Production, Transportation and Moving Occupations by Sex
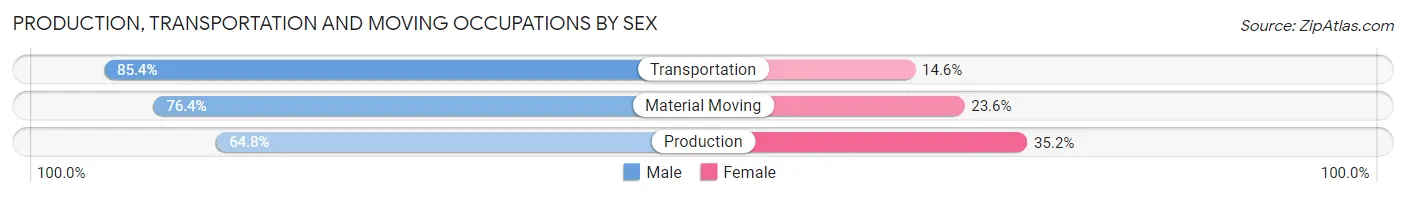
| Occupation | Male | Female |
| Production | 15,109 (64.8%) | 8,192 (35.2%) |
| Transportation | 23,290 (85.4%) | 3,981 (14.6%) |
| Material Moving | 13,639 (76.4%) | 4,221 (23.6%) |
| Total (Category) | 52,038 (76.0%) | 16,394 (24.0%) |
| Total (Overall) | 535,310 (50.6%) | 521,487 (49.3%) |
Employment Industries by Sex in Area Code 617
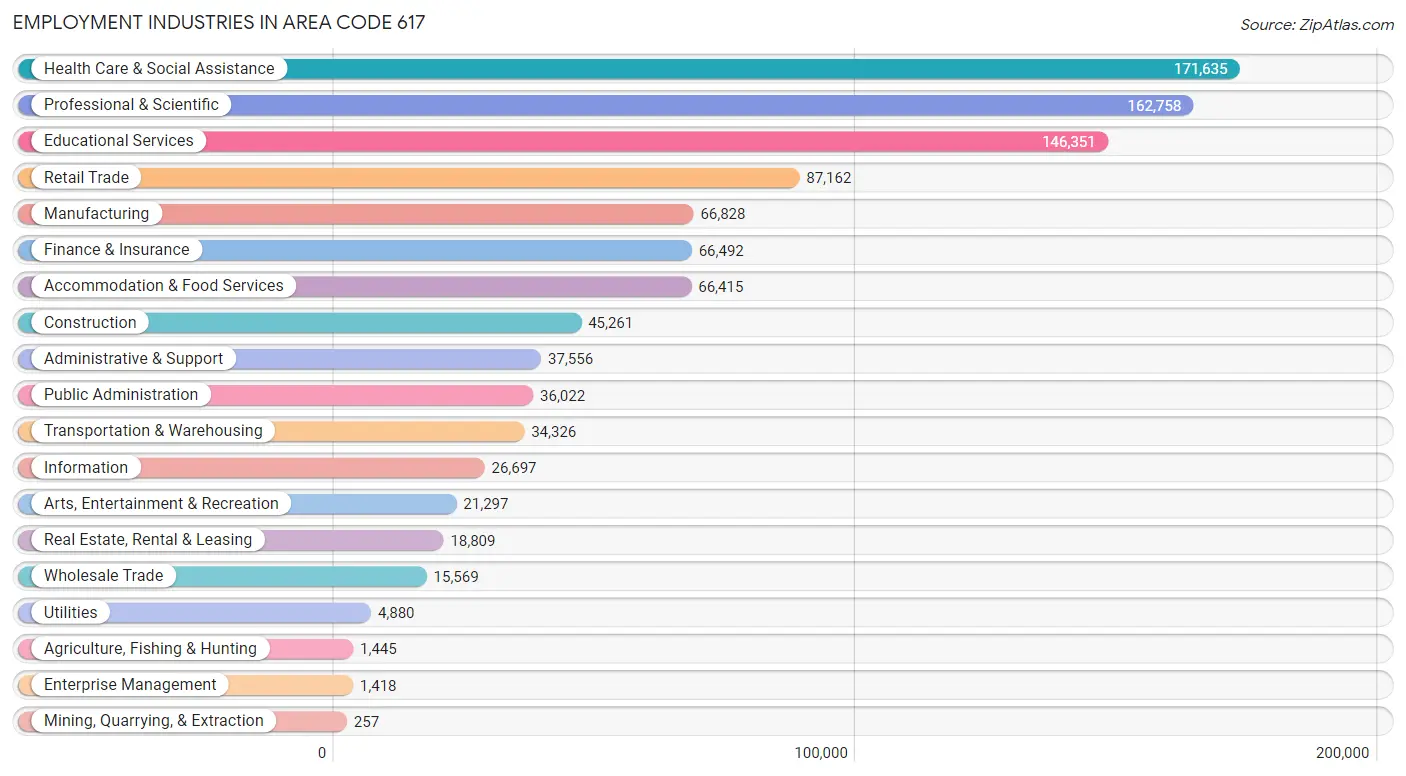
Employment Industries in Area Code 617
The major employment industries in Area Code 617 include Health Care & Social Assistance (171,635 | 16.2%), Professional & Scientific (162,758 | 15.4%), Educational Services (146,351 | 13.9%), Retail Trade (87,162 | 8.3%), and Manufacturing (66,828 | 6.3%).
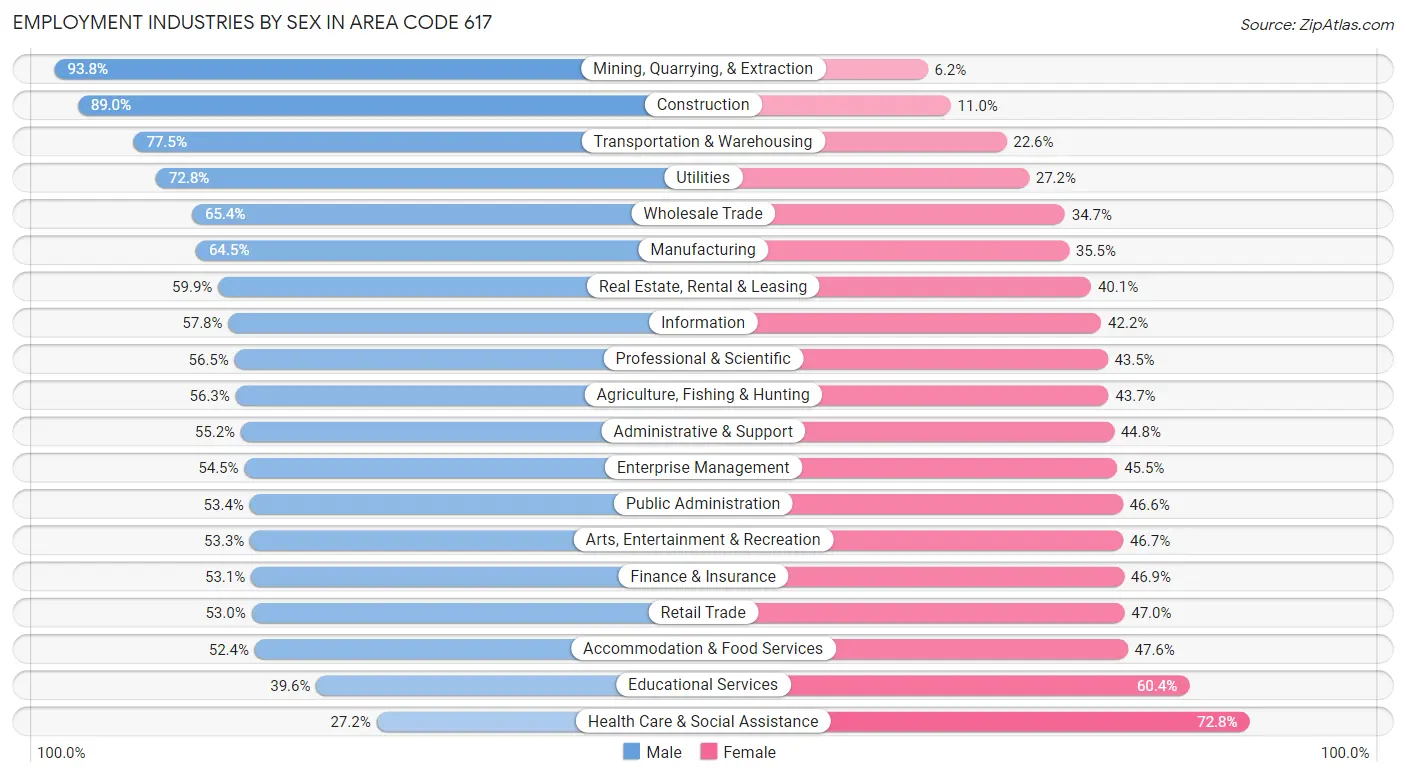
Employment Industries by Sex in Area Code 617
The Area Code 617 industries that see more men than women are Mining, Quarrying, & Extraction (93.8%), Construction (89.0%), and Transportation & Warehousing (77.4%), whereas the industries that tend to have a higher number of women are Health Care & Social Assistance (72.8%), Educational Services (60.4%), and Accommodation & Food Services (47.6%).
| Industry | Male | Female |
| Agriculture, Fishing & Hunting | 814 (56.3%) | 631 (43.7%) |
| Mining, Quarrying, & Extraction | 241 (93.8%) | 16 (6.2%) |
| Construction | 40,272 (89.0%) | 4,989 (11.0%) |
| Manufacturing | 43,117 (64.5%) | 23,711 (35.5%) |
| Wholesale Trade | 10,175 (65.3%) | 5,394 (34.6%) |
| Retail Trade | 46,233 (53.0%) | 40,929 (47.0%) |
| Transportation & Warehousing | 26,584 (77.4%) | 7,742 (22.6%) |
| Utilities | 3,553 (72.8%) | 1,327 (27.2%) |
| Information | 15,440 (57.8%) | 11,257 (42.2%) |
| Finance & Insurance | 35,326 (53.1%) | 31,166 (46.9%) |
| Real Estate, Rental & Leasing | 11,274 (59.9%) | 7,535 (40.1%) |
| Professional & Scientific | 92,004 (56.5%) | 70,754 (43.5%) |
| Enterprise Management | 773 (54.5%) | 645 (45.5%) |
| Administrative & Support | 20,742 (55.2%) | 16,814 (44.8%) |
| Educational Services | 57,990 (39.6%) | 88,361 (60.4%) |
| Health Care & Social Assistance | 46,628 (27.2%) | 125,007 (72.8%) |
| Arts, Entertainment & Recreation | 11,353 (53.3%) | 9,944 (46.7%) |
| Accommodation & Food Services | 34,772 (52.4%) | 31,643 (47.6%) |
| Public Administration | 19,243 (53.4%) | 16,779 (46.6%) |
| Total | 535,310 (50.6%) | 521,487 (49.3%) |
Education in Area Code 617
School Enrollment in Area Code 617
The most common levels of schooling among the 477,652 students in Area Code 617 are college / undergraduate (147,630 | 30.9%), high school (76,037 | 15.9%), and graduate / professional (72,916 | 15.3%).
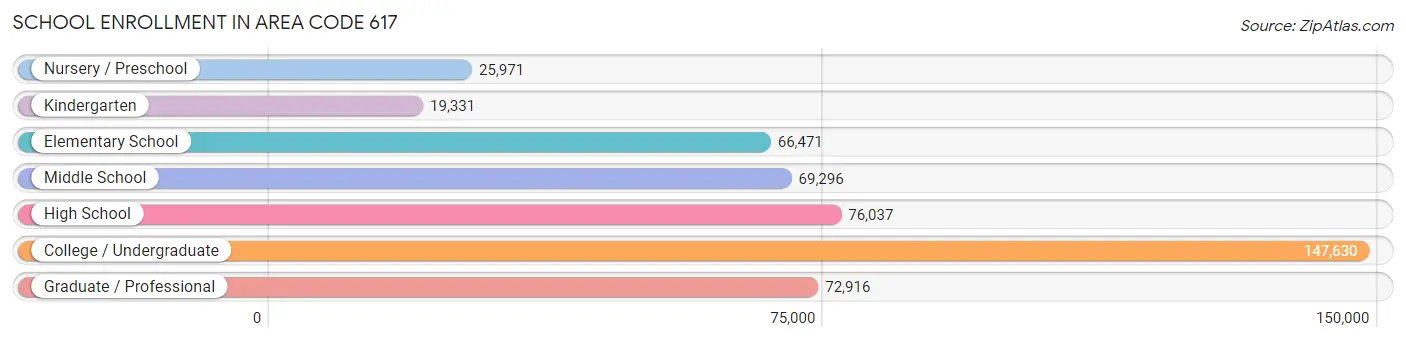
| School Level | # Students | % Students |
| Nursery / Preschool | 25,971 | 5.4% |
| Kindergarten | 19,331 | 4.1% |
| Elementary School | 66,471 | 13.9% |
| Middle School | 69,296 | 14.5% |
| High School | 76,037 | 15.9% |
| College / Undergraduate | 147,630 | 30.9% |
| Graduate / Professional | 72,916 | 15.3% |
| Total | 477,652 | 100.0% |
School Enrollment by Age by Funding Source in Area Code 617
Out of a total of 477,652 students who are enrolled in schools in Area Code 617, 204,075 (42.7%) attend a private institution, while the remaining 273,577 (57.3%) are enrolled in public schools. The age group of 20 to 24 year olds has the highest likelihood of being enrolled in private schools, with 66,605 (73.1% in the age bracket) enrolled. Conversely, the age group of 10 to 14 year olds has the lowest likelihood of being enrolled in a private school, with 75,597 (87.6% in the age bracket) attending a public institution.
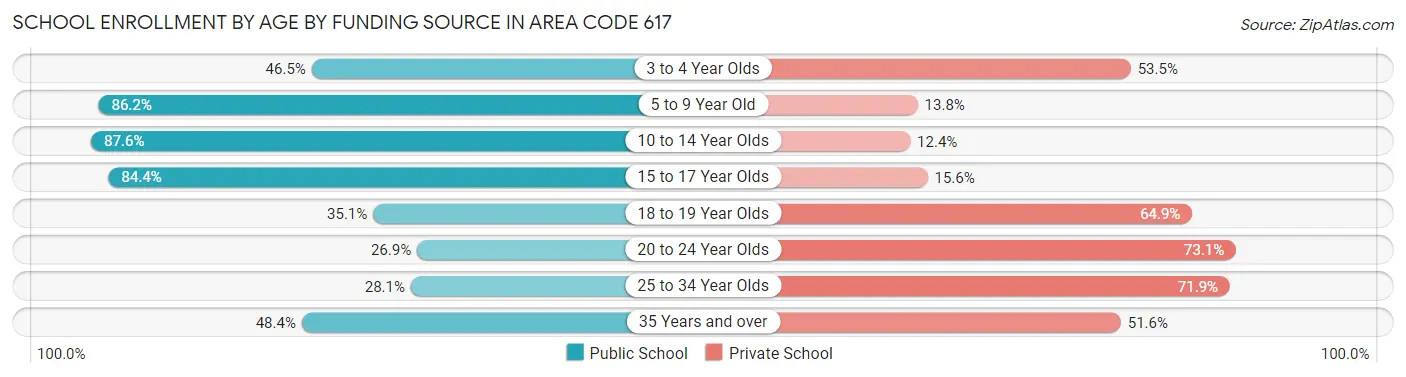
| Age Bracket | Public School | Private School |
| 3 to 4 Year Olds | 10,676 (46.5%) | 12,266 (53.5%) |
| 5 to 9 Year Old | 68,362 (86.2%) | 10,926 (13.8%) |
| 10 to 14 Year Olds | 75,597 (87.6%) | 10,679 (12.4%) |
| 15 to 17 Year Olds | 44,395 (84.4%) | 8,221 (15.6%) |
| 18 to 19 Year Olds | 21,082 (35.1%) | 38,997 (64.9%) |
| 20 to 24 Year Olds | 24,522 (26.9%) | 66,605 (73.1%) |
| 25 to 34 Year Olds | 17,031 (28.1%) | 43,667 (71.9%) |
| 35 Years and over | 11,915 (48.4%) | 12,711 (51.6%) |
| Total | 273,577 (57.3%) | 204,075 (42.7%) |
Educational Attainment by Field of Study in Area Code 617
Business (123,042 | 15.3%), social sciences (96,973 | 12.1%), engineering (71,525 | 8.9%), bio, nature & agricultural (67,357 | 8.4%), and science & technology (60,738 | 7.6%) are the most common fields of study among 802,534 individuals in Area Code 617 who have obtained a bachelor's degree or higher.
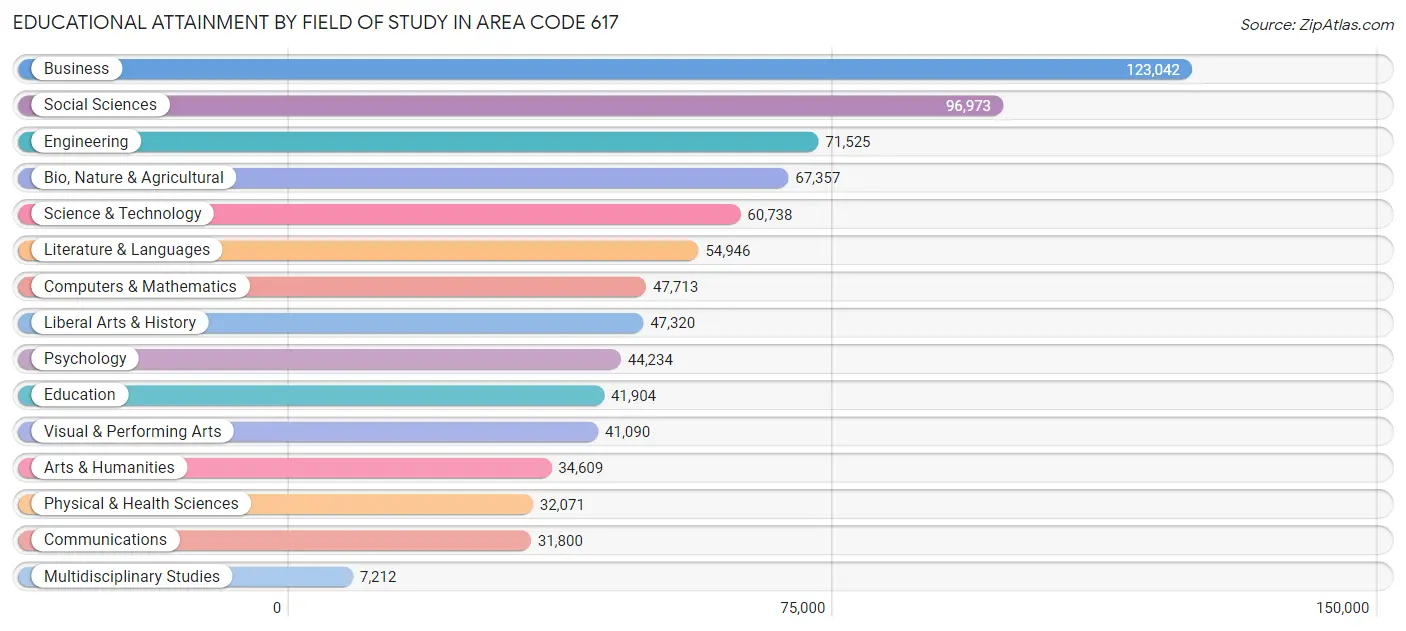
| Field of Study | # Graduates | % Graduates |
| Computers & Mathematics | 47,713 | 5.9% |
| Bio, Nature & Agricultural | 67,357 | 8.4% |
| Physical & Health Sciences | 32,071 | 4.0% |
| Psychology | 44,234 | 5.5% |
| Social Sciences | 96,973 | 12.1% |
| Engineering | 71,525 | 8.9% |
| Multidisciplinary Studies | 7,212 | 0.9% |
| Science & Technology | 60,738 | 7.6% |
| Business | 123,042 | 15.3% |
| Education | 41,904 | 5.2% |
| Literature & Languages | 54,946 | 6.9% |
| Liberal Arts & History | 47,320 | 5.9% |
| Visual & Performing Arts | 41,090 | 5.1% |
| Communications | 31,800 | 4.0% |
| Arts & Humanities | 34,609 | 4.3% |
| Total | 802,534 | 100.0% |
Transportation & Commute in Area Code 617
Vehicle Availability by Sex in Area Code 617
The most prevalent vehicle ownership categories in Area Code 617 are males with 1 vehicle (178,269, accounting for 34.6%) and females with 1 vehicle (180,825, making up 36.1%).
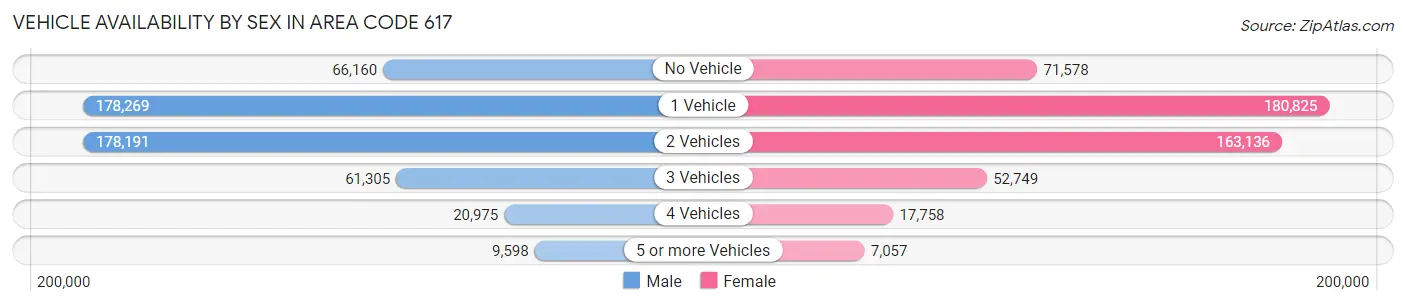
| Vehicles Available | Male | Female |
| No Vehicle | 66,160 (12.9%) | 71,578 (14.5%) |
| 1 Vehicle | 178,269 (34.6%) | 180,825 (36.7%) |
| 2 Vehicles | 178,191 (34.6%) | 163,136 (33.1%) |
| 3 Vehicles | 61,305 (11.9%) | 52,749 (10.7%) |
| 4 Vehicles | 20,975 (4.1%) | 17,758 (3.6%) |
| 5 or more Vehicles | 9,598 (1.9%) | 7,057 (1.4%) |
| Total | 514,498 (100.0%) | 493,103 (100.0%) |
Commute Time in Area Code 617
The most frequently occuring commute durations in Area Code 617 are 30 to 34 minutes (150,265 commuters, 17.6%), 20 to 24 minutes (110,779 commuters, 13.0%), and 45 to 59 minutes (106,910 commuters, 12.5%).
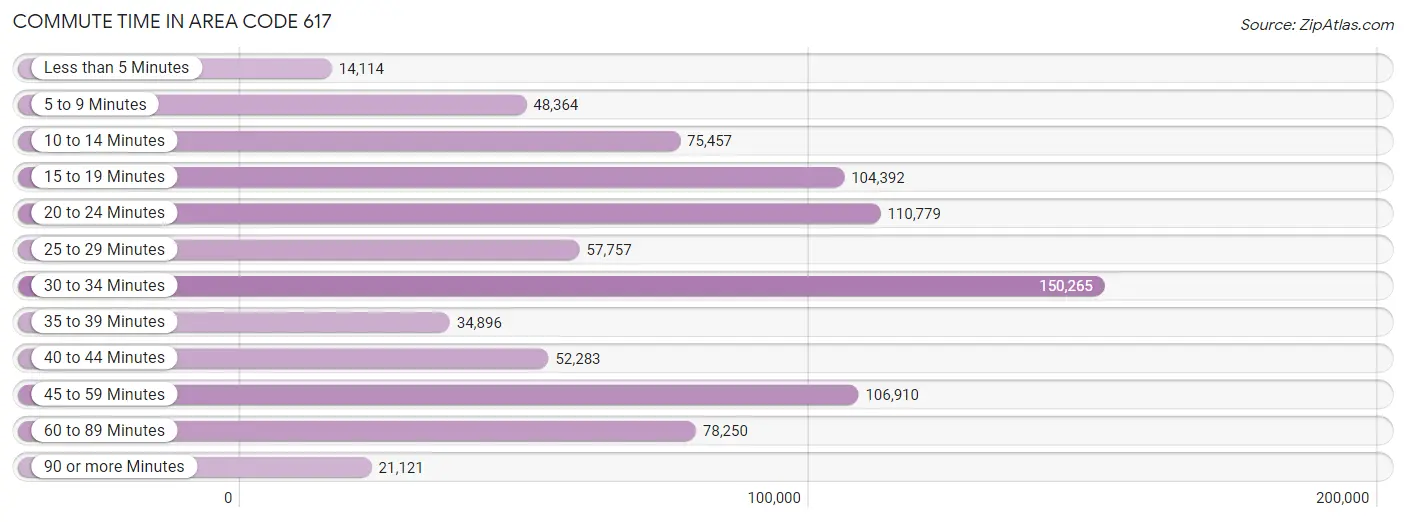
| Commute Time | # Commuters | % Commuters |
| Less than 5 Minutes | 14,114 | 1.7% |
| 5 to 9 Minutes | 48,364 | 5.7% |
| 10 to 14 Minutes | 75,457 | 8.8% |
| 15 to 19 Minutes | 104,392 | 12.2% |
| 20 to 24 Minutes | 110,779 | 13.0% |
| 25 to 29 Minutes | 57,757 | 6.8% |
| 30 to 34 Minutes | 150,265 | 17.6% |
| 35 to 39 Minutes | 34,896 | 4.1% |
| 40 to 44 Minutes | 52,283 | 6.1% |
| 45 to 59 Minutes | 106,910 | 12.5% |
| 60 to 89 Minutes | 78,250 | 9.2% |
| 90 or more Minutes | 21,121 | 2.5% |
Commute Time by Sex in Area Code 617
The most common commute times in Area Code 617 are 30 to 34 minutes (79,322 commuters, 18.2%) for males and 30 to 34 minutes (70,943 commuters, 17.0%) for females.
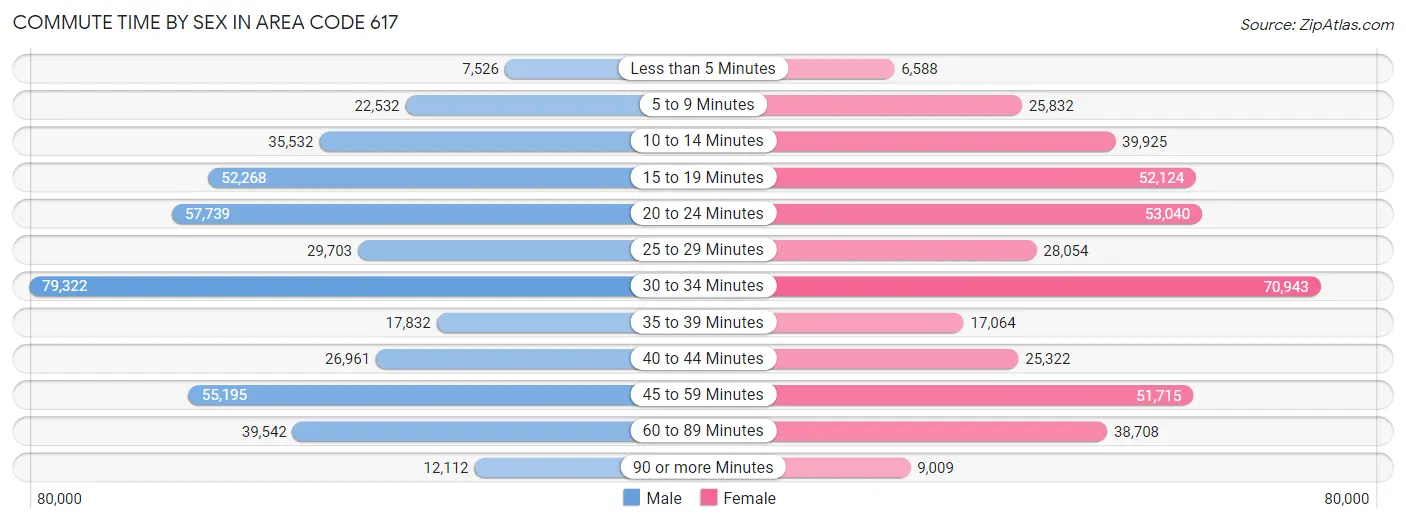
| Commute Time | Male | Female |
| Less than 5 Minutes | 7,526 (1.7%) | 6,588 (1.6%) |
| 5 to 9 Minutes | 22,532 (5.2%) | 25,832 (6.2%) |
| 10 to 14 Minutes | 35,532 (8.1%) | 39,925 (9.5%) |
| 15 to 19 Minutes | 52,268 (12.0%) | 52,124 (12.5%) |
| 20 to 24 Minutes | 57,739 (13.2%) | 53,040 (12.7%) |
| 25 to 29 Minutes | 29,703 (6.8%) | 28,054 (6.7%) |
| 30 to 34 Minutes | 79,322 (18.2%) | 70,943 (17.0%) |
| 35 to 39 Minutes | 17,832 (4.1%) | 17,064 (4.1%) |
| 40 to 44 Minutes | 26,961 (6.2%) | 25,322 (6.0%) |
| 45 to 59 Minutes | 55,195 (12.7%) | 51,715 (12.4%) |
| 60 to 89 Minutes | 39,542 (9.1%) | 38,708 (9.2%) |
| 90 or more Minutes | 12,112 (2.8%) | 9,009 (2.1%) |
Time of Departure to Work by Sex in Area Code 617
The most frequent times of departure to work in Area Code 617 are 8:00 AM to 8:29 AM (64,478, 14.8%) for males and 8:00 AM to 8:29 AM (68,609, 16.4%) for females.
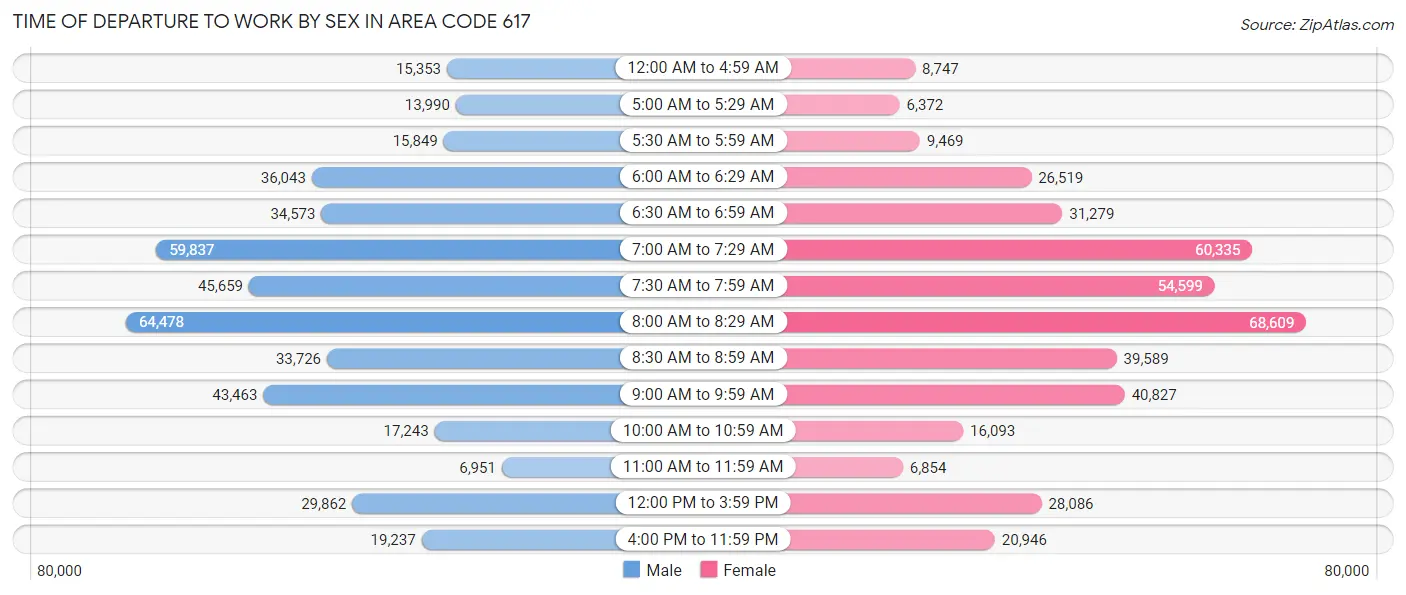
| Time of Departure | Male | Female |
| 12:00 AM to 4:59 AM | 15,353 (3.5%) | 8,747 (2.1%) |
| 5:00 AM to 5:29 AM | 13,990 (3.2%) | 6,372 (1.5%) |
| 5:30 AM to 5:59 AM | 15,849 (3.6%) | 9,469 (2.3%) |
| 6:00 AM to 6:29 AM | 36,043 (8.3%) | 26,519 (6.3%) |
| 6:30 AM to 6:59 AM | 34,573 (7.9%) | 31,279 (7.5%) |
| 7:00 AM to 7:29 AM | 59,837 (13.7%) | 60,335 (14.4%) |
| 7:30 AM to 7:59 AM | 45,659 (10.5%) | 54,599 (13.1%) |
| 8:00 AM to 8:29 AM | 64,478 (14.8%) | 68,609 (16.4%) |
| 8:30 AM to 8:59 AM | 33,726 (7.7%) | 39,589 (9.5%) |
| 9:00 AM to 9:59 AM | 43,463 (10.0%) | 40,827 (9.8%) |
| 10:00 AM to 10:59 AM | 17,243 (4.0%) | 16,093 (3.8%) |
| 11:00 AM to 11:59 AM | 6,951 (1.6%) | 6,854 (1.6%) |
| 12:00 PM to 3:59 PM | 29,862 (6.8%) | 28,086 (6.7%) |
| 4:00 PM to 11:59 PM | 19,237 (4.4%) | 20,946 (5.0%) |
| Total | 436,264 (100.0%) | 418,324 (100.0%) |
Housing Occupancy in Area Code 617
Occupancy by Ownership in Area Code 617
Of the total 756,293 dwellings in Area Code 617, owner-occupied units account for 349,009 (46.2%), while renter-occupied units make up 407,284 (53.8%).
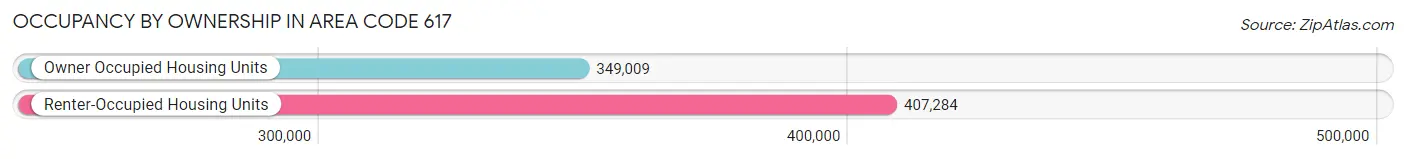
| Occupancy | # Housing Units | % Housing Units |
| Owner Occupied Housing Units | 349,009 | 46.2% |
| Renter-Occupied Housing Units | 407,284 | 53.8% |
| Total Occupied Housing Units | 756,293 | 100.0% |
Occupancy by Household Size in Area Code 617
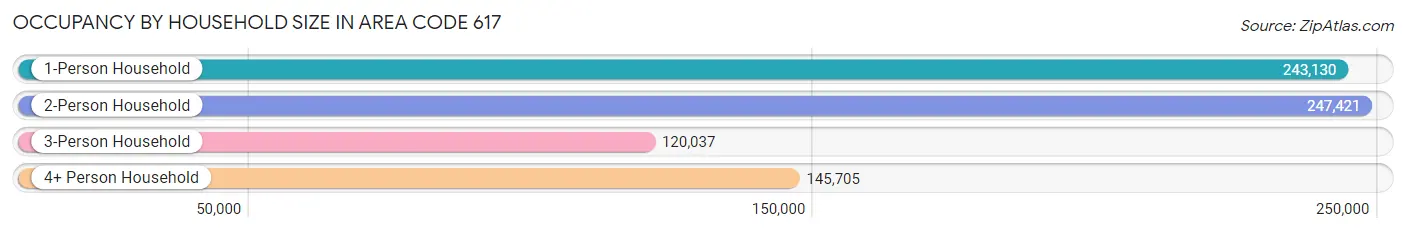
| Household Size | # Housing Units | % Housing Units |
| 1-Person Household | 243,130 | 32.2% |
| 2-Person Household | 247,421 | 32.7% |
| 3-Person Household | 120,037 | 15.9% |
| 4+ Person Household | 145,705 | 19.3% |
| Total Housing Units | 756,293 | 100.0% |
Occupancy by Ownership by Household Size in Area Code 617
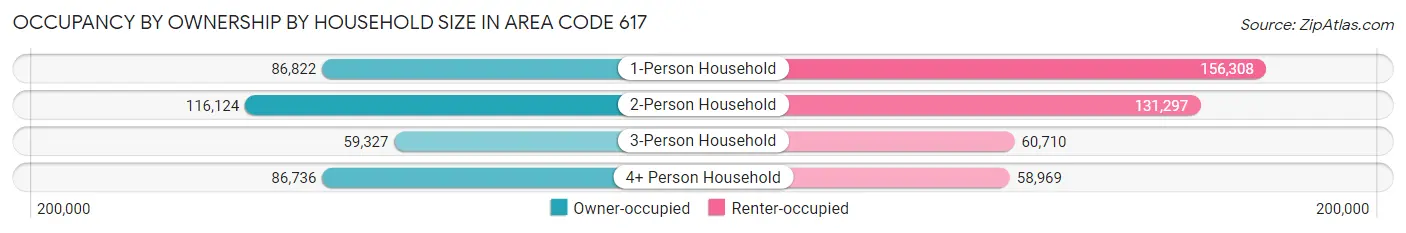
| Household Size | Owner-occupied | Renter-occupied |
| 1-Person Household | 86,822 (35.7%) | 156,308 (64.3%) |
| 2-Person Household | 116,124 (46.9%) | 131,297 (53.1%) |
| 3-Person Household | 59,327 (49.4%) | 60,710 (50.6%) |
| 4+ Person Household | 86,736 (59.5%) | 58,969 (40.5%) |
| Total Housing Units | 349,009 (46.2%) | 407,284 (53.8%) |
Occupancy by Educational Attainment in Area Code 617
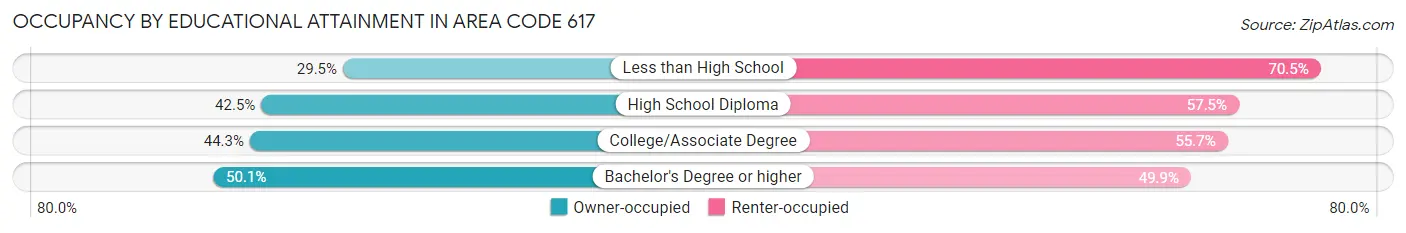
| Household Size | Owner-occupied | Renter-occupied |
| Less than High School | 18,158 (29.5%) | 43,344 (70.5%) |
| High School Diploma | 52,634 (42.5%) | 71,260 (57.5%) |
| College/Associate Degree | 59,317 (44.3%) | 74,641 (55.7%) |
| Bachelor's Degree or higher | 218,900 (50.1%) | 218,039 (49.9%) |
Occupancy by Age of Householder in Area Code 617
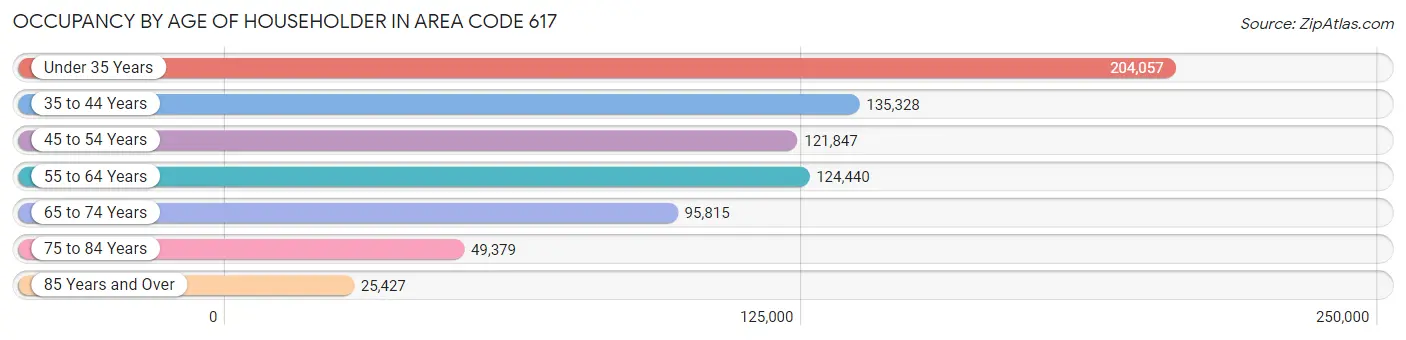
| Age Bracket | # Households | % Households |
| Under 35 Years | 204,057 | 27.0% |
| 35 to 44 Years | 135,328 | 17.9% |
| 45 to 54 Years | 121,847 | 16.1% |
| 55 to 64 Years | 124,440 | 16.5% |
| 65 to 74 Years | 95,815 | 12.7% |
| 75 to 84 Years | 49,379 | 6.5% |
| 85 Years and Over | 25,427 | 3.4% |
| Total | 756,293 | 100.0% |
Housing Finances in Area Code 617
Median Income by Occupancy in Area Code 617
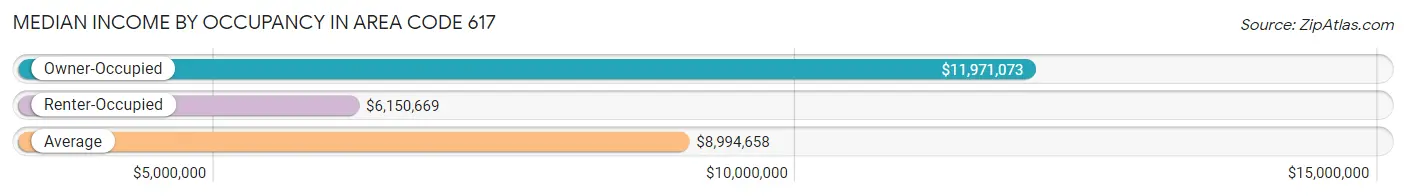
| Occupancy Type | # Households | Median Income |
| Owner-Occupied | 349,009 (46.2%) | $11,971,073 |
| Renter-Occupied | 407,284 (53.8%) | $6,150,669 |
| Average | 756,293 (100.0%) | $8,994,658 |
Occupancy by Householder Income Bracket in Area Code 617
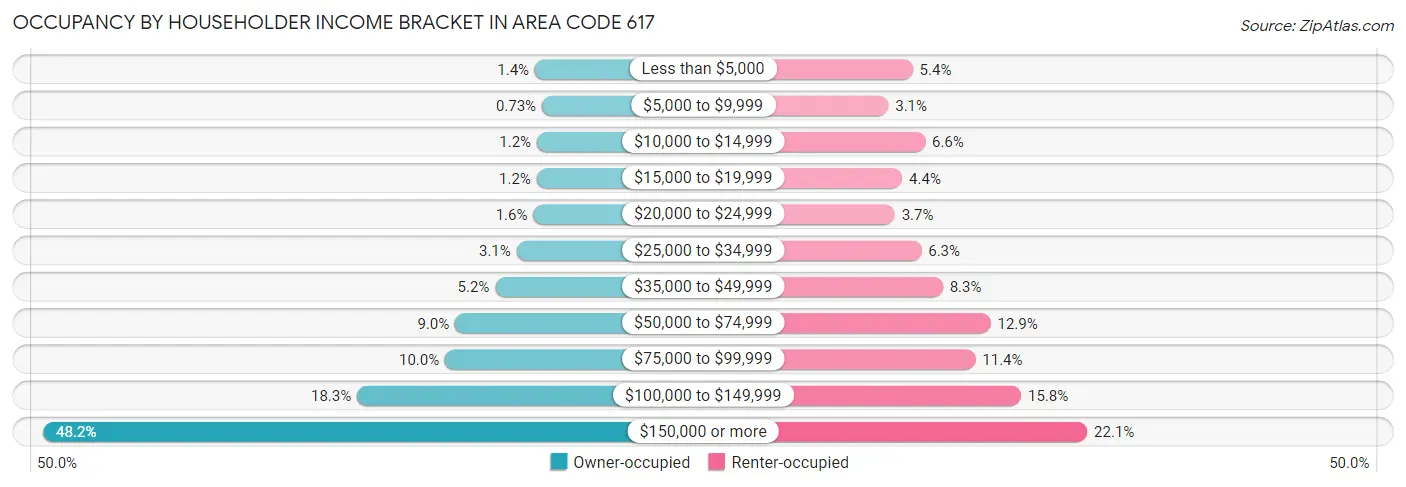
| Income Bracket | Owner-occupied | Renter-occupied |
| Less than $5,000 | 4,887 (1.4%) | 22,141 (5.4%) |
| $5,000 to $9,999 | 2,557 (0.7%) | 12,703 (3.1%) |
| $10,000 to $14,999 | 4,230 (1.2%) | 26,952 (6.6%) |
| $15,000 to $19,999 | 4,276 (1.2%) | 18,089 (4.4%) |
| $20,000 to $24,999 | 5,402 (1.5%) | 15,184 (3.7%) |
| $25,000 to $34,999 | 10,975 (3.1%) | 25,505 (6.3%) |
| $35,000 to $49,999 | 18,095 (5.2%) | 33,804 (8.3%) |
| $50,000 to $74,999 | 31,428 (9.0%) | 52,392 (12.9%) |
| $75,000 to $99,999 | 34,774 (10.0%) | 46,472 (11.4%) |
| $100,000 to $149,999 | 64,019 (18.3%) | 64,175 (15.8%) |
| $150,000 or more | 168,366 (48.2%) | 89,867 (22.1%) |
| Total | 349,009 (100.0%) | 407,284 (100.0%) |
Monthly Housing Cost Tiers in Area Code 617
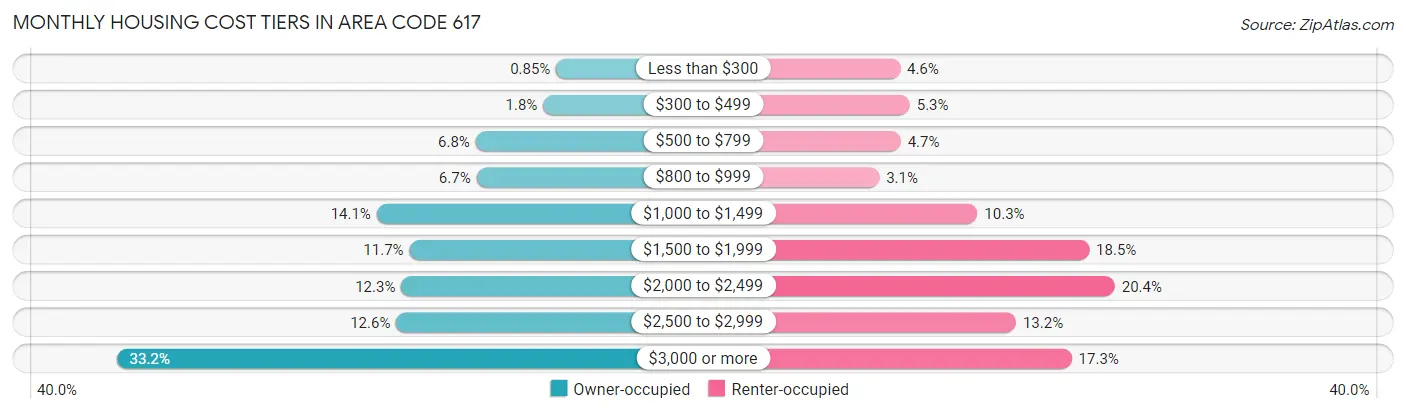
| Monthly Cost | Owner-occupied | Renter-occupied |
| Less than $300 | 2,972 (0.9%) | 18,759 (4.6%) |
| $300 to $499 | 6,308 (1.8%) | 21,696 (5.3%) |
| $500 to $799 | 23,665 (6.8%) | 18,978 (4.7%) |
| $800 to $999 | 23,469 (6.7%) | 12,537 (3.1%) |
| $1,000 to $1,499 | 49,117 (14.1%) | 41,981 (10.3%) |
| $1,500 to $1,999 | 40,694 (11.7%) | 75,513 (18.5%) |
| $2,000 to $2,499 | 42,778 (12.3%) | 83,223 (20.4%) |
| $2,500 to $2,999 | 44,081 (12.6%) | 53,578 (13.2%) |
| $3,000 or more | 115,925 (33.2%) | 70,274 (17.2%) |
| Total | 349,009 (100.0%) | 407,284 (100.0%) |
Physical Housing Characteristics in Area Code 617
Housing Structures in Area Code 617
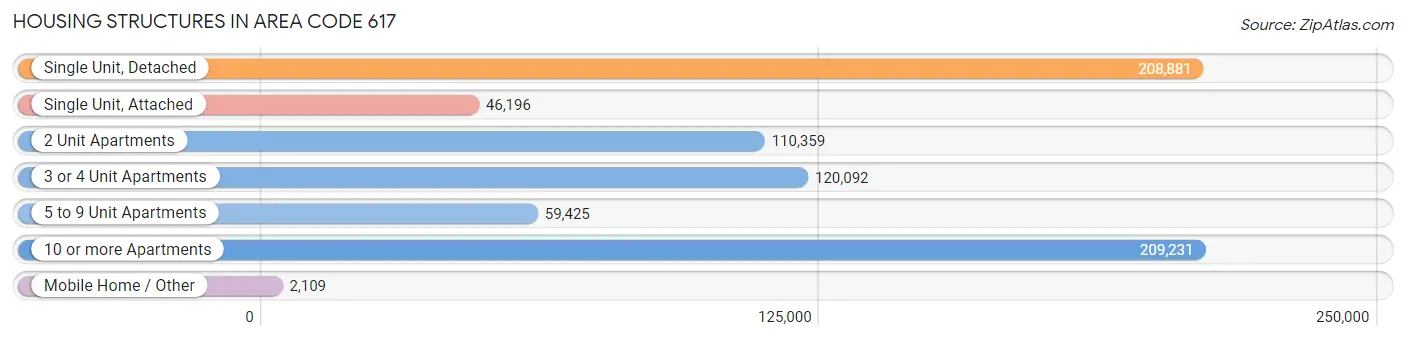
| Structure Type | # Housing Units | % Housing Units |
| Single Unit, Detached | 208,881 | 27.6% |
| Single Unit, Attached | 46,196 | 6.1% |
| 2 Unit Apartments | 110,359 | 14.6% |
| 3 or 4 Unit Apartments | 120,092 | 15.9% |
| 5 to 9 Unit Apartments | 59,425 | 7.9% |
| 10 or more Apartments | 209,231 | 27.7% |
| Mobile Home / Other | 2,109 | 0.3% |
| Total | 756,293 | 100.0% |
Housing Structures by Occupancy in Area Code 617
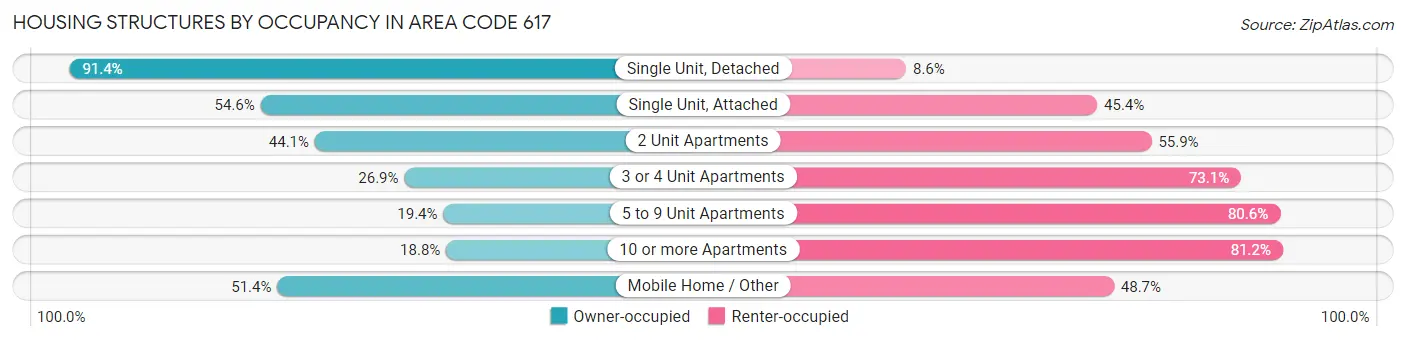
| Structure Type | Owner-occupied | Renter-occupied |
| Single Unit, Detached | 190,841 (91.4%) | 18,040 (8.6%) |
| Single Unit, Attached | 25,211 (54.6%) | 20,985 (45.4%) |
| 2 Unit Apartments | 48,683 (44.1%) | 61,676 (55.9%) |
| 3 or 4 Unit Apartments | 32,282 (26.9%) | 87,810 (73.1%) |
| 5 to 9 Unit Apartments | 11,509 (19.4%) | 47,916 (80.6%) |
| 10 or more Apartments | 39,400 (18.8%) | 169,831 (81.2%) |
| Mobile Home / Other | 1,083 (51.3%) | 1,026 (48.6%) |
| Total | 349,009 (46.2%) | 407,284 (53.8%) |
Housing Structures by Number of Rooms in Area Code 617
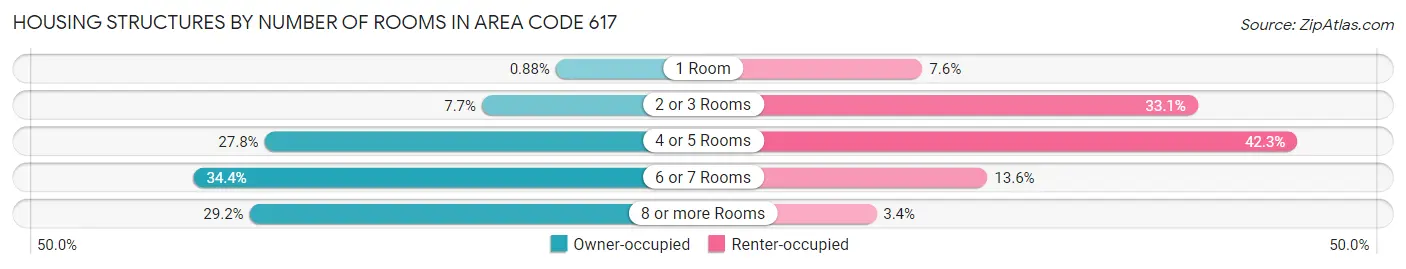
| Number of Rooms | Owner-occupied | Renter-occupied |
| 1 Room | 3,065 (0.9%) | 31,066 (7.6%) |
| 2 or 3 Rooms | 26,904 (7.7%) | 134,712 (33.1%) |
| 4 or 5 Rooms | 97,103 (27.8%) | 172,255 (42.3%) |
| 6 or 7 Rooms | 119,985 (34.4%) | 55,559 (13.6%) |
| 8 or more Rooms | 101,952 (29.2%) | 13,692 (3.4%) |
| Total | 349,009 (100.0%) | 407,284 (100.0%) |
Housing Structure by Heating Type in Area Code 617
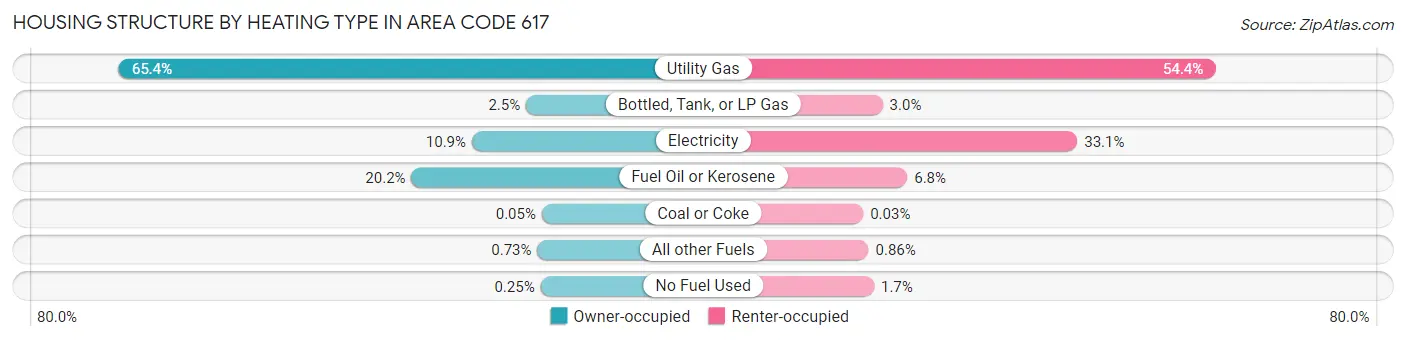
| Heating Type | Owner-occupied | Renter-occupied |
| Utility Gas | 228,356 (65.4%) | 221,638 (54.4%) |
| Bottled, Tank, or LP Gas | 8,645 (2.5%) | 12,325 (3.0%) |
| Electricity | 37,914 (10.9%) | 134,910 (33.1%) |
| Fuel Oil or Kerosene | 70,486 (20.2%) | 27,868 (6.8%) |
| Coal or Coke | 177 (0.1%) | 128 (0.0%) |
| All other Fuels | 2,564 (0.7%) | 3,496 (0.9%) |
| No Fuel Used | 867 (0.3%) | 6,919 (1.7%) |
| Total | 349,009 (100.0%) | 407,284 (100.0%) |
Household Vehicle Usage in Area Code 617
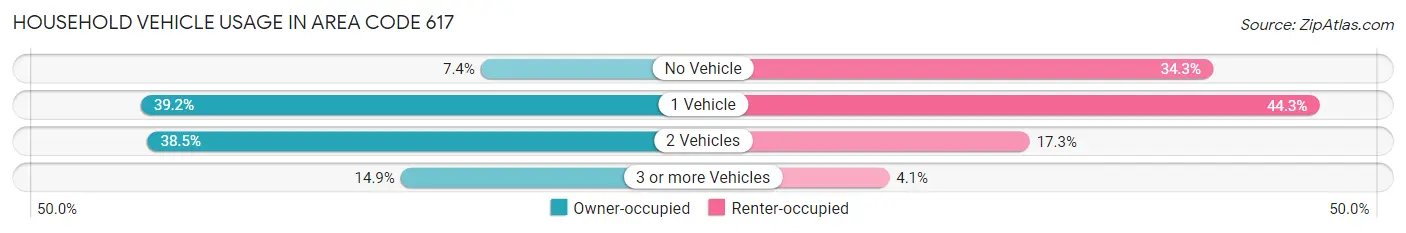
| Vehicles per Household | Owner-occupied | Renter-occupied |
| No Vehicle | 25,927 (7.4%) | 139,850 (34.3%) |
| 1 Vehicle | 136,641 (39.2%) | 180,299 (44.3%) |
| 2 Vehicles | 134,446 (38.5%) | 70,261 (17.2%) |
| 3 or more Vehicles | 51,995 (14.9%) | 16,874 (4.1%) |
| Total | 349,009 (100.0%) | 407,284 (100.0%) |
Real Estate & Mortgages in Area Code 617
Real Estate and Mortgage Overview in Area Code 617
| Characteristic | Without Mortgage | With Mortgage |
| Housing Units | 114,384 | 234,625 |
| Median Property Value | $60,946,701 | $61,750,900 |
| Median Household Income | $8,637,231 | $129,441 |
| Monthly Housing Costs | $84,564 | $111,927 |
| Real Estate Taxes | $481,267 | $3,363 |
Property Value by Mortgage Status in Area Code 617
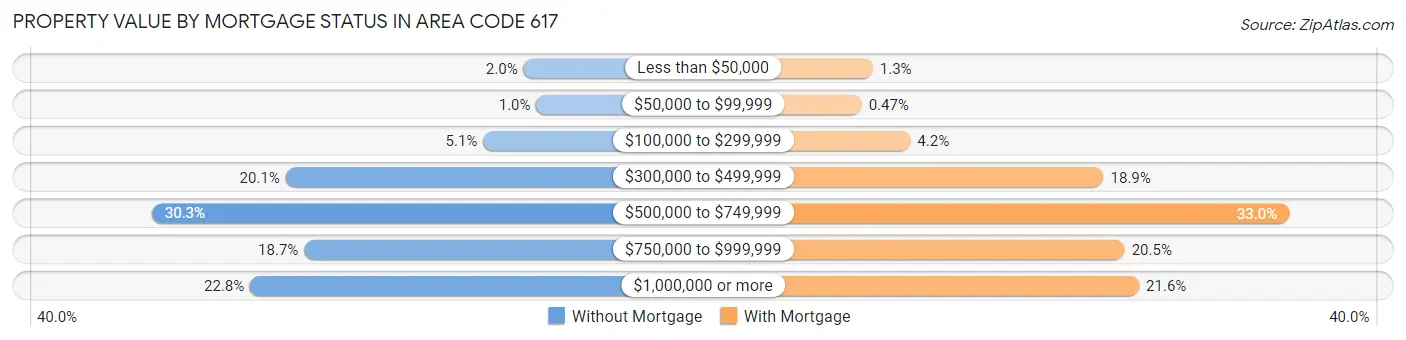
| Property Value | Without Mortgage | With Mortgage |
| Less than $50,000 | 2,279 (2.0%) | 3,092 (1.3%) |
| $50,000 to $99,999 | 1,160 (1.0%) | 1,111 (0.5%) |
| $100,000 to $299,999 | 5,783 (5.1%) | 9,798 (4.2%) |
| $300,000 to $499,999 | 23,006 (20.1%) | 44,343 (18.9%) |
| $500,000 to $749,999 | 34,662 (30.3%) | 77,462 (33.0%) |
| $750,000 to $999,999 | 21,394 (18.7%) | 48,125 (20.5%) |
| $1,000,000 or more | 26,100 (22.8%) | 50,694 (21.6%) |
| Total | 114,384 (100.0%) | 234,625 (100.0%) |
Household Income by Mortgage Status in Area Code 617

| Household Income | Without Mortgage | With Mortgage |
| Less than $10,000 | 4,014 (3.5%) | 5,354 (2.3%) |
| $10,000 to $24,999 | 8,490 (7.4%) | 3,430 (1.5%) |
| $25,000 to $34,999 | 6,062 (5.3%) | 5,418 (2.3%) |
| $35,000 to $49,999 | 10,071 (8.8%) | 4,913 (2.1%) |
| $50,000 to $74,999 | 14,269 (12.5%) | 8,024 (3.4%) |
| $75,000 to $99,999 | 13,272 (11.6%) | 17,159 (7.3%) |
| $100,000 to $149,999 | 19,281 (16.9%) | 21,502 (9.2%) |
| $150,000 or more | 38,925 (34.0%) | 44,738 (19.1%) |
| Total | 114,384 (100.0%) | 234,625 (100.0%) |
Property Value to Household Income Ratio in Area Code 617
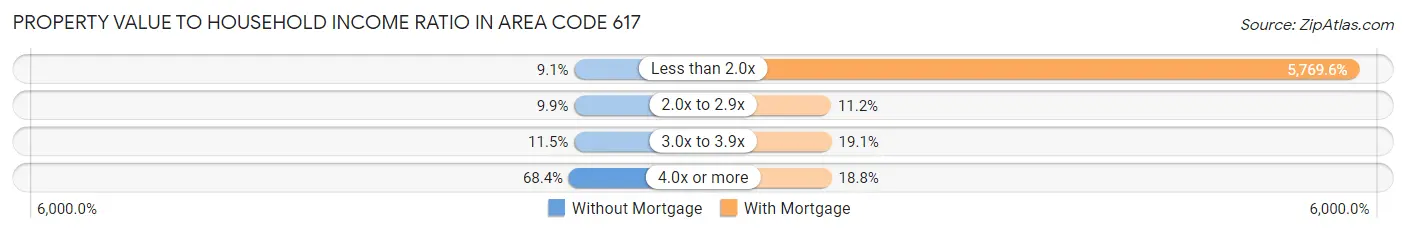
| Value-to-Income Ratio | Without Mortgage | With Mortgage |
| Less than 2.0x | 10,398 (9.1%) | 13,536,870 (5,769.6%) |
| 2.0x to 2.9x | 11,352 (9.9%) | 26,150 (11.2%) |
| 3.0x to 3.9x | 13,184 (11.5%) | 44,867 (19.1%) |
| 4.0x or more | 78,260 (68.4%) | 44,078 (18.8%) |
| Total | 114,384 (100.0%) | 234,625 (100.0%) |
Real Estate Taxes by Mortgage Status in Area Code 617
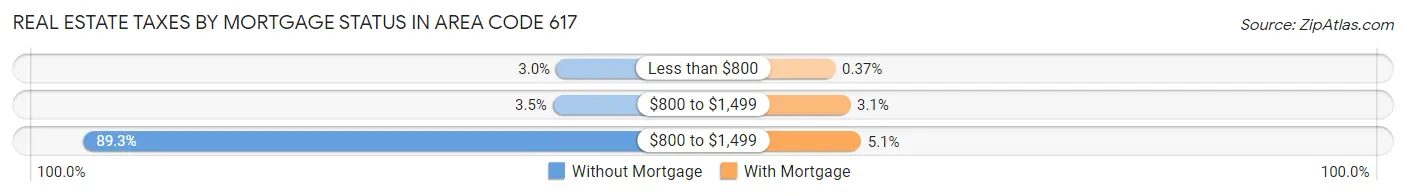
| Property Taxes | Without Mortgage | With Mortgage |
| Less than $800 | 3,391 (3.0%) | 878 (0.4%) |
| $800 to $1,499 | 4,049 (3.5%) | 7,270 (3.1%) |
| $800 to $1,499 | 102,108 (89.3%) | 11,894 (5.1%) |
| Total | 114,384 (100.0%) | 234,625 (100.0%) |
Health & Disability in Area Code 617
Health Insurance Coverage by Age in Area Code 617
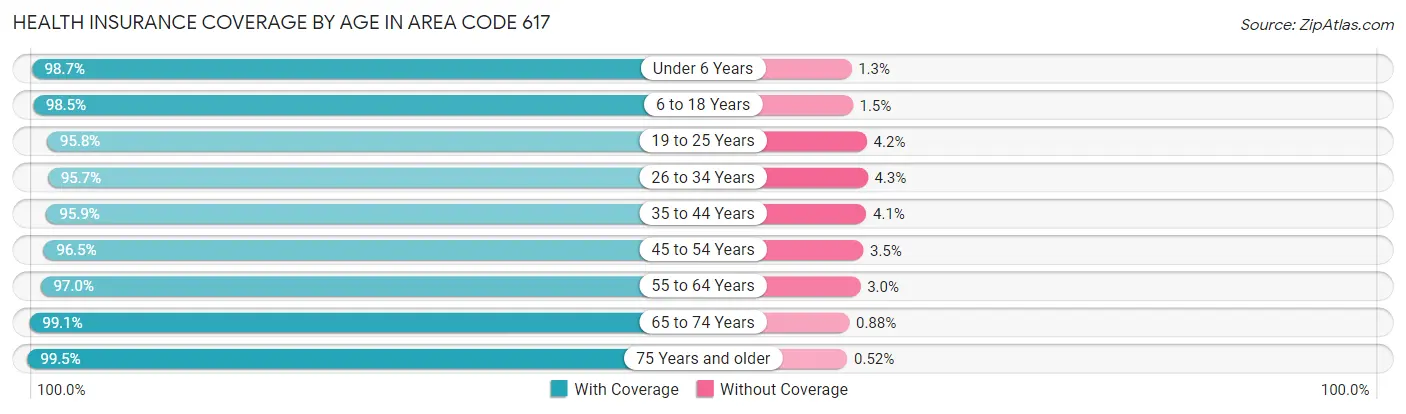
| Age Bracket | With Coverage | Without Coverage |
| Under 6 Years | 107,972 (98.7%) | 1,411 (1.3%) |
| 6 to 18 Years | 237,746 (98.5%) | 3,700 (1.5%) |
| 19 to 25 Years | 227,370 (95.8%) | 9,901 (4.2%) |
| 26 to 34 Years | 318,800 (95.7%) | 14,410 (4.3%) |
| 35 to 44 Years | 243,445 (95.9%) | 10,327 (4.1%) |
| 45 to 54 Years | 207,908 (96.5%) | 7,510 (3.5%) |
| 55 to 64 Years | 204,697 (97.0%) | 6,257 (3.0%) |
| 65 to 74 Years | 151,680 (99.1%) | 1,340 (0.9%) |
| 75 Years and older | 109,104 (99.5%) | 571 (0.5%) |
| Total | 1,808,722 (97.0%) | 55,427 (3.0%) |
Health Insurance Coverage by Citizenship Status in Area Code 617
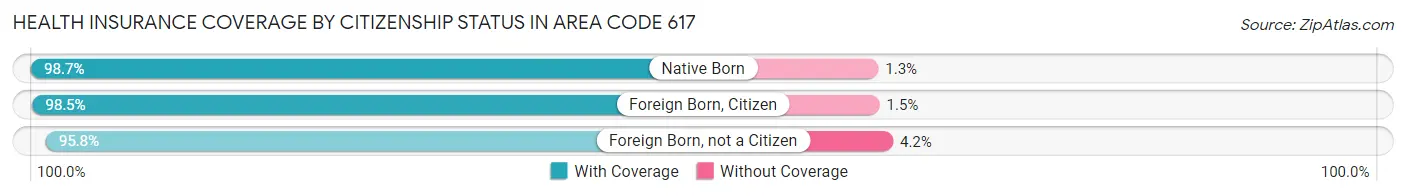
| Citizenship Status | With Coverage | Without Coverage |
| Native Born | 107,972 (98.7%) | 1,411 (1.3%) |
| Foreign Born, Citizen | 237,746 (98.5%) | 3,700 (1.5%) |
| Foreign Born, not a Citizen | 227,370 (95.8%) | 9,901 (4.2%) |
Health Insurance Coverage by Household Income in Area Code 617
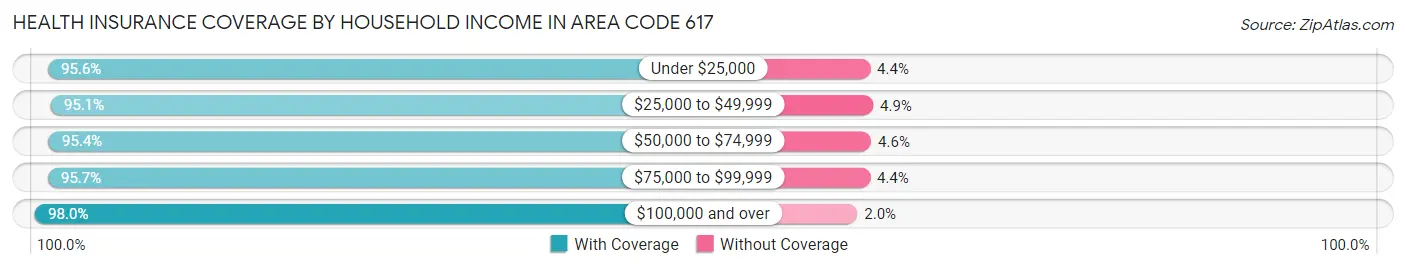
| Household Income | With Coverage | Without Coverage |
| Under $25,000 | 176,802 (95.6%) | 8,093 (4.4%) |
| $25,000 to $49,999 | 170,022 (95.1%) | 8,818 (4.9%) |
| $50,000 to $74,999 | 167,553 (95.4%) | 8,008 (4.6%) |
| $75,000 to $99,999 | 172,725 (95.7%) | 7,855 (4.3%) |
| $100,000 and over | 1,047,474 (98.0%) | 21,052 (2.0%) |
Public vs Private Health Insurance Coverage by Age in Area Code 617
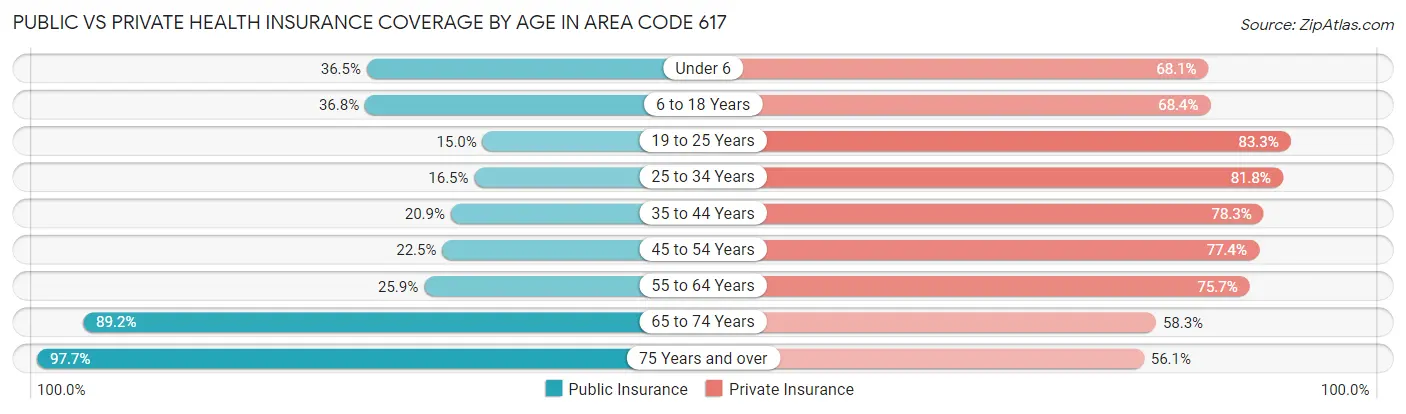
| Age Bracket | Public Insurance | Private Insurance |
| Under 6 | 39,908 (36.5%) | 74,432 (68.0%) |
| 6 to 18 Years | 88,905 (36.8%) | 165,133 (68.4%) |
| 19 to 25 Years | 35,575 (15.0%) | 197,633 (83.3%) |
| 25 to 34 Years | 55,034 (16.5%) | 272,657 (81.8%) |
| 35 to 44 Years | 53,020 (20.9%) | 198,667 (78.3%) |
| 45 to 54 Years | 48,415 (22.5%) | 166,722 (77.4%) |
| 55 to 64 Years | 54,524 (25.9%) | 159,655 (75.7%) |
| 65 to 74 Years | 136,410 (89.1%) | 89,231 (58.3%) |
| 75 Years and over | 107,139 (97.7%) | 61,469 (56.0%) |
| Total | 618,930 (33.2%) | 1,385,599 (74.3%) |
Disability Status by Sex by Age in Area Code 617
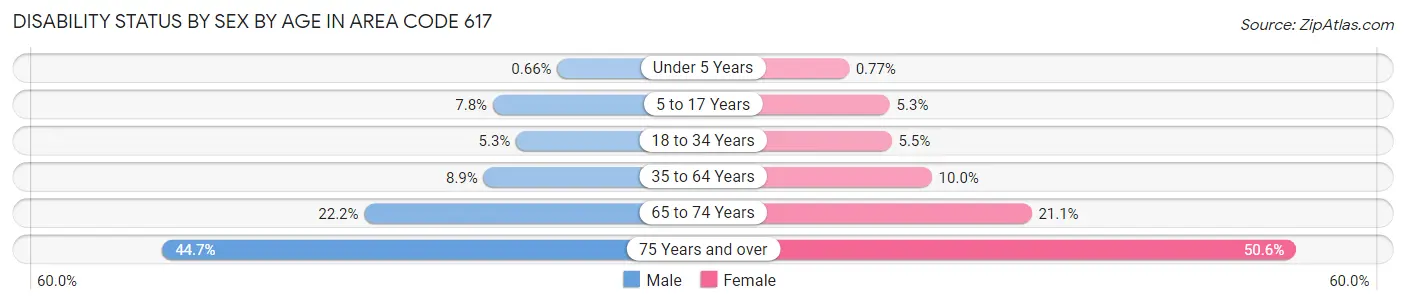
| Age Bracket | Male | Female |
| Under 5 Years | 314 (0.7%) | 350 (0.8%) |
| 5 to 17 Years | 8,961 (7.8%) | 5,955 (5.3%) |
| 18 to 34 Years | 15,703 (5.2%) | 16,802 (5.5%) |
| 35 to 64 Years | 29,960 (8.9%) | 34,305 (10.0%) |
| 65 to 74 Years | 15,406 (22.2%) | 17,632 (21.1%) |
| 75 Years and over | 19,033 (44.7%) | 33,925 (50.6%) |
Disability Class by Sex by Age in Area Code 617
Disability Class: Hearing Difficulty
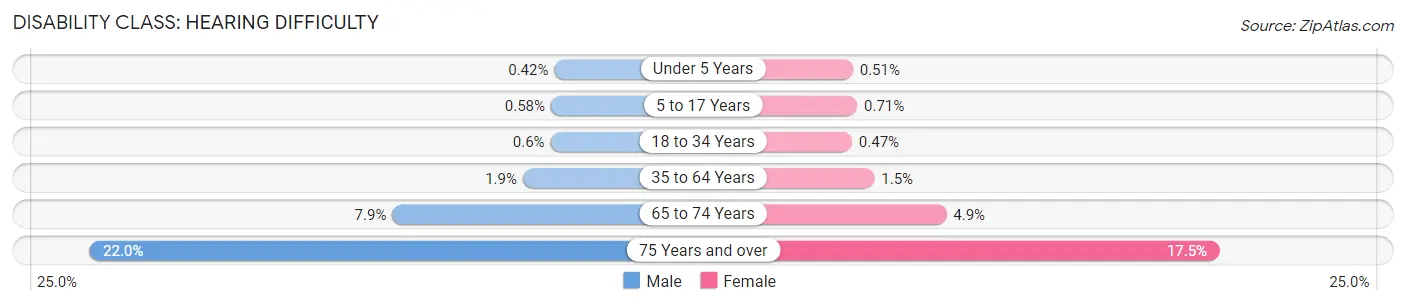
| Age Bracket | Male | Female |
| Under 5 Years | 199 (0.4%) | 231 (0.5%) |
| 5 to 17 Years | 661 (0.6%) | 797 (0.7%) |
| 18 to 34 Years | 1,782 (0.6%) | 1,429 (0.5%) |
| 35 to 64 Years | 6,347 (1.9%) | 5,175 (1.5%) |
| 65 to 74 Years | 5,523 (7.9%) | 4,048 (4.9%) |
| 75 Years and over | 9,357 (22.0%) | 11,738 (17.5%) |
Disability Class: Vision Difficulty
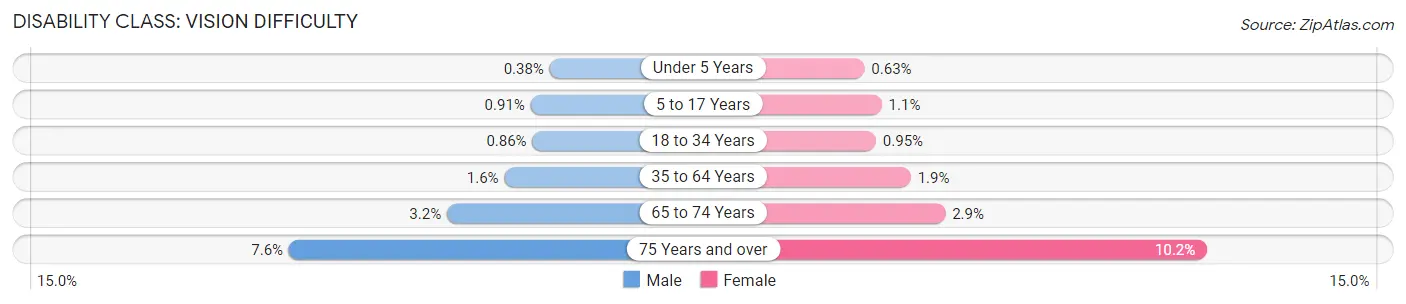
| Age Bracket | Male | Female |
| Under 5 Years | 180 (0.4%) | 285 (0.6%) |
| 5 to 17 Years | 1,040 (0.9%) | 1,238 (1.1%) |
| 18 to 34 Years | 2,586 (0.9%) | 2,870 (0.9%) |
| 35 to 64 Years | 5,533 (1.6%) | 6,594 (1.9%) |
| 65 to 74 Years | 2,251 (3.2%) | 2,408 (2.9%) |
| 75 Years and over | 3,256 (7.6%) | 6,818 (10.2%) |
Disability Class: Cognitive Difficulty
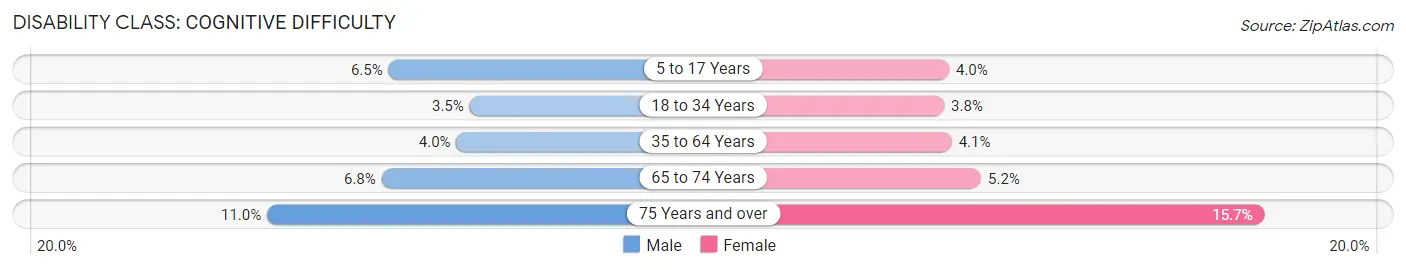
| Age Bracket | Male | Female |
| 5 to 17 Years | 7,422 (6.5%) | 4,445 (4.0%) |
| 18 to 34 Years | 10,413 (3.5%) | 11,506 (3.8%) |
| 35 to 64 Years | 13,387 (4.0%) | 14,000 (4.1%) |
| 65 to 74 Years | 4,694 (6.8%) | 4,317 (5.2%) |
| 75 Years and over | 4,685 (11.0%) | 10,524 (15.7%) |
Disability Class: Ambulatory Difficulty
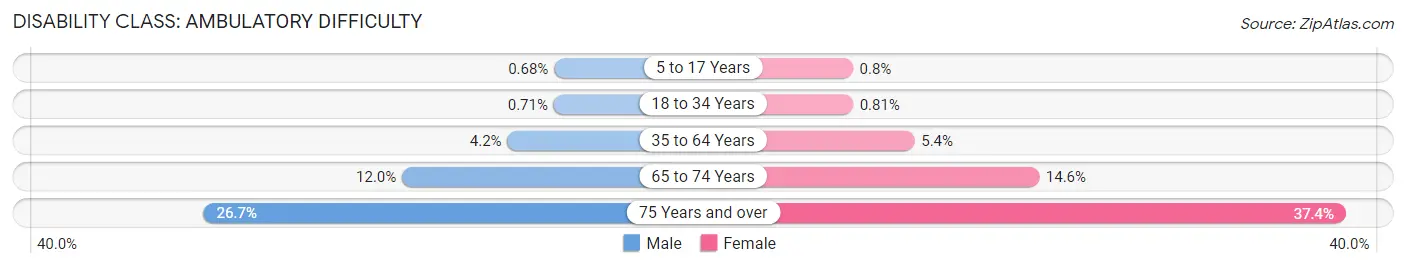
| Age Bracket | Male | Female |
| 5 to 17 Years | 776 (0.7%) | 889 (0.8%) |
| 18 to 34 Years | 2,112 (0.7%) | 2,454 (0.8%) |
| 35 to 64 Years | 14,011 (4.2%) | 18,427 (5.4%) |
| 65 to 74 Years | 8,325 (12.0%) | 12,211 (14.6%) |
| 75 Years and over | 11,380 (26.7%) | 25,095 (37.4%) |
Disability Class: Self-Care Difficulty
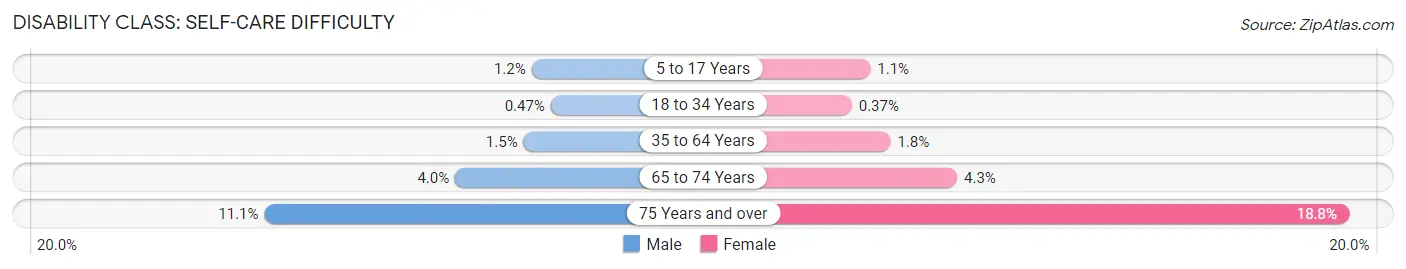
| Age Bracket | Male | Female |
| 5 to 17 Years | 1,354 (1.2%) | 1,182 (1.1%) |
| 18 to 34 Years | 1,415 (0.5%) | 1,117 (0.4%) |
| 35 to 64 Years | 5,005 (1.5%) | 6,217 (1.8%) |
| 65 to 74 Years | 2,798 (4.0%) | 3,570 (4.3%) |
| 75 Years and over | 4,729 (11.1%) | 12,624 (18.8%) |
Technology Access in Area Code 617
Computing Device Access in Area Code 617
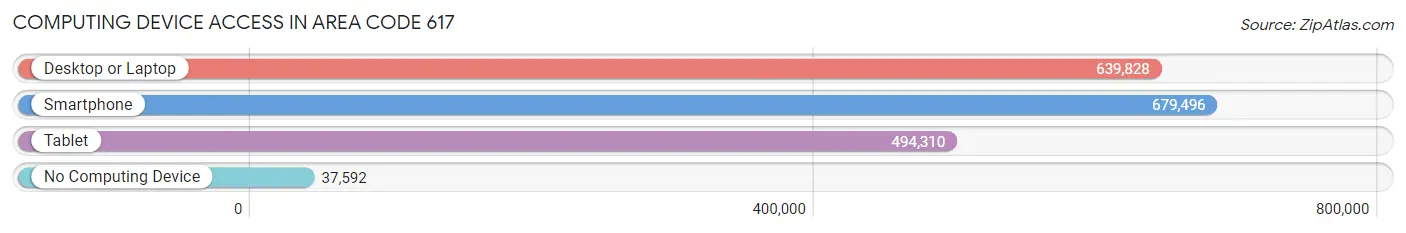
| Device Type | # Households | % Households |
| Desktop or Laptop | 639,828 | 84.6% |
| Smartphone | 679,496 | 89.8% |
| Tablet | 494,310 | 65.4% |
| No Computing Device | 37,592 | 5.0% |
| Total | 756,293 | 100.0% |
Internet Access in Area Code 617
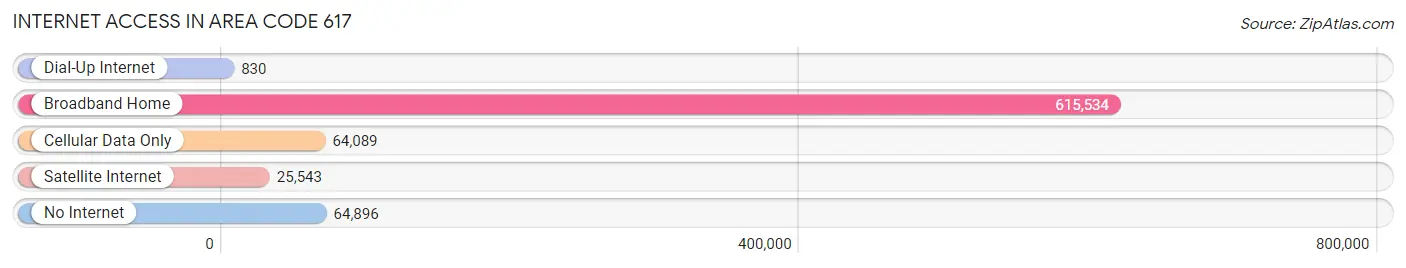
| Internet Type | # Households | % Households |
| Dial-Up Internet | 830 | 0.1% |
| Broadband Home | 615,534 | 81.4% |
| Cellular Data Only | 64,089 | 8.5% |
| Satellite Internet | 25,543 | 3.4% |
| No Internet | 64,896 | 8.6% |
| Total | 756,293 | 100.0% |
Area Code 617 Summary
Geography
Area code 617 is a telephone area code in the North American Numbering Plan (NANP) for the city of Boston, Massachusetts and its surrounding areas. It covers the entire city of Boston, as well as the towns of Brookline, Cambridge, Chelsea, Everett, Milton, Newton, Quincy, Revere, Somerville, Waltham, Watertown, and Winthrop.
Social
Area code 617 is a vibrant and diverse area, with a wide range of cultural and social activities. The city of Boston is home to a number of professional sports teams, including the Boston Red Sox, the Boston Bruins, and the New England Patriots. The city is also home to a number of universities and colleges, including Harvard University, Boston University, and the Massachusetts Institute of Technology.
Economics
Area code 617 is an economically prosperous area, with a strong job market and a high median income. The city of Boston is home to a number of major corporations, including Fidelity Investments, Liberty Mutual, and State Street Corporation. The area is also home to a number of start-ups and small businesses, as well as a thriving tourism industry.
Demographics
Area code 617 is home to a diverse population, with a wide range of ethnic and racial backgrounds. According to the 2010 census, the population of the area is approximately 617,594, with a median age of 33.7 years. The area is also home to a large number of immigrants, with approximately 25% of the population being foreign-born.
Common Questions
What is Per Capita Income in Area Code 617?
Per Capita income in Area Code 617 is $68,804.
What is the Median Family Income in Area Code 617?
Median Family Income in Area Code 617 is $149,426.
What is the Median Household income in Area Code 617?
Median Household Income in Area Code 617 is $116,814.
What is Income or Wage Gap in Area Code 617?
Income or Wage Gap in Area Code 617 is 26.1%.
Women in Area Code 617 earn 73.9 cents for every dollar earned by a man.
What is Family Income Deficit in Area Code 617?
Family Income Deficit in Area Code 617 is $10,502.
Families that are below poverty line in Area Code 617 earn $10,502 less on average than the poverty threshold level.
What is Inequality or Gini Index in Area Code 617?
Inequality or Gini Index in Area Code 617 is 36.83.
What is the Total Population of Area Code 617?
Total Population of Area Code 617 is 1,875,867.
What is the Total Male Population of Area Code 617?
Total Male Population of Area Code 617 is 916,595.
What is the Total Female Population of Area Code 617?
Total Female Population of Area Code 617 is 959,272.
What is the Ratio of Males per 100 Females in Area Code 617?
There are 95.55 Males per 100 Females in Area Code 617.
What is the Ratio of Females per 100 Males in Area Code 617?
There are 104.66 Females per 100 Males in Area Code 617.
What is the Median Population Age in Area Code 617?
Median Population Age in Area Code 617 is 37.3 Years.
What is the Average Family Size in Area Code 617
Average Family Size in Area Code 617 is 3.0 People.
What is the Average Household Size in Area Code 617
Average Household Size in Area Code 617 is 2.3 People.
How Large is the Labor Force in Area Code 617?
There are 1,103,254 People in the Labor Forcein in Area Code 617.
What is the Percentage of People in the Labor Force in Area Code 617?
69.3% of People are in the Labor Force in Area Code 617.
What is the Unemployment Rate in Area Code 617?
Unemployment Rate in Area Code 617 is 5.1%.