Zip Codes with the Highest Percentage of Population with a Degree in Communications in Connecticut
RELATED REPORTS & OPTIONS
Communications
Connecticut
Compare Zip Codes
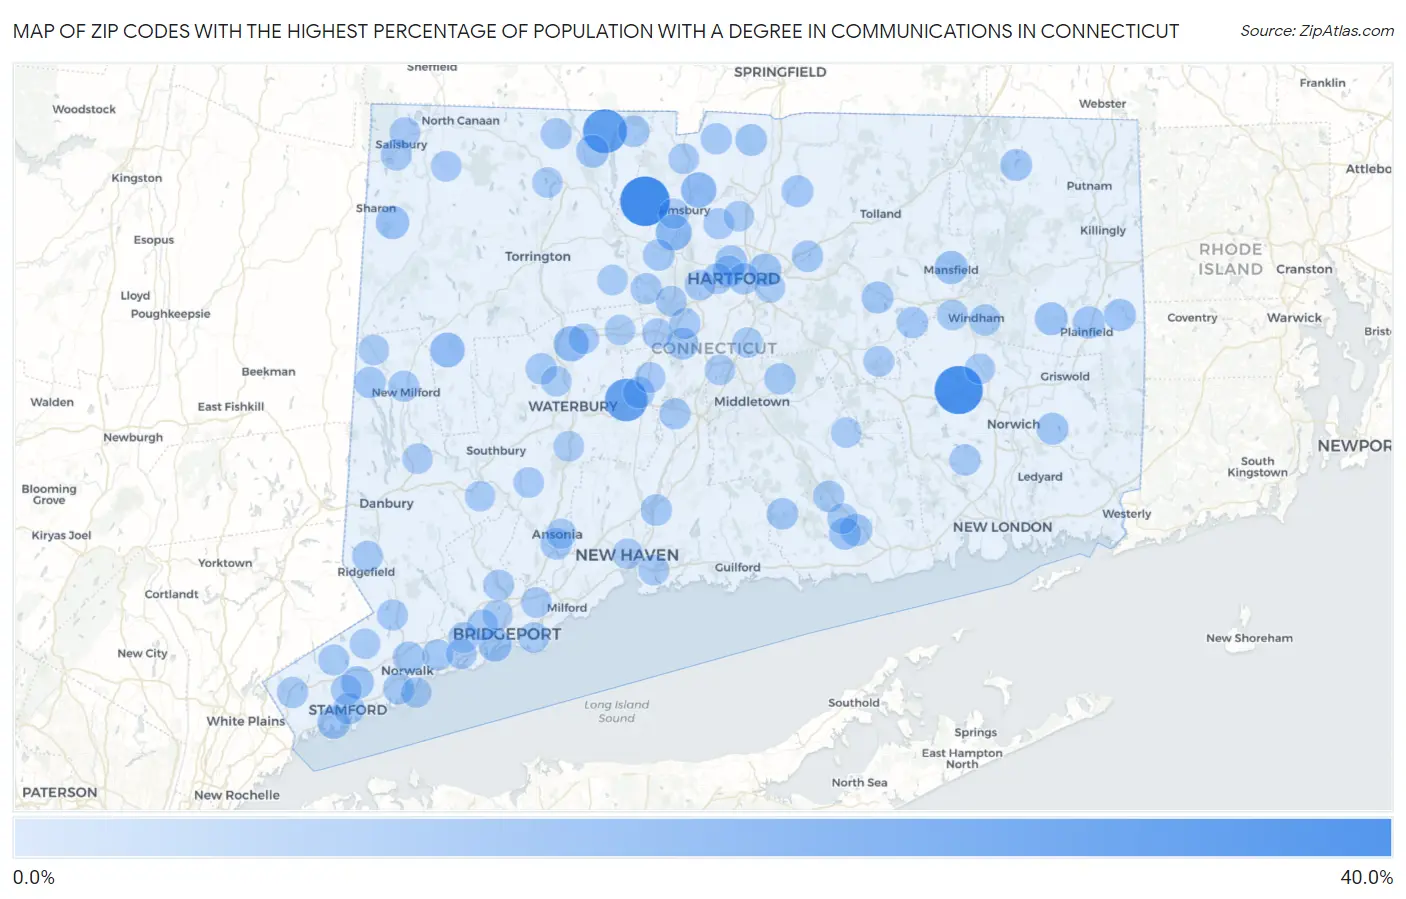
Map of Zip Codes with the Highest Percentage of Population with a Degree in Communications in Connecticut
0.0%
40.0%
Zip Codes with the Highest Percentage of Population with a Degree in Communications in Connecticut
| Zip Code | % Graduates | vs State | vs National | |
| 1. | 06059 | 38.3% | 3.9%(+34.4)#1 | 4.1%(+34.2)#88 |
| 2. | 06336 | 35.7% | 3.9%(+31.9)#2 | 4.1%(+31.6)#101 |
| 3. | 06091 | 28.3% | 3.9%(+24.4)#3 | 4.1%(+24.2)#172 |
| 4. | 06444 | 25.8% | 3.9%(+21.9)#4 | 4.1%(+21.7)#198 |
| 5. | 06089 | 13.9% | 3.9%(+10.0)#5 | 4.1%(+9.76)#630 |
| 6. | 06081 | 12.8% | 3.9%(+8.94)#6 | 4.1%(+8.67)#728 |
| 7. | 06782 | 12.5% | 3.9%(+8.69)#7 | 4.1%(+8.41)#755 |
| 8. | 06794 | 11.8% | 3.9%(+7.91)#8 | 4.1%(+7.63)#850 |
| 9. | 06069 | 9.6% | 3.9%(+5.69)#9 | 4.1%(+5.42)#1,250 |
| 10. | 06250 | 9.1% | 3.9%(+5.19)#10 | 4.1%(+4.92)#1,417 |
| 11. | 06605 | 9.0% | 3.9%(+5.10)#11 | 4.1%(+4.83)#1,449 |
| 12. | 06331 | 8.7% | 3.9%(+4.86)#12 | 4.1%(+4.59)#1,535 |
| 13. | 06065 | 8.5% | 3.9%(+4.66)#13 | 4.1%(+4.38)#1,624 |
| 14. | 06870 | 8.4% | 3.9%(+4.57)#14 | 4.1%(+4.29)#1,667 |
| 15. | 06108 | 8.4% | 3.9%(+4.50)#15 | 4.1%(+4.23)#1,692 |
| 16. | 06907 | 8.2% | 3.9%(+4.37)#16 | 4.1%(+4.09)#1,754 |
| 17. | 06374 | 7.6% | 3.9%(+3.73)#17 | 4.1%(+3.45)#2,143 |
| 18. | 06354 | 7.3% | 3.9%(+3.43)#18 | 4.1%(+3.15)#2,354 |
| 19. | 06409 | 7.2% | 3.9%(+3.34)#19 | 4.1%(+3.06)#2,433 |
| 20. | 06442 | 7.1% | 3.9%(+3.24)#20 | 4.1%(+2.97)#2,516 |
| 21. | 06365 | 7.0% | 3.9%(+3.15)#21 | 4.1%(+2.87)#2,601 |
| 22. | 06232 | 7.0% | 3.9%(+3.12)#22 | 4.1%(+2.84)#2,629 |
| 23. | 06851 | 6.9% | 3.9%(+3.04)#23 | 4.1%(+2.76)#2,698 |
| 24. | 06112 | 6.8% | 3.9%(+2.89)#24 | 4.1%(+2.62)#2,854 |
| 25. | 06282 | 6.7% | 3.9%(+2.86)#25 | 4.1%(+2.58)#2,889 |
| 26. | 06078 | 6.6% | 3.9%(+2.79)#26 | 4.1%(+2.51)#2,969 |
| 27. | 06052 | 6.6% | 3.9%(+2.74)#27 | 4.1%(+2.46)#3,022 |
| 28. | 06016 | 6.6% | 3.9%(+2.69)#28 | 4.1%(+2.42)#3,071 |
| 29. | 06105 | 6.5% | 3.9%(+2.68)#29 | 4.1%(+2.40)#3,091 |
| 30. | 06479 | 6.4% | 3.9%(+2.58)#30 | 4.1%(+2.30)#3,199 |
| 31. | 06027 | 6.4% | 3.9%(+2.50)#31 | 4.1%(+2.23)#3,299 |
| 32. | 06237 | 6.3% | 3.9%(+2.46)#32 | 4.1%(+2.18)#3,343 |
| 33. | 06001 | 6.3% | 3.9%(+2.41)#33 | 4.1%(+2.13)#3,401 |
| 34. | 06419 | 6.2% | 3.9%(+2.37)#34 | 4.1%(+2.10)#3,447 |
| 35. | 06901 | 6.2% | 3.9%(+2.34)#35 | 4.1%(+2.07)#3,479 |
| 36. | 06854 | 6.1% | 3.9%(+2.28)#36 | 4.1%(+2.00)#3,567 |
| 37. | 06418 | 6.1% | 3.9%(+2.28)#37 | 4.1%(+2.00)#3,569 |
| 38. | 06480 | 6.1% | 3.9%(+2.26)#38 | 4.1%(+1.98)#3,608 |
| 39. | 06103 | 6.1% | 3.9%(+2.23)#39 | 4.1%(+1.95)#3,648 |
| 40. | 06473 | 6.0% | 3.9%(+2.14)#40 | 4.1%(+1.86)#3,794 |
| 41. | 06042 | 6.0% | 3.9%(+2.12)#41 | 4.1%(+1.84)#3,816 |
| 42. | 06784 | 5.9% | 3.9%(+2.07)#42 | 4.1%(+1.79)#3,908 |
| 43. | 06085 | 5.8% | 3.9%(+1.96)#43 | 4.1%(+1.69)#4,076 |
| 44. | 06370 | 5.8% | 3.9%(+1.96)#44 | 4.1%(+1.68)#4,086 |
| 45. | 06280 | 5.8% | 3.9%(+1.91)#45 | 4.1%(+1.64)#4,157 |
| 46. | 06795 | 5.7% | 3.9%(+1.89)#46 | 4.1%(+1.61)#4,181 |
| 47. | 06039 | 5.7% | 3.9%(+1.86)#47 | 4.1%(+1.59)#4,225 |
| 48. | 06093 | 5.7% | 3.9%(+1.84)#48 | 4.1%(+1.56)#4,276 |
| 49. | 06880 | 5.6% | 3.9%(+1.78)#49 | 4.1%(+1.50)#4,377 |
| 50. | 06412 | 5.6% | 3.9%(+1.69)#50 | 4.1%(+1.42)#4,562 |
| 51. | 06831 | 5.5% | 3.9%(+1.67)#51 | 4.1%(+1.39)#4,595 |
| 52. | 06021 | 5.5% | 3.9%(+1.63)#52 | 4.1%(+1.36)#4,659 |
| 53. | 06451 | 5.4% | 3.9%(+1.58)#53 | 4.1%(+1.30)#4,767 |
| 54. | 06897 | 5.4% | 3.9%(+1.52)#54 | 4.1%(+1.24)#4,897 |
| 55. | 06776 | 5.4% | 3.9%(+1.51)#55 | 4.1%(+1.24)#4,899 |
| 56. | 06825 | 5.3% | 3.9%(+1.43)#56 | 4.1%(+1.15)#5,063 |
| 57. | 06903 | 5.2% | 3.9%(+1.38)#57 | 4.1%(+1.10)#5,174 |
| 58. | 06877 | 5.2% | 3.9%(+1.36)#58 | 4.1%(+1.09)#5,200 |
| 59. | 06824 | 5.2% | 3.9%(+1.33)#59 | 4.1%(+1.05)#5,279 |
| 60. | 06053 | 5.2% | 3.9%(+1.32)#60 | 4.1%(+1.04)#5,297 |
| 61. | 06002 | 5.1% | 3.9%(+1.28)#61 | 4.1%(+1.01)#5,367 |
| 62. | 06512 | 5.1% | 3.9%(+1.20)#62 | 4.1%(+0.925)#5,552 |
| 63. | 06119 | 5.0% | 3.9%(+1.19)#63 | 4.1%(+0.913)#5,580 |
| 64. | 06226 | 5.0% | 3.9%(+1.12)#64 | 4.1%(+0.845)#5,746 |
| 65. | 06068 | 5.0% | 3.9%(+1.11)#65 | 4.1%(+0.831)#5,781 |
| 66. | 06905 | 4.9% | 3.9%(+1.08)#66 | 4.1%(+0.802)#5,842 |
| 67. | 06032 | 4.9% | 3.9%(+1.06)#67 | 4.1%(+0.787)#5,873 |
| 68. | 06231 | 4.9% | 3.9%(+1.05)#68 | 4.1%(+0.774)#5,903 |
| 69. | 06031 | 4.8% | 3.9%(+0.990)#69 | 4.1%(+0.713)#6,073 |
| 70. | 06611 | 4.8% | 3.9%(+0.976)#70 | 4.1%(+0.699)#6,102 |
| 71. | 06786 | 4.7% | 3.9%(+0.847)#71 | 4.1%(+0.570)#6,397 |
| 72. | 06890 | 4.7% | 3.9%(+0.841)#72 | 4.1%(+0.565)#6,407 |
| 73. | 06489 | 4.7% | 3.9%(+0.834)#73 | 4.1%(+0.557)#6,425 |
| 74. | 06062 | 4.7% | 3.9%(+0.831)#74 | 4.1%(+0.554)#6,435 |
| 75. | 06614 | 4.7% | 3.9%(+0.805)#75 | 4.1%(+0.528)#6,513 |
| 76. | 06107 | 4.6% | 3.9%(+0.766)#76 | 4.1%(+0.489)#6,621 |
| 77. | 06755 | 4.6% | 3.9%(+0.743)#77 | 4.1%(+0.466)#6,686 |
| 78. | 06417 | 4.6% | 3.9%(+0.742)#78 | 4.1%(+0.465)#6,690 |
| 79. | 06013 | 4.6% | 3.9%(+0.721)#79 | 4.1%(+0.444)#6,748 |
| 80. | 06478 | 4.6% | 3.9%(+0.721)#80 | 4.1%(+0.444)#6,750 |
| 81. | 06035 | 4.6% | 3.9%(+0.712)#81 | 4.1%(+0.436)#6,769 |
| 82. | 06779 | 4.6% | 3.9%(+0.706)#82 | 4.1%(+0.430)#6,787 |
| 83. | 06855 | 4.5% | 3.9%(+0.666)#83 | 4.1%(+0.389)#6,889 |
| 84. | 06095 | 4.5% | 3.9%(+0.653)#84 | 4.1%(+0.376)#6,924 |
| 85. | 06067 | 4.5% | 3.9%(+0.598)#85 | 4.1%(+0.321)#7,077 |
| 86. | 06254 | 4.4% | 3.9%(+0.575)#86 | 4.1%(+0.298)#7,153 |
| 87. | 06070 | 4.4% | 3.9%(+0.568)#87 | 4.1%(+0.291)#7,181 |
| 88. | 06023 | 4.4% | 3.9%(+0.564)#88 | 4.1%(+0.288)#7,198 |
| 89. | 06770 | 4.4% | 3.9%(+0.545)#89 | 4.1%(+0.268)#7,244 |
| 90. | 06098 | 4.4% | 3.9%(+0.540)#90 | 4.1%(+0.264)#7,254 |
| 91. | 06804 | 4.4% | 3.9%(+0.532)#91 | 4.1%(+0.256)#7,277 |
| 92. | 06118 | 4.4% | 3.9%(+0.524)#92 | 4.1%(+0.247)#7,301 |
| 93. | 06482 | 4.4% | 3.9%(+0.520)#93 | 4.1%(+0.244)#7,311 |
| 94. | 06010 | 4.4% | 3.9%(+0.518)#94 | 4.1%(+0.242)#7,319 |
| 95. | 06469 | 4.4% | 3.9%(+0.513)#95 | 4.1%(+0.236)#7,334 |
| 96. | 06840 | 4.4% | 3.9%(+0.492)#96 | 4.1%(+0.215)#7,409 |
| 97. | 06511 | 4.3% | 3.9%(+0.474)#97 | 4.1%(+0.198)#7,483 |
| 98. | 06606 | 4.3% | 3.9%(+0.459)#98 | 4.1%(+0.183)#7,530 |
| 99. | 06615 | 4.3% | 3.9%(+0.457)#99 | 4.1%(+0.180)#7,543 |
| 100. | 06401 | 4.2% | 3.9%(+0.340)#100 | 4.1%(+0.063)#7,901 |
Common Questions
What are the Top 10 Zip Codes with the Highest Percentage of Population with a Degree in Communications in Connecticut?
Top 10 Zip Codes with the Highest Percentage of Population with a Degree in Communications in Connecticut are:
What zip code has the Highest Percentage of Population with a Degree in Communications in Connecticut?
06059 has the Highest Percentage of Population with a Degree in Communications in Connecticut with 38.3%.
What is the Percentage of Population with a Degree in Communications in the State of Connecticut?
Percentage of Population with a Degree in Communications in Connecticut is 3.9%.
What is the Percentage of Population with a Degree in Communications in the United States?
Percentage of Population with a Degree in Communications in the United States is 4.1%.