Zip Codes with the Highest Percentage of Population with a Degree in Communications in Idaho
RELATED REPORTS & OPTIONS
Communications
Idaho
Compare Zip Codes
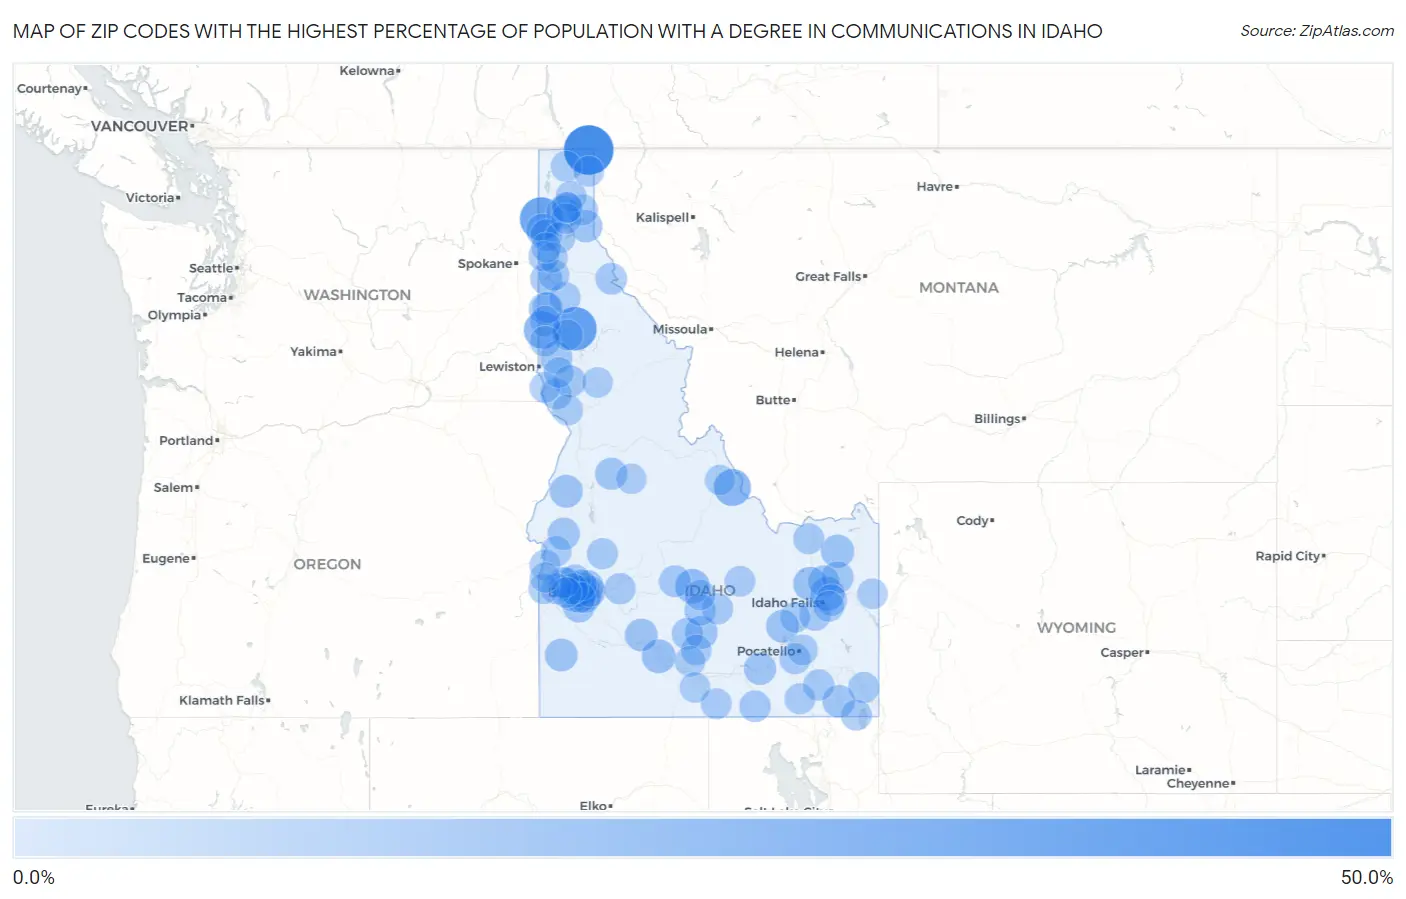
Map of Zip Codes with the Highest Percentage of Population with a Degree in Communications in Idaho
0.0%
50.0%
Zip Codes with the Highest Percentage of Population with a Degree in Communications in Idaho
| Zip Code | % Graduates | vs State | vs National | |
| 1. | 83826 | 48.4% | 3.7%(+44.7)#1 | 4.1%(+44.3)#56 |
| 2. | 83806 | 33.3% | 3.7%(+29.6)#2 | 4.1%(+29.2)#125 |
| 3. | 83822 | 31.9% | 3.7%(+28.2)#3 | 4.1%(+27.7)#141 |
| 4. | 83872 | 18.8% | 3.7%(+15.1)#4 | 4.1%(+14.7)#374 |
| 5. | 83468 | 17.9% | 3.7%(+14.2)#5 | 4.1%(+13.7)#402 |
| 6. | 83353 | 12.2% | 3.7%(+8.57)#6 | 4.1%(+8.11)#787 |
| 7. | 83332 | 10.3% | 3.7%(+6.61)#7 | 4.1%(+6.16)#1,086 |
| 8. | 83454 | 10.3% | 3.7%(+6.57)#8 | 4.1%(+6.12)#1,096 |
| 9. | 83444 | 9.9% | 3.7%(+6.19)#9 | 4.1%(+5.74)#1,179 |
| 10. | 83445 | 9.3% | 3.7%(+5.60)#10 | 4.1%(+5.15)#1,332 |
| 11. | 83612 | 8.3% | 3.7%(+4.60)#11 | 4.1%(+4.15)#1,736 |
| 12. | 83262 | 8.2% | 3.7%(+4.50)#12 | 4.1%(+4.05)#1,774 |
| 13. | 83804 | 8.0% | 3.7%(+4.28)#13 | 4.1%(+3.83)#1,904 |
| 14. | 83349 | 7.8% | 3.7%(+4.16)#14 | 4.1%(+3.71)#1,971 |
| 15. | 83633 | 7.8% | 3.7%(+4.16)#15 | 4.1%(+3.71)#1,972 |
| 16. | 83650 | 7.8% | 3.7%(+4.16)#16 | 4.1%(+3.71)#1,973 |
| 17. | 83825 | 7.8% | 3.7%(+4.11)#17 | 4.1%(+3.66)#2,015 |
| 18. | 83263 | 7.3% | 3.7%(+3.65)#18 | 4.1%(+3.20)#2,312 |
| 19. | 83824 | 7.1% | 3.7%(+3.38)#19 | 4.1%(+2.92)#2,546 |
| 20. | 83811 | 6.9% | 3.7%(+3.26)#20 | 4.1%(+2.81)#2,656 |
| 21. | 83211 | 6.8% | 3.7%(+3.15)#21 | 4.1%(+2.70)#2,762 |
| 22. | 83535 | 6.8% | 3.7%(+3.13)#22 | 4.1%(+2.68)#2,777 |
| 23. | 83706 | 6.8% | 3.7%(+3.07)#23 | 4.1%(+2.62)#2,851 |
| 24. | 83634 | 6.7% | 3.7%(+2.97)#24 | 4.1%(+2.52)#2,966 |
| 25. | 83702 | 6.6% | 3.7%(+2.90)#25 | 4.1%(+2.45)#3,034 |
| 26. | 83645 | 6.4% | 3.7%(+2.72)#26 | 4.1%(+2.26)#3,246 |
| 27. | 83440 | 6.4% | 3.7%(+2.67)#27 | 4.1%(+2.22)#3,308 |
| 28. | 83638 | 6.3% | 3.7%(+2.64)#28 | 4.1%(+2.19)#3,333 |
| 29. | 83523 | 5.7% | 3.7%(+2.01)#29 | 4.1%(+1.56)#4,290 |
| 30. | 83669 | 5.7% | 3.7%(+2.01)#30 | 4.1%(+1.55)#4,295 |
| 31. | 83876 | 5.7% | 3.7%(+2.01)#31 | 4.1%(+1.55)#4,296 |
| 32. | 83703 | 5.6% | 3.7%(+1.89)#32 | 4.1%(+1.44)#4,508 |
| 33. | 83340 | 5.5% | 3.7%(+1.82)#33 | 4.1%(+1.37)#4,638 |
| 34. | 83846 | 5.5% | 3.7%(+1.80)#34 | 4.1%(+1.34)#4,678 |
| 35. | 83869 | 5.4% | 3.7%(+1.75)#35 | 4.1%(+1.30)#4,771 |
| 36. | 83434 | 5.4% | 3.7%(+1.73)#36 | 4.1%(+1.28)#4,806 |
| 37. | 83642 | 5.3% | 3.7%(+1.65)#37 | 4.1%(+1.19)#4,974 |
| 38. | 83352 | 5.1% | 3.7%(+1.40)#38 | 4.1%(+0.950)#5,497 |
| 39. | 83218 | 5.0% | 3.7%(+1.32)#39 | 4.1%(+0.865)#5,700 |
| 40. | 83342 | 4.9% | 3.7%(+1.19)#40 | 4.1%(+0.743)#5,973 |
| 41. | 83313 | 4.9% | 3.7%(+1.19)#41 | 4.1%(+0.736)#6,001 |
| 42. | 83401 | 4.9% | 3.7%(+1.17)#42 | 4.1%(+0.720)#6,056 |
| 43. | 83704 | 4.7% | 3.7%(+1.05)#43 | 4.1%(+0.600)#6,330 |
| 44. | 83713 | 4.7% | 3.7%(+1.01)#44 | 4.1%(+0.554)#6,436 |
| 45. | 83716 | 4.7% | 3.7%(+0.997)#45 | 4.1%(+0.545)#6,460 |
| 46. | 83320 | 4.6% | 3.7%(+0.946)#46 | 4.1%(+0.495)#6,606 |
| 47. | 83705 | 4.5% | 3.7%(+0.842)#47 | 4.1%(+0.391)#6,885 |
| 48. | 83254 | 4.3% | 3.7%(+0.664)#48 | 4.1%(+0.213)#7,420 |
| 49. | 83234 | 4.3% | 3.7%(+0.572)#49 | 4.1%(+0.120)#7,708 |
| 50. | 83712 | 4.3% | 3.7%(+0.570)#50 | 4.1%(+0.119)#7,724 |
| 51. | 83555 | 4.2% | 3.7%(+0.483)#51 | 4.1%(+0.032)#8,008 |
| 52. | 83616 | 4.2% | 3.7%(+0.473)#52 | 4.1%(+0.021)#8,040 |
| 53. | 83714 | 4.1% | 3.7%(+0.454)#53 | 4.1%(+0.003)#8,105 |
| 54. | 83287 | 4.1% | 3.7%(+0.398)#54 | 4.1%(-0.053)#8,308 |
| 55. | 83861 | 4.1% | 3.7%(+0.385)#55 | 4.1%(-0.067)#8,352 |
| 56. | 83709 | 4.1% | 3.7%(+0.376)#56 | 4.1%(-0.076)#8,379 |
| 57. | 83836 | 4.0% | 3.7%(+0.349)#57 | 4.1%(-0.103)#8,469 |
| 58. | 83646 | 3.9% | 3.7%(+0.263)#58 | 4.1%(-0.189)#8,761 |
| 59. | 83833 | 3.9% | 3.7%(+0.247)#59 | 4.1%(-0.204)#8,810 |
| 60. | 83204 | 3.9% | 3.7%(+0.185)#60 | 4.1%(-0.267)#9,023 |
| 61. | 83622 | 3.8% | 3.7%(+0.163)#61 | 4.1%(-0.289)#9,105 |
| 62. | 83423 | 3.8% | 3.7%(+0.163)#62 | 4.1%(-0.289)#9,114 |
| 63. | 83801 | 3.8% | 3.7%(+0.111)#63 | 4.1%(-0.340)#9,301 |
| 64. | 83805 | 3.8% | 3.7%(+0.092)#64 | 4.1%(-0.360)#9,372 |
| 65. | 83406 | 3.7% | 3.7%(+0.011)#65 | 4.1%(-0.441)#9,650 |
| 66. | 83852 | 3.7% | 3.7%(-0.007)#66 | 4.1%(-0.459)#9,712 |
| 67. | 83522 | 3.6% | 3.7%(-0.034)#67 | 4.1%(-0.485)#9,807 |
| 68. | 83644 | 3.6% | 3.7%(-0.036)#68 | 4.1%(-0.488)#9,812 |
| 69. | 83346 | 3.5% | 3.7%(-0.175)#69 | 4.1%(-0.626)#10,293 |
| 70. | 83252 | 3.4% | 3.7%(-0.235)#70 | 4.1%(-0.687)#10,511 |
| 71. | 83870 | 3.4% | 3.7%(-0.235)#71 | 4.1%(-0.687)#10,524 |
| 72. | 83864 | 3.4% | 3.7%(-0.315)#72 | 4.1%(-0.767)#10,815 |
| 73. | 83607 | 3.3% | 3.7%(-0.356)#73 | 4.1%(-0.808)#10,960 |
| 74. | 83619 | 3.3% | 3.7%(-0.357)#74 | 4.1%(-0.809)#10,965 |
| 75. | 83823 | 3.3% | 3.7%(-0.360)#75 | 4.1%(-0.812)#10,980 |
| 76. | 83845 | 3.2% | 3.7%(-0.458)#76 | 4.1%(-0.909)#11,349 |
| 77. | 83333 | 3.2% | 3.7%(-0.470)#77 | 4.1%(-0.921)#11,405 |
| 78. | 83855 | 3.2% | 3.7%(-0.517)#78 | 4.1%(-0.969)#11,586 |
| 79. | 83854 | 3.1% | 3.7%(-0.589)#79 | 4.1%(-1.04)#11,846 |
| 80. | 83324 | 3.1% | 3.7%(-0.606)#80 | 4.1%(-1.06)#11,906 |
| 81. | 83501 | 3.1% | 3.7%(-0.614)#81 | 4.1%(-1.07)#11,931 |
| 82. | 83843 | 3.0% | 3.7%(-0.646)#82 | 4.1%(-1.10)#12,052 |
| 83. | 83661 | 3.0% | 3.7%(-0.684)#83 | 4.1%(-1.14)#12,192 |
| 84. | 83201 | 3.0% | 3.7%(-0.699)#84 | 4.1%(-1.15)#12,253 |
| 85. | 83676 | 3.0% | 3.7%(-0.718)#85 | 4.1%(-1.17)#12,332 |
| 86. | 83255 | 2.9% | 3.7%(-0.759)#86 | 4.1%(-1.21)#12,508 |
| 87. | 83338 | 2.9% | 3.7%(-0.812)#87 | 4.1%(-1.26)#12,723 |
| 88. | 83334 | 2.8% | 3.7%(-0.838)#88 | 4.1%(-1.29)#12,821 |
| 89. | 83536 | 2.8% | 3.7%(-0.867)#89 | 4.1%(-1.32)#12,920 |
| 90. | 83860 | 2.8% | 3.7%(-0.894)#90 | 4.1%(-1.35)#13,050 |
| 91. | 83687 | 2.8% | 3.7%(-0.896)#91 | 4.1%(-1.35)#13,057 |
| 92. | 83455 | 2.8% | 3.7%(-0.922)#92 | 4.1%(-1.37)#13,154 |
| 93. | 83840 | 2.7% | 3.7%(-0.981)#93 | 4.1%(-1.43)#13,400 |
| 94. | 83660 | 2.7% | 3.7%(-1.00)#94 | 4.1%(-1.45)#13,476 |
| 95. | 83524 | 2.7% | 3.7%(-1.03)#95 | 4.1%(-1.48)#13,582 |
| 96. | 83611 | 2.6% | 3.7%(-1.10)#96 | 4.1%(-1.55)#13,844 |
| 97. | 83815 | 2.5% | 3.7%(-1.16)#97 | 4.1%(-1.61)#14,050 |
| 98. | 83467 | 2.5% | 3.7%(-1.16)#98 | 4.1%(-1.61)#14,065 |
| 99. | 83221 | 2.5% | 3.7%(-1.22)#99 | 4.1%(-1.67)#14,263 |
| 100. | 83858 | 2.4% | 3.7%(-1.24)#100 | 4.1%(-1.69)#14,325 |
Common Questions
What are the Top 10 Zip Codes with the Highest Percentage of Population with a Degree in Communications in Idaho?
Top 10 Zip Codes with the Highest Percentage of Population with a Degree in Communications in Idaho are:
What zip code has the Highest Percentage of Population with a Degree in Communications in Idaho?
83826 has the Highest Percentage of Population with a Degree in Communications in Idaho with 48.4%.
What is the Percentage of Population with a Degree in Communications in the State of Idaho?
Percentage of Population with a Degree in Communications in Idaho is 3.7%.
What is the Percentage of Population with a Degree in Communications in the United States?
Percentage of Population with a Degree in Communications in the United States is 4.1%.