Zip Codes with the Highest Percentage of Population with a Degree in Communications in Colorado
RELATED REPORTS & OPTIONS
Communications
Colorado
Compare Zip Codes
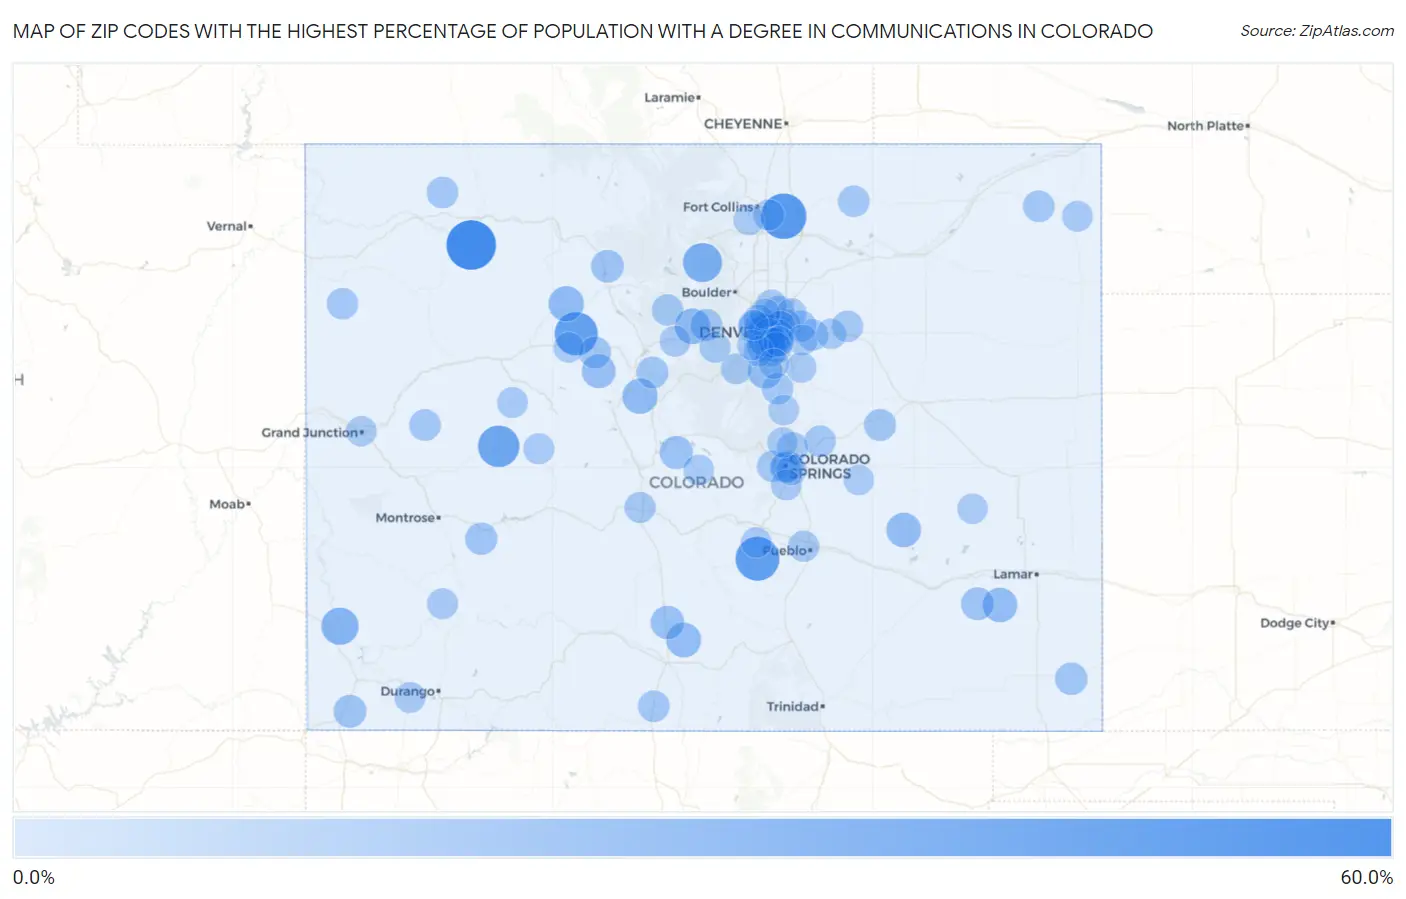
Map of Zip Codes with the Highest Percentage of Population with a Degree in Communications in Colorado
0.0%
60.0%
Zip Codes with the Highest Percentage of Population with a Degree in Communications in Colorado
| Zip Code | % Graduates | vs State | vs National | |
| 1. | 81638 | 52.2% | 4.8%(+47.4)#1 | 4.1%(+48.0)#40 |
| 2. | 80546 | 41.8% | 4.8%(+37.0)#2 | 4.1%(+37.7)#74 |
| 3. | 81253 | 38.0% | 4.8%(+33.3)#3 | 4.1%(+33.9)#89 |
| 4. | 81655 | 36.2% | 4.8%(+31.4)#4 | 4.1%(+32.1)#98 |
| 5. | 81434 | 32.1% | 4.8%(+27.4)#5 | 4.1%(+28.0)#140 |
| 6. | 80510 | 26.5% | 4.8%(+21.7)#6 | 4.1%(+22.3)#190 |
| 7. | 81320 | 21.7% | 4.8%(+17.0)#7 | 4.1%(+17.6)#283 |
| 8. | 80436 | 17.8% | 4.8%(+13.0)#8 | 4.1%(+13.7)#404 |
| 9. | 80420 | 17.1% | 4.8%(+12.3)#9 | 4.1%(+12.9)#438 |
| 10. | 80463 | 17.1% | 4.8%(+12.3)#10 | 4.1%(+12.9)#439 |
| 11. | 81146 | 15.7% | 4.8%(+11.0)#11 | 4.1%(+11.6)#513 |
| 12. | 81063 | 15.6% | 4.8%(+10.8)#12 | 4.1%(+11.5)#522 |
| 13. | 81044 | 15.4% | 4.8%(+10.6)#13 | 4.1%(+11.2)#532 |
| 14. | 80131 | 15.1% | 4.8%(+10.3)#14 | 4.1%(+11.0)#547 |
| 15. | 81645 | 13.7% | 4.8%(+8.94)#15 | 4.1%(+9.58)#636 |
| 16. | 81136 | 13.0% | 4.8%(+8.19)#16 | 4.1%(+8.83)#710 |
| 17. | 80449 | 12.2% | 4.8%(+7.45)#17 | 4.1%(+8.09)#789 |
| 18. | 81054 | 11.4% | 4.8%(+6.66)#18 | 4.1%(+7.29)#909 |
| 19. | 81334 | 11.1% | 4.8%(+6.34)#19 | 4.1%(+6.98)#951 |
| 20. | 80459 | 11.1% | 4.8%(+6.29)#20 | 4.1%(+6.92)#975 |
| 21. | 81090 | 10.4% | 4.8%(+5.63)#21 | 4.1%(+6.27)#1,070 |
| 22. | 81220 | 10.0% | 4.8%(+5.23)#22 | 4.1%(+5.86)#1,148 |
| 23. | 81620 | 9.4% | 4.8%(+4.66)#23 | 4.1%(+5.30)#1,291 |
| 24. | 80203 | 9.3% | 4.8%(+4.53)#24 | 4.1%(+5.17)#1,326 |
| 25. | 80832 | 9.2% | 4.8%(+4.44)#25 | 4.1%(+5.08)#1,351 |
| 26. | 80427 | 9.2% | 4.8%(+4.38)#26 | 4.1%(+5.02)#1,376 |
| 27. | 80204 | 9.1% | 4.8%(+4.30)#27 | 4.1%(+4.94)#1,411 |
| 28. | 80424 | 8.9% | 4.8%(+4.14)#28 | 4.1%(+4.78)#1,469 |
| 29. | 80219 | 8.8% | 4.8%(+4.07)#29 | 4.1%(+4.71)#1,495 |
| 30. | 80246 | 8.7% | 4.8%(+3.96)#30 | 4.1%(+4.59)#1,531 |
| 31. | 80731 | 8.5% | 4.8%(+3.73)#31 | 4.1%(+4.37)#1,628 |
| 32. | 80207 | 8.5% | 4.8%(+3.69)#32 | 4.1%(+4.33)#1,645 |
| 33. | 80202 | 8.4% | 4.8%(+3.60)#33 | 4.1%(+4.24)#1,687 |
| 34. | 81148 | 8.3% | 4.8%(+3.56)#34 | 4.1%(+4.20)#1,714 |
| 35. | 81646 | 8.3% | 4.8%(+3.56)#35 | 4.1%(+4.20)#1,716 |
| 36. | 80216 | 8.3% | 4.8%(+3.53)#36 | 4.1%(+4.17)#1,729 |
| 37. | 81625 | 8.3% | 4.8%(+3.52)#37 | 4.1%(+4.15)#1,735 |
| 38. | 80831 | 8.2% | 4.8%(+3.39)#38 | 4.1%(+4.03)#1,791 |
| 39. | 80239 | 8.1% | 4.8%(+3.29)#39 | 4.1%(+3.93)#1,843 |
| 40. | 80611 | 8.1% | 4.8%(+3.29)#40 | 4.1%(+3.93)#1,845 |
| 41. | 80903 | 8.0% | 4.8%(+3.25)#41 | 4.1%(+3.89)#1,869 |
| 42. | 80137 | 8.0% | 4.8%(+3.23)#42 | 4.1%(+3.86)#1,882 |
| 43. | 81648 | 7.9% | 4.8%(+3.14)#43 | 4.1%(+3.78)#1,931 |
| 44. | 80109 | 7.9% | 4.8%(+3.12)#44 | 4.1%(+3.76)#1,944 |
| 45. | 80224 | 7.8% | 4.8%(+3.07)#45 | 4.1%(+3.71)#1,968 |
| 46. | 80136 | 7.7% | 4.8%(+2.97)#46 | 4.1%(+3.61)#2,033 |
| 47. | 80829 | 7.7% | 4.8%(+2.96)#47 | 4.1%(+3.59)#2,040 |
| 48. | 80442 | 7.7% | 4.8%(+2.93)#48 | 4.1%(+3.57)#2,053 |
| 49. | 80223 | 7.5% | 4.8%(+2.74)#49 | 4.1%(+3.37)#2,183 |
| 50. | 80205 | 7.5% | 4.8%(+2.72)#50 | 4.1%(+3.35)#2,202 |
| 51. | 80033 | 7.3% | 4.8%(+2.49)#51 | 4.1%(+3.13)#2,383 |
| 52. | 81201 | 7.2% | 4.8%(+2.41)#52 | 4.1%(+3.04)#2,452 |
| 53. | 81003 | 7.1% | 4.8%(+2.34)#53 | 4.1%(+2.98)#2,506 |
| 54. | 80019 | 7.0% | 4.8%(+2.27)#54 | 4.1%(+2.90)#2,572 |
| 55. | 80121 | 6.9% | 4.8%(+2.13)#55 | 4.1%(+2.77)#2,697 |
| 56. | 80640 | 6.8% | 4.8%(+2.07)#56 | 4.1%(+2.71)#2,747 |
| 57. | 80547 | 6.8% | 4.8%(+2.07)#57 | 4.1%(+2.71)#2,752 |
| 58. | 81426 | 6.8% | 4.8%(+2.02)#58 | 4.1%(+2.66)#2,796 |
| 59. | 80212 | 6.8% | 4.8%(+2.01)#59 | 4.1%(+2.65)#2,805 |
| 60. | 81326 | 6.8% | 4.8%(+2.01)#60 | 4.1%(+2.65)#2,806 |
| 61. | 80211 | 6.8% | 4.8%(+1.99)#61 | 4.1%(+2.63)#2,827 |
| 62. | 80476 | 6.8% | 4.8%(+1.98)#62 | 4.1%(+2.62)#2,843 |
| 63. | 80209 | 6.7% | 4.8%(+1.97)#63 | 4.1%(+2.60)#2,869 |
| 64. | 81225 | 6.7% | 4.8%(+1.94)#64 | 4.1%(+2.57)#2,901 |
| 65. | 80241 | 6.7% | 4.8%(+1.94)#65 | 4.1%(+2.57)#2,904 |
| 66. | 80920 | 6.6% | 4.8%(+1.85)#66 | 4.1%(+2.49)#2,993 |
| 67. | 80022 | 6.6% | 4.8%(+1.85)#67 | 4.1%(+2.48)#2,997 |
| 68. | 80230 | 6.6% | 4.8%(+1.82)#68 | 4.1%(+2.46)#3,029 |
| 69. | 80905 | 6.6% | 4.8%(+1.80)#69 | 4.1%(+2.44)#3,053 |
| 70. | 80003 | 6.5% | 4.8%(+1.76)#70 | 4.1%(+2.40)#3,094 |
| 71. | 80238 | 6.5% | 4.8%(+1.75)#71 | 4.1%(+2.39)#3,104 |
| 72. | 81623 | 6.5% | 4.8%(+1.70)#72 | 4.1%(+2.33)#3,168 |
| 73. | 80902 | 6.4% | 4.8%(+1.65)#73 | 4.1%(+2.29)#3,212 |
| 74. | 80734 | 6.4% | 4.8%(+1.62)#74 | 4.1%(+2.25)#3,257 |
| 75. | 80236 | 6.4% | 4.8%(+1.61)#75 | 4.1%(+2.24)#3,276 |
| 76. | 80433 | 6.3% | 4.8%(+1.52)#76 | 4.1%(+2.16)#3,371 |
| 77. | 80218 | 6.3% | 4.8%(+1.50)#77 | 4.1%(+2.13)#3,402 |
| 78. | 80439 | 6.2% | 4.8%(+1.46)#78 | 4.1%(+2.10)#3,443 |
| 79. | 81226 | 6.2% | 4.8%(+1.44)#79 | 4.1%(+2.07)#3,474 |
| 80. | 80210 | 6.1% | 4.8%(+1.37)#80 | 4.1%(+2.01)#3,552 |
| 81. | 80018 | 6.1% | 4.8%(+1.36)#81 | 4.1%(+2.00)#3,571 |
| 82. | 80820 | 6.0% | 4.8%(+1.27)#82 | 4.1%(+1.91)#3,708 |
| 83. | 80222 | 6.0% | 4.8%(+1.20)#83 | 4.1%(+1.84)#3,824 |
| 84. | 80237 | 6.0% | 4.8%(+1.19)#84 | 4.1%(+1.83)#3,839 |
| 85. | 80118 | 5.9% | 4.8%(+1.12)#85 | 4.1%(+1.76)#3,943 |
| 86. | 80260 | 5.9% | 4.8%(+1.12)#86 | 4.1%(+1.76)#3,949 |
| 87. | 81501 | 5.9% | 4.8%(+1.11)#87 | 4.1%(+1.75)#3,954 |
| 88. | 80538 | 5.8% | 4.8%(+1.08)#88 | 4.1%(+1.71)#4,035 |
| 89. | 80123 | 5.8% | 4.8%(+1.05)#89 | 4.1%(+1.69)#4,077 |
| 90. | 80138 | 5.8% | 4.8%(+1.03)#90 | 4.1%(+1.67)#4,103 |
| 91. | 80102 | 5.8% | 4.8%(+1.03)#91 | 4.1%(+1.66)#4,112 |
| 92. | 80231 | 5.8% | 4.8%(+1.02)#92 | 4.1%(+1.66)#4,122 |
| 93. | 80910 | 5.8% | 4.8%(+1.02)#93 | 4.1%(+1.65)#4,132 |
| 94. | 81631 | 5.7% | 4.8%(+0.972)#94 | 4.1%(+1.61)#4,189 |
| 95. | 80227 | 5.7% | 4.8%(+0.970)#95 | 4.1%(+1.61)#4,192 |
| 96. | 80864 | 5.7% | 4.8%(+0.942)#96 | 4.1%(+1.58)#4,238 |
| 97. | 80130 | 5.7% | 4.8%(+0.919)#97 | 4.1%(+1.56)#4,289 |
| 98. | 80002 | 5.6% | 4.8%(+0.808)#98 | 4.1%(+1.45)#4,486 |
| 99. | 81045 | 5.6% | 4.8%(+0.783)#99 | 4.1%(+1.42)#4,552 |
| 100. | 80840 | 5.5% | 4.8%(+0.720)#100 | 4.1%(+1.36)#4,653 |
Common Questions
What are the Top 10 Zip Codes with the Highest Percentage of Population with a Degree in Communications in Colorado?
Top 10 Zip Codes with the Highest Percentage of Population with a Degree in Communications in Colorado are:
What zip code has the Highest Percentage of Population with a Degree in Communications in Colorado?
81638 has the Highest Percentage of Population with a Degree in Communications in Colorado with 52.2%.
What is the Percentage of Population with a Degree in Communications in the State of Colorado?
Percentage of Population with a Degree in Communications in Colorado is 4.8%.
What is the Percentage of Population with a Degree in Communications in the United States?
Percentage of Population with a Degree in Communications in the United States is 4.1%.