Zip Codes with the Highest Percentage of Population with a Degree in Communications in Alabama
RELATED REPORTS & OPTIONS
Communications
Alabama
Compare Zip Codes
Map of Zip Codes with the Highest Percentage of Population with a Degree in Communications in Alabama
0.0%
100.0%
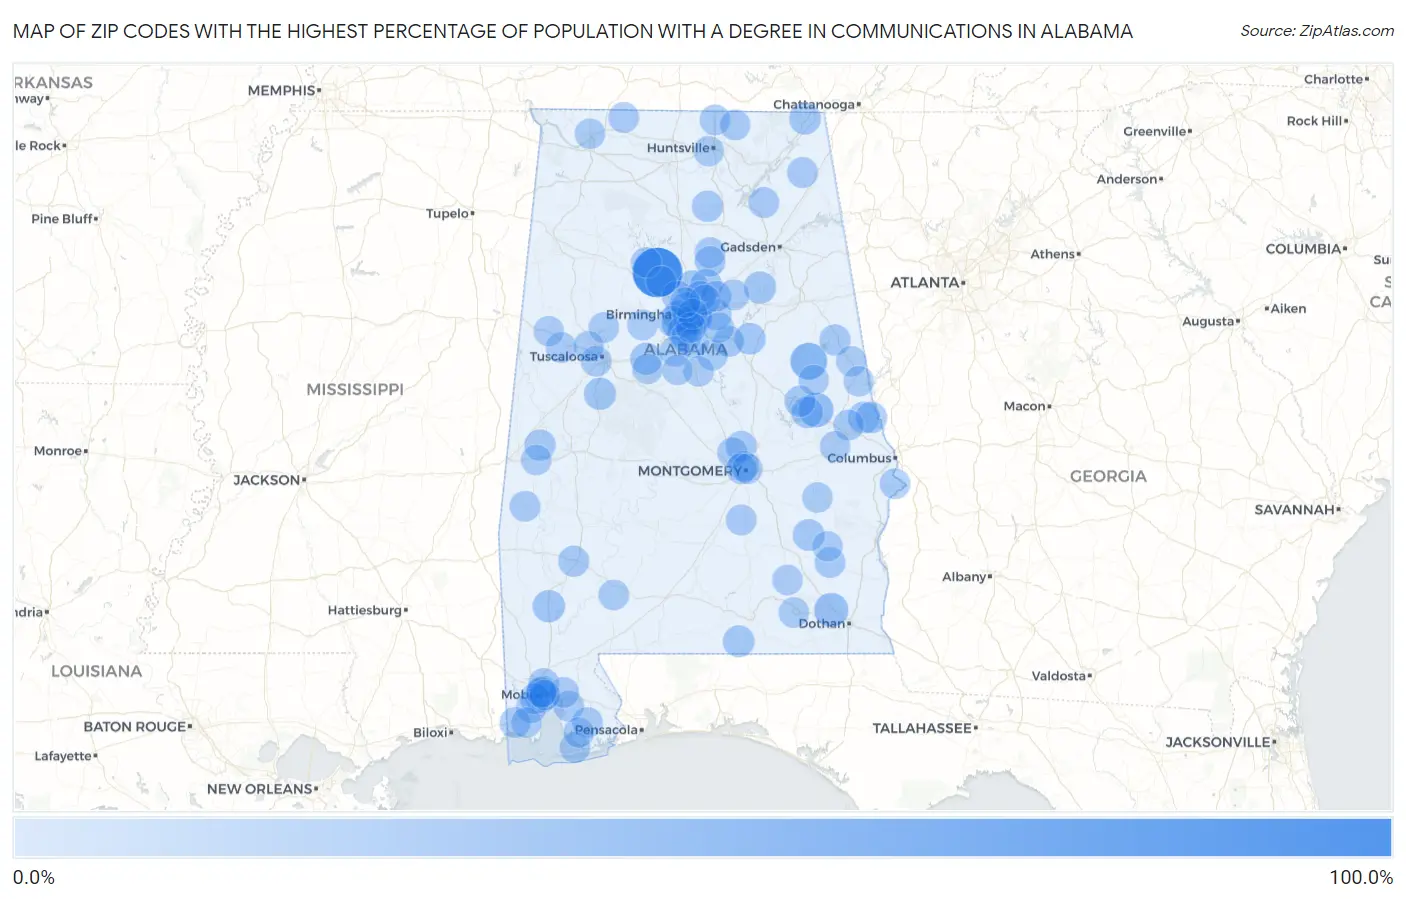
Zip Codes with the Highest Percentage of Population with a Degree in Communications in Alabama
| Zip Code | % Graduates | vs State | vs National | |
| 1. | 35584 | 100.0% | 3.2%(+96.8)#1 | 4.1%(+95.9)#9 |
| 2. | 36255 | 35.2% | 3.2%(+32.1)#2 | 4.1%(+31.1)#109 |
| 3. | 36850 | 24.6% | 3.2%(+21.4)#3 | 4.1%(+20.4)#225 |
| 4. | 36371 | 22.2% | 3.2%(+19.1)#4 | 4.1%(+18.1)#266 |
| 5. | 36585 | 13.5% | 3.2%(+10.3)#5 | 4.1%(+9.38)#655 |
| 6. | 35131 | 12.7% | 3.2%(+9.56)#6 | 4.1%(+8.60)#732 |
| 7. | 35474 | 12.6% | 3.2%(+9.42)#7 | 4.1%(+8.45)#753 |
| 8. | 35188 | 12.0% | 3.2%(+8.85)#8 | 4.1%(+7.89)#818 |
| 9. | 35126 | 11.1% | 3.2%(+7.96)#9 | 4.1%(+7.00)#947 |
| 10. | 35116 | 10.8% | 3.2%(+7.64)#10 | 4.1%(+6.68)#1,006 |
| 11. | 36005 | 10.7% | 3.2%(+7.56)#11 | 4.1%(+6.60)#1,016 |
| 12. | 36852 | 10.6% | 3.2%(+7.39)#12 | 4.1%(+6.42)#1,049 |
| 13. | 36442 | 10.5% | 3.2%(+7.38)#13 | 4.1%(+6.41)#1,052 |
| 14. | 35740 | 10.4% | 3.2%(+7.21)#14 | 4.1%(+6.25)#1,077 |
| 15. | 36854 | 9.6% | 3.2%(+6.46)#15 | 4.1%(+5.50)#1,229 |
| 16. | 35014 | 9.6% | 3.2%(+6.41)#16 | 4.1%(+5.45)#1,247 |
| 17. | 36853 | 9.0% | 3.2%(+5.85)#17 | 4.1%(+4.89)#1,426 |
| 18. | 35218 | 8.7% | 3.2%(+5.48)#18 | 4.1%(+4.52)#1,571 |
| 19. | 36861 | 8.6% | 3.2%(+5.43)#19 | 4.1%(+4.46)#1,590 |
| 20. | 36606 | 8.6% | 3.2%(+5.41)#20 | 4.1%(+4.45)#1,602 |
| 21. | 35019 | 8.5% | 3.2%(+5.33)#21 | 4.1%(+4.36)#1,630 |
| 22. | 35221 | 8.1% | 3.2%(+4.97)#22 | 4.1%(+4.01)#1,798 |
| 23. | 35470 | 8.1% | 3.2%(+4.88)#23 | 4.1%(+3.92)#1,848 |
| 24. | 35223 | 8.0% | 3.2%(+4.88)#24 | 4.1%(+3.91)#1,852 |
| 25. | 36278 | 7.8% | 3.2%(+4.67)#25 | 4.1%(+3.71)#1,969 |
| 26. | 35078 | 7.6% | 3.2%(+4.44)#26 | 4.1%(+3.48)#2,124 |
| 27. | 35205 | 7.4% | 3.2%(+4.25)#27 | 4.1%(+3.29)#2,250 |
| 28. | 35117 | 7.3% | 3.2%(+4.08)#28 | 4.1%(+3.12)#2,391 |
| 29. | 36617 | 7.2% | 3.2%(+4.03)#29 | 4.1%(+3.07)#2,431 |
| 30. | 36451 | 7.2% | 3.2%(+4.02)#30 | 4.1%(+3.05)#2,443 |
| 31. | 36611 | 7.1% | 3.2%(+3.89)#31 | 4.1%(+2.93)#2,544 |
| 32. | 35213 | 7.0% | 3.2%(+3.86)#32 | 4.1%(+2.89)#2,584 |
| 33. | 35209 | 6.4% | 3.2%(+3.20)#33 | 4.1%(+2.23)#3,288 |
| 34. | 35951 | 6.4% | 3.2%(+3.20)#34 | 4.1%(+2.23)#3,289 |
| 35. | 36619 | 6.0% | 3.2%(+2.87)#35 | 4.1%(+1.91)#3,713 |
| 36. | 35051 | 6.0% | 3.2%(+2.86)#36 | 4.1%(+1.90)#3,720 |
| 37. | 35401 | 6.0% | 3.2%(+2.80)#37 | 4.1%(+1.84)#3,819 |
| 38. | 36046 | 6.0% | 3.2%(+2.80)#38 | 4.1%(+1.84)#3,825 |
| 39. | 36609 | 6.0% | 3.2%(+2.78)#39 | 4.1%(+1.82)#3,848 |
| 40. | 35988 | 5.9% | 3.2%(+2.77)#40 | 4.1%(+1.80)#3,880 |
| 41. | 36904 | 5.9% | 3.2%(+2.76)#41 | 4.1%(+1.80)#3,886 |
| 42. | 35094 | 5.9% | 3.2%(+2.69)#42 | 4.1%(+1.72)#4,020 |
| 43. | 36580 | 5.8% | 3.2%(+2.66)#43 | 4.1%(+1.70)#4,058 |
| 44. | 36526 | 5.7% | 3.2%(+2.57)#44 | 4.1%(+1.61)#4,190 |
| 45. | 36017 | 5.7% | 3.2%(+2.57)#45 | 4.1%(+1.61)#4,194 |
| 46. | 36025 | 5.7% | 3.2%(+2.56)#46 | 4.1%(+1.60)#4,200 |
| 47. | 35120 | 5.7% | 3.2%(+2.56)#47 | 4.1%(+1.60)#4,202 |
| 48. | 35226 | 5.7% | 3.2%(+2.55)#48 | 4.1%(+1.59)#4,214 |
| 49. | 36542 | 5.7% | 3.2%(+2.55)#49 | 4.1%(+1.59)#4,222 |
| 50. | 35215 | 5.7% | 3.2%(+2.53)#50 | 4.1%(+1.57)#4,267 |
| 51. | 35173 | 5.7% | 3.2%(+2.50)#51 | 4.1%(+1.54)#4,321 |
| 52. | 36527 | 5.6% | 3.2%(+2.46)#52 | 4.1%(+1.49)#4,394 |
| 53. | 36801 | 5.6% | 3.2%(+2.44)#53 | 4.1%(+1.47)#4,431 |
| 54. | 35750 | 5.6% | 3.2%(+2.43)#54 | 4.1%(+1.47)#4,447 |
| 55. | 35648 | 5.6% | 3.2%(+2.41)#55 | 4.1%(+1.45)#4,487 |
| 56. | 36541 | 5.6% | 3.2%(+2.41)#56 | 4.1%(+1.44)#4,491 |
| 57. | 35466 | 5.5% | 3.2%(+2.34)#57 | 4.1%(+1.38)#4,618 |
| 58. | 35207 | 5.4% | 3.2%(+2.22)#58 | 4.1%(+1.26)#4,857 |
| 59. | 36445 | 5.4% | 3.2%(+2.19)#59 | 4.1%(+1.22)#4,927 |
| 60. | 35049 | 5.4% | 3.2%(+2.19)#60 | 4.1%(+1.22)#4,928 |
| 61. | 36104 | 5.3% | 3.2%(+2.17)#61 | 4.1%(+1.20)#4,960 |
| 62. | 35061 | 5.3% | 3.2%(+2.16)#62 | 4.1%(+1.20)#4,964 |
| 63. | 35504 | 5.3% | 3.2%(+2.13)#63 | 4.1%(+1.17)#5,042 |
| 64. | 35124 | 5.3% | 3.2%(+2.08)#64 | 4.1%(+1.12)#5,130 |
| 65. | 35761 | 5.2% | 3.2%(+2.07)#65 | 4.1%(+1.11)#5,159 |
| 66. | 35235 | 5.2% | 3.2%(+2.06)#66 | 4.1%(+1.10)#5,167 |
| 67. | 35097 | 5.2% | 3.2%(+2.06)#67 | 4.1%(+1.10)#5,178 |
| 68. | 36604 | 5.2% | 3.2%(+2.03)#68 | 4.1%(+1.07)#5,241 |
| 69. | 35244 | 5.2% | 3.2%(+2.00)#69 | 4.1%(+1.03)#5,315 |
| 70. | 35040 | 5.1% | 3.2%(+1.92)#70 | 4.1%(+0.959)#5,475 |
| 71. | 35475 | 5.1% | 3.2%(+1.89)#71 | 4.1%(+0.926)#5,551 |
| 72. | 36066 | 5.0% | 3.2%(+1.84)#72 | 4.1%(+0.874)#5,666 |
| 73. | 35184 | 4.9% | 3.2%(+1.72)#73 | 4.1%(+0.752)#5,954 |
| 74. | 35006 | 4.9% | 3.2%(+1.71)#74 | 4.1%(+0.743)#5,972 |
| 75. | 35452 | 4.9% | 3.2%(+1.69)#75 | 4.1%(+0.728)#6,027 |
| 76. | 35147 | 4.9% | 3.2%(+1.68)#76 | 4.1%(+0.721)#6,052 |
| 77. | 35080 | 4.9% | 3.2%(+1.68)#77 | 4.1%(+0.721)#6,055 |
| 78. | 35222 | 4.8% | 3.2%(+1.64)#78 | 4.1%(+0.681)#6,143 |
| 79. | 35148 | 4.8% | 3.2%(+1.64)#79 | 4.1%(+0.678)#6,156 |
| 80. | 36925 | 4.8% | 3.2%(+1.64)#80 | 4.1%(+0.675)#6,161 |
| 81. | 36607 | 4.7% | 3.2%(+1.53)#81 | 4.1%(+0.566)#6,405 |
| 82. | 36346 | 4.7% | 3.2%(+1.53)#82 | 4.1%(+0.563)#6,412 |
| 83. | 36330 | 4.7% | 3.2%(+1.50)#83 | 4.1%(+0.536)#6,489 |
| 84. | 36274 | 4.7% | 3.2%(+1.50)#84 | 4.1%(+0.533)#6,499 |
| 85. | 36089 | 4.6% | 3.2%(+1.47)#85 | 4.1%(+0.512)#6,559 |
| 86. | 35216 | 4.6% | 3.2%(+1.43)#86 | 4.1%(+0.470)#6,672 |
| 87. | 36555 | 4.6% | 3.2%(+1.42)#87 | 4.1%(+0.461)#6,706 |
| 88. | 36113 | 4.6% | 3.2%(+1.40)#88 | 4.1%(+0.440)#6,759 |
| 89. | 35630 | 4.5% | 3.2%(+1.29)#89 | 4.1%(+0.324)#7,069 |
| 90. | 35481 | 4.4% | 3.2%(+1.26)#90 | 4.1%(+0.298)#7,152 |
| 91. | 35115 | 4.4% | 3.2%(+1.26)#91 | 4.1%(+0.296)#7,161 |
| 92. | 36856 | 4.4% | 3.2%(+1.24)#92 | 4.1%(+0.275)#7,228 |
| 93. | 35068 | 4.4% | 3.2%(+1.23)#93 | 4.1%(+0.263)#7,256 |
| 94. | 36107 | 4.3% | 3.2%(+1.13)#94 | 4.1%(+0.169)#7,580 |
| 95. | 36855 | 4.3% | 3.2%(+1.08)#95 | 4.1%(+0.120)#7,710 |
| 96. | 36048 | 4.3% | 3.2%(+1.08)#96 | 4.1%(+0.120)#7,711 |
| 97. | 36830 | 4.3% | 3.2%(+1.08)#97 | 4.1%(+0.115)#7,731 |
| 98. | 36256 | 4.2% | 3.2%(+1.04)#98 | 4.1%(+0.082)#7,845 |
| 99. | 36544 | 4.2% | 3.2%(+1.01)#99 | 4.1%(+0.049)#7,939 |
| 100. | 35805 | 4.2% | 3.2%(+0.998)#100 | 4.1%(+0.035)#7,978 |
Common Questions
What are the Top 10 Zip Codes with the Highest Percentage of Population with a Degree in Communications in Alabama?
Top 10 Zip Codes with the Highest Percentage of Population with a Degree in Communications in Alabama are:
What zip code has the Highest Percentage of Population with a Degree in Communications in Alabama?
35584 has the Highest Percentage of Population with a Degree in Communications in Alabama with 100.0%.
What is the Percentage of Population with a Degree in Communications in the State of Alabama?
Percentage of Population with a Degree in Communications in Alabama is 3.2%.
What is the Percentage of Population with a Degree in Communications in the United States?
Percentage of Population with a Degree in Communications in the United States is 4.1%.