Zip Codes with the Highest Percentage of Population with a Degree in Communications in Puerto Rico
RELATED REPORTS & OPTIONS
Communications
Puerto Rico
Compare Zip Codes
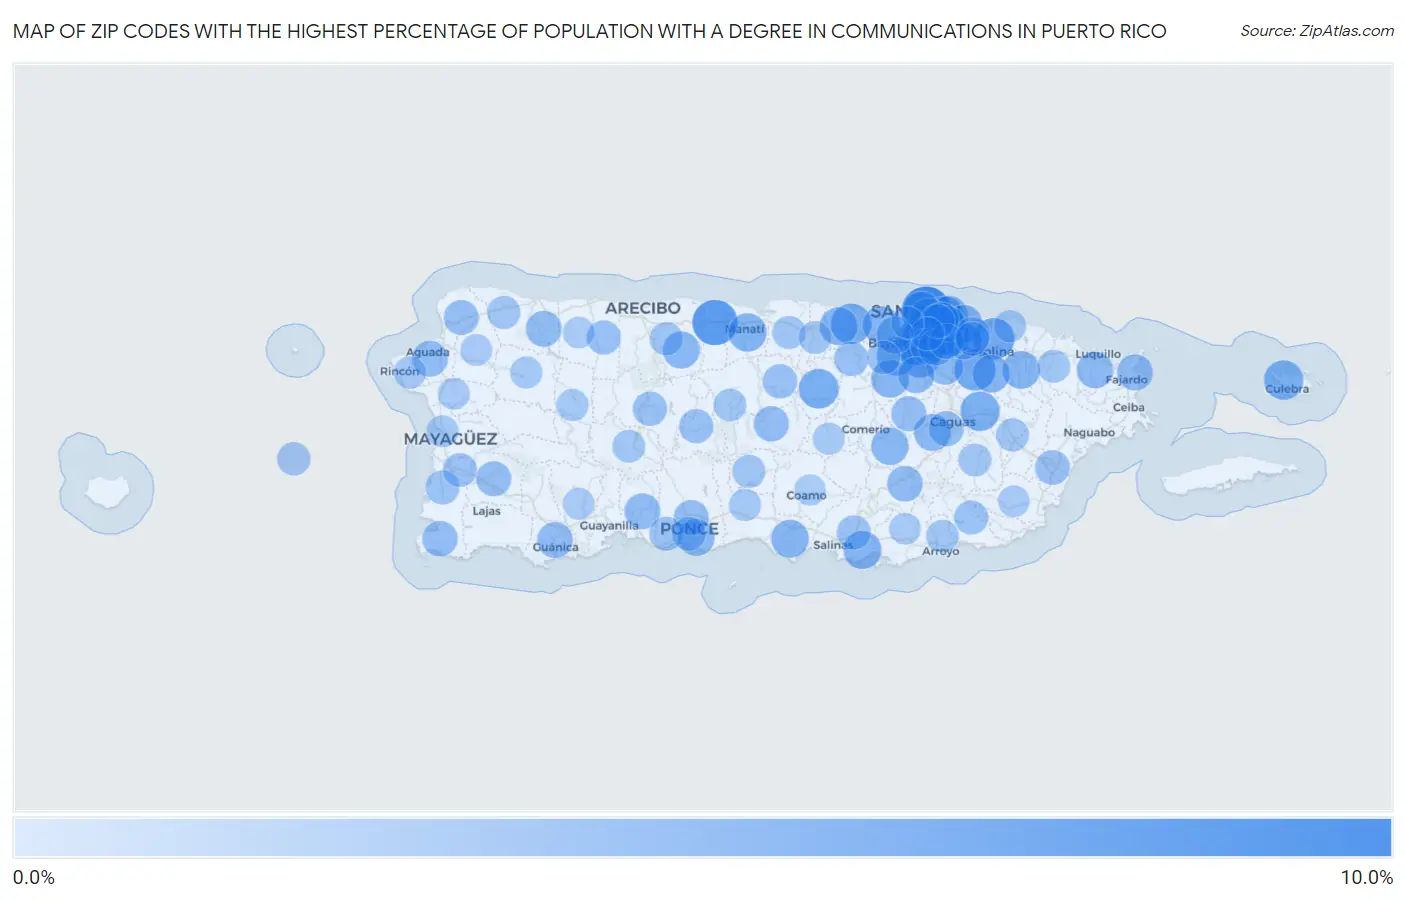
Map of Zip Codes with the Highest Percentage of Population with a Degree in Communications in Puerto Rico
0.0%
10.0%
Zip Codes with the Highest Percentage of Population with a Degree in Communications in Puerto Rico
| Zip Code | % Graduates | vs State | vs National | |
| 1. | 00906 | 8.1% | 2.2%(+5.92)#1 | 4.1%(+3.95)#1,835 |
| 2. | 00617 | 6.2% | 2.2%(+4.09)#2 | 4.1%(+2.11)#3,435 |
| 3. | 00966 | 6.1% | 2.2%(+3.89)#3 | 4.1%(+1.92)#3,704 |
| 4. | 00917 | 5.8% | 2.2%(+3.64)#4 | 4.1%(+1.66)#4,125 |
| 5. | 00985 | 4.7% | 2.2%(+2.51)#5 | 4.1%(+0.536)#6,491 |
| 6. | 00968 | 4.6% | 2.2%(+2.47)#6 | 4.1%(+0.488)#6,628 |
| 7. | 00976 | 4.4% | 2.2%(+2.28)#7 | 4.1%(+0.300)#7,143 |
| 8. | 00918 | 4.4% | 2.2%(+2.27)#8 | 4.1%(+0.295)#7,166 |
| 9. | 00951 | 4.3% | 2.2%(+2.10)#9 | 4.1%(+0.120)#7,716 |
| 10. | 00911 | 4.0% | 2.2%(+1.82)#10 | 4.1%(-0.163)#8,670 |
| 11. | 00783 | 3.9% | 2.2%(+1.75)#11 | 4.1%(-0.233)#8,896 |
| 12. | 00775 | 3.8% | 2.2%(+1.63)#12 | 4.1%(-0.347)#9,327 |
| 13. | 00778 | 3.8% | 2.2%(+1.63)#13 | 4.1%(-0.352)#9,341 |
| 14. | 00923 | 3.7% | 2.2%(+1.59)#14 | 4.1%(-0.386)#9,464 |
| 15. | 00959 | 3.5% | 2.2%(+1.33)#15 | 4.1%(-0.648)#10,376 |
| 16. | 00674 | 3.3% | 2.2%(+1.14)#16 | 4.1%(-0.839)#11,079 |
| 17. | 00913 | 3.3% | 2.2%(+1.12)#17 | 4.1%(-0.855)#11,130 |
| 18. | 00907 | 3.3% | 2.2%(+1.11)#18 | 4.1%(-0.866)#11,182 |
| 19. | 00646 | 3.2% | 2.2%(+1.04)#19 | 4.1%(-0.943)#11,489 |
| 20. | 00704 | 3.2% | 2.2%(+1.03)#20 | 4.1%(-0.947)#11,513 |
| 21. | 00969 | 3.1% | 2.2%(+0.962)#21 | 4.1%(-1.02)#11,769 |
| 22. | 00956 | 3.1% | 2.2%(+0.918)#22 | 4.1%(-1.06)#11,917 |
| 23. | 00757 | 3.1% | 2.2%(+0.894)#23 | 4.1%(-1.08)#12,007 |
| 24. | 00729 | 3.0% | 2.2%(+0.873)#24 | 4.1%(-1.11)#12,096 |
| 25. | 00949 | 3.0% | 2.2%(+0.853)#25 | 4.1%(-1.13)#12,155 |
| 26. | 00979 | 3.0% | 2.2%(+0.845)#26 | 4.1%(-1.13)#12,181 |
| 27. | 00987 | 3.0% | 2.2%(+0.833)#27 | 4.1%(-1.15)#12,231 |
| 28. | 00739 | 2.9% | 2.2%(+0.711)#28 | 4.1%(-1.27)#12,742 |
| 29. | 00688 | 2.8% | 2.2%(+0.687)#29 | 4.1%(-1.29)#12,831 |
| 30. | 00961 | 2.8% | 2.2%(+0.670)#30 | 4.1%(-1.31)#12,889 |
| 31. | 00727 | 2.8% | 2.2%(+0.611)#31 | 4.1%(-1.37)#13,128 |
| 32. | 00926 | 2.7% | 2.2%(+0.550)#32 | 4.1%(-1.43)#13,376 |
| 33. | 00901 | 2.7% | 2.2%(+0.503)#33 | 4.1%(-1.48)#13,569 |
| 34. | 00716 | 2.6% | 2.2%(+0.491)#34 | 4.1%(-1.49)#13,604 |
| 35. | 00921 | 2.6% | 2.2%(+0.438)#35 | 4.1%(-1.54)#13,804 |
| 36. | 00773 | 2.5% | 2.2%(+0.368)#36 | 4.1%(-1.61)#14,061 |
| 37. | 00924 | 2.5% | 2.2%(+0.326)#37 | 4.1%(-1.65)#14,203 |
| 38. | 00971 | 2.4% | 2.2%(+0.243)#38 | 4.1%(-1.74)#14,493 |
| 39. | 00927 | 2.4% | 2.2%(+0.217)#39 | 4.1%(-1.76)#14,573 |
| 40. | 00738 | 2.3% | 2.2%(+0.169)#40 | 4.1%(-1.81)#14,732 |
| 41. | 00624 | 2.3% | 2.2%(+0.148)#41 | 4.1%(-1.83)#14,825 |
| 42. | 00678 | 2.3% | 2.2%(+0.143)#42 | 4.1%(-1.84)#14,845 |
| 43. | 00653 | 2.3% | 2.2%(+0.139)#43 | 4.1%(-1.84)#14,855 |
| 44. | 00602 | 2.3% | 2.2%(+0.127)#44 | 4.1%(-1.85)#14,894 |
| 45. | 00915 | 2.2% | 2.2%(+0.043)#45 | 4.1%(-1.94)#15,183 |
| 46. | 00736 | 2.2% | 2.2%(+0.035)#46 | 4.1%(-1.94)#15,218 |
| 47. | 00983 | 2.1% | 2.2%(-0.043)#47 | 4.1%(-2.02)#15,475 |
| 48. | 00912 | 2.1% | 2.2%(-0.050)#48 | 4.1%(-2.03)#15,494 |
| 49. | 00720 | 2.1% | 2.2%(-0.071)#49 | 4.1%(-2.05)#15,578 |
| 50. | 00622 | 2.1% | 2.2%(-0.077)#50 | 4.1%(-2.06)#15,598 |
| 51. | 00925 | 2.1% | 2.2%(-0.090)#51 | 4.1%(-2.07)#15,640 |
| 52. | 00725 | 2.0% | 2.2%(-0.168)#52 | 4.1%(-2.15)#15,935 |
| 53. | 00683 | 2.0% | 2.2%(-0.182)#53 | 4.1%(-2.16)#15,987 |
| 54. | 00730 | 1.9% | 2.2%(-0.219)#54 | 4.1%(-2.20)#16,118 |
| 55. | 00703 | 1.9% | 2.2%(-0.220)#55 | 4.1%(-2.20)#16,122 |
| 56. | 00603 | 1.9% | 2.2%(-0.267)#56 | 4.1%(-2.25)#16,269 |
| 57. | 00791 | 1.8% | 2.2%(-0.323)#57 | 4.1%(-2.30)#16,459 |
| 58. | 00687 | 1.7% | 2.2%(-0.486)#58 | 4.1%(-2.46)#16,969 |
| 59. | 00953 | 1.7% | 2.2%(-0.491)#59 | 4.1%(-2.47)#16,986 |
| 60. | 00909 | 1.7% | 2.2%(-0.494)#60 | 4.1%(-2.47)#16,996 |
| 61. | 00641 | 1.7% | 2.2%(-0.503)#61 | 4.1%(-2.48)#17,018 |
| 62. | 00664 | 1.6% | 2.2%(-0.559)#62 | 4.1%(-2.54)#17,217 |
| 63. | 00659 | 1.6% | 2.2%(-0.565)#63 | 4.1%(-2.54)#17,234 |
| 64. | 00751 | 1.5% | 2.2%(-0.619)#64 | 4.1%(-2.60)#17,406 |
| 65. | 00728 | 1.5% | 2.2%(-0.646)#65 | 4.1%(-2.62)#17,475 |
| 66. | 00717 | 1.5% | 2.2%(-0.652)#66 | 4.1%(-2.63)#17,487 |
| 67. | 00723 | 1.5% | 2.2%(-0.663)#67 | 4.1%(-2.64)#17,528 |
| 68. | 00623 | 1.5% | 2.2%(-0.676)#68 | 4.1%(-2.65)#17,590 |
| 69. | 00660 | 1.4% | 2.2%(-0.717)#69 | 4.1%(-2.70)#17,702 |
| 70. | 00982 | 1.4% | 2.2%(-0.731)#70 | 4.1%(-2.71)#17,755 |
| 71. | 00920 | 1.4% | 2.2%(-0.784)#71 | 4.1%(-2.76)#17,896 |
| 72. | 00957 | 1.4% | 2.2%(-0.803)#72 | 4.1%(-2.78)#17,963 |
| 73. | 00680 | 1.2% | 2.2%(-0.911)#73 | 4.1%(-2.89)#18,249 |
| 74. | 00612 | 1.2% | 2.2%(-0.940)#74 | 4.1%(-2.92)#18,338 |
| 75. | 00662 | 1.2% | 2.2%(-0.973)#75 | 4.1%(-2.95)#18,451 |
| 76. | 00693 | 1.1% | 2.2%(-1.04)#76 | 4.1%(-3.02)#18,655 |
| 77. | 00766 | 1.1% | 2.2%(-1.06)#77 | 4.1%(-3.04)#18,694 |
| 78. | 00777 | 1.1% | 2.2%(-1.07)#78 | 4.1%(-3.05)#18,716 |
| 79. | 00745 | 1.1% | 2.2%(-1.09)#79 | 4.1%(-3.07)#18,809 |
| 80. | 00754 | 1.1% | 2.2%(-1.09)#80 | 4.1%(-3.07)#18,812 |
| 81. | 00601 | 1.0% | 2.2%(-1.12)#81 | 4.1%(-3.09)#18,871 |
| 82. | 00692 | 1.0% | 2.2%(-1.14)#82 | 4.1%(-3.12)#18,937 |
| 83. | 00714 | 0.99% | 2.2%(-1.16)#83 | 4.1%(-3.14)#19,005 |
| 84. | 00638 | 0.97% | 2.2%(-1.19)#84 | 4.1%(-3.17)#19,084 |
| 85. | 00962 | 0.95% | 2.2%(-1.21)#85 | 4.1%(-3.19)#19,125 |
| 86. | 00677 | 0.80% | 2.2%(-1.35)#86 | 4.1%(-3.33)#19,483 |
| 87. | 00772 | 0.79% | 2.2%(-1.37)#87 | 4.1%(-3.35)#19,518 |
| 88. | 00795 | 0.76% | 2.2%(-1.40)#88 | 4.1%(-3.38)#19,592 |
| 89. | 00669 | 0.73% | 2.2%(-1.42)#89 | 4.1%(-3.40)#19,668 |
| 90. | 00794 | 0.70% | 2.2%(-1.45)#90 | 4.1%(-3.43)#19,732 |
| 91. | 00685 | 0.69% | 2.2%(-1.47)#91 | 4.1%(-3.44)#19,768 |
| 92. | 00682 | 0.64% | 2.2%(-1.52)#92 | 4.1%(-3.50)#19,870 |
| 93. | 00610 | 0.60% | 2.2%(-1.55)#93 | 4.1%(-3.53)#19,933 |
| 94. | 00698 | 0.58% | 2.2%(-1.58)#94 | 4.1%(-3.56)#19,982 |
| 95. | 00676 | 0.54% | 2.2%(-1.62)#95 | 4.1%(-3.60)#20,056 |
| 96. | 00784 | 0.53% | 2.2%(-1.62)#96 | 4.1%(-3.60)#20,061 |
| 97. | 00627 | 0.52% | 2.2%(-1.64)#97 | 4.1%(-3.62)#20,088 |
| 98. | 00767 | 0.48% | 2.2%(-1.68)#98 | 4.1%(-3.65)#20,170 |
| 99. | 00769 | 0.40% | 2.2%(-1.76)#99 | 4.1%(-3.73)#20,295 |
1
2Common Questions
What are the Top 10 Zip Codes with the Highest Percentage of Population with a Degree in Communications in Puerto Rico?
Top 10 Zip Codes with the Highest Percentage of Population with a Degree in Communications in Puerto Rico are:
What zip code has the Highest Percentage of Population with a Degree in Communications in Puerto Rico?
00906 has the Highest Percentage of Population with a Degree in Communications in Puerto Rico with 8.1%.
What is the Percentage of Population with a Degree in Communications in the State of Puerto Rico?
Percentage of Population with a Degree in Communications in Puerto Rico is 2.2%.
What is the Percentage of Population with a Degree in Communications in the United States?
Percentage of Population with a Degree in Communications in the United States is 4.1%.