Zip Codes with the Highest Percentage of Population with a Degree in Communications in Arkansas
RELATED REPORTS & OPTIONS
Communications
Arkansas
Compare Zip Codes
Map of Zip Codes with the Highest Percentage of Population with a Degree in Communications in Arkansas
0.0%
50.0%
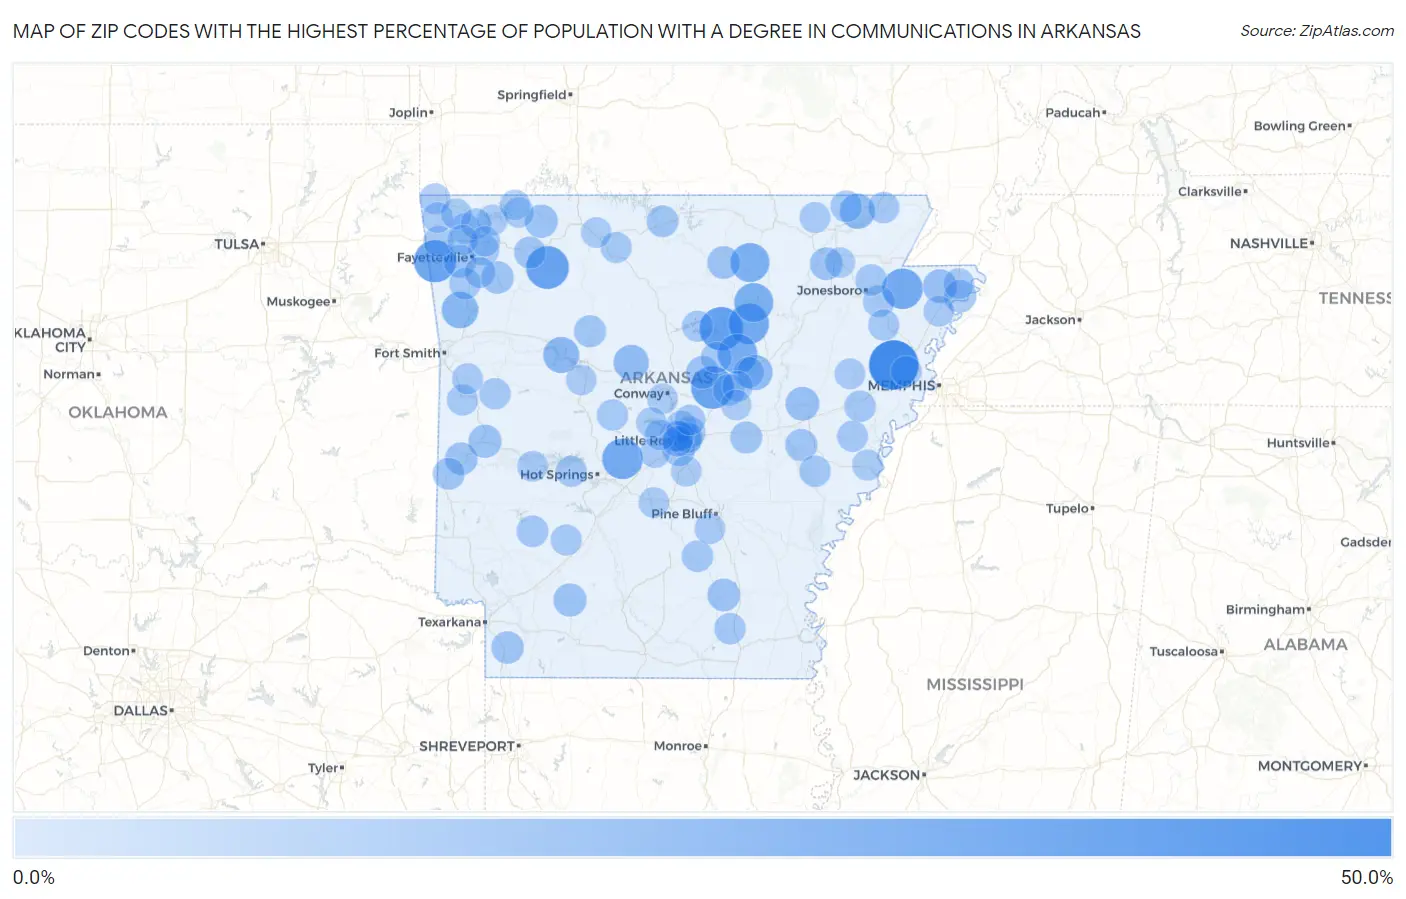
Zip Codes with the Highest Percentage of Population with a Degree in Communications in Arkansas
| Zip Code | % Graduates | vs State | vs National | |
| 1. | 72331 | 46.1% | 3.3%(+42.8)#1 | 4.1%(+42.0)#63 |
| 2. | 72581 | 32.3% | 3.3%(+29.1)#2 | 4.1%(+28.2)#138 |
| 3. | 72742 | 31.0% | 3.3%(+27.7)#3 | 4.1%(+26.8)#148 |
| 4. | 72045 | 30.4% | 3.3%(+27.2)#4 | 4.1%(+26.3)#150 |
| 5. | 72769 | 29.7% | 3.3%(+26.4)#5 | 4.1%(+25.6)#158 |
| 6. | 72414 | 26.2% | 3.3%(+22.9)#6 | 4.1%(+22.0)#195 |
| 7. | 72087 | 26.1% | 3.3%(+22.9)#7 | 4.1%(+22.0)#196 |
| 8. | 72534 | 26.0% | 3.3%(+22.8)#8 | 4.1%(+21.9)#197 |
| 9. | 72085 | 24.0% | 3.3%(+20.7)#9 | 4.1%(+19.9)#234 |
| 10. | 72527 | 22.7% | 3.3%(+19.4)#10 | 4.1%(+18.5)#255 |
| 11. | 72577 | 22.6% | 3.3%(+19.3)#11 | 4.1%(+18.4)#256 |
| 12. | 72934 | 17.1% | 3.3%(+13.9)#12 | 4.1%(+13.0)#436 |
| 13. | 72845 | 16.1% | 3.3%(+12.8)#13 | 4.1%(+12.0)#491 |
| 14. | 72063 | 14.4% | 3.3%(+11.2)#14 | 4.1%(+10.3)#590 |
| 15. | 72082 | 14.3% | 3.3%(+11.0)#15 | 4.1%(+10.2)#594 |
| 16. | 72462 | 14.3% | 3.3%(+11.0)#16 | 4.1%(+10.2)#601 |
| 17. | 72426 | 11.6% | 3.3%(+8.36)#17 | 4.1%(+7.49)#874 |
| 18. | 72036 | 11.1% | 3.3%(+7.85)#18 | 4.1%(+6.98)#958 |
| 19. | 72616 | 10.0% | 3.3%(+6.70)#19 | 4.1%(+5.83)#1,159 |
| 20. | 71858 | 9.9% | 3.3%(+6.63)#20 | 4.1%(+5.76)#1,171 |
| 21. | 72926 | 9.9% | 3.3%(+6.59)#21 | 4.1%(+5.72)#1,184 |
| 22. | 72730 | 9.1% | 3.3%(+5.88)#22 | 4.1%(+5.01)#1,377 |
| 23. | 72111 | 9.1% | 3.3%(+5.88)#23 | 4.1%(+5.01)#1,378 |
| 24. | 72556 | 9.0% | 3.3%(+5.71)#24 | 4.1%(+4.84)#1,443 |
| 25. | 72201 | 8.9% | 3.3%(+5.68)#25 | 4.1%(+4.81)#1,455 |
| 26. | 72433 | 8.7% | 3.3%(+5.47)#26 | 4.1%(+4.60)#1,527 |
| 27. | 71953 | 8.7% | 3.3%(+5.44)#27 | 4.1%(+4.57)#1,545 |
| 28. | 71675 | 8.7% | 3.3%(+5.41)#28 | 4.1%(+4.54)#1,567 |
| 29. | 72727 | 8.6% | 3.3%(+5.35)#29 | 4.1%(+4.48)#1,584 |
| 30. | 71837 | 8.4% | 3.3%(+5.15)#30 | 4.1%(+4.28)#1,674 |
| 31. | 72358 | 8.3% | 3.3%(+5.07)#31 | 4.1%(+4.20)#1,704 |
| 32. | 72209 | 7.9% | 3.3%(+4.68)#32 | 4.1%(+3.81)#1,914 |
| 33. | 72029 | 7.8% | 3.3%(+4.58)#33 | 4.1%(+3.71)#1,970 |
| 34. | 72024 | 7.3% | 3.3%(+4.01)#34 | 4.1%(+3.14)#2,363 |
| 35. | 72837 | 7.1% | 3.3%(+3.87)#35 | 4.1%(+3.00)#2,497 |
| 36. | 72740 | 7.0% | 3.3%(+3.70)#36 | 4.1%(+2.83)#2,642 |
| 37. | 71945 | 6.9% | 3.3%(+3.66)#37 | 4.1%(+2.79)#2,681 |
| 38. | 72635 | 6.9% | 3.3%(+3.66)#38 | 4.1%(+2.79)#2,684 |
| 39. | 72012 | 6.8% | 3.3%(+3.55)#39 | 4.1%(+2.68)#2,783 |
| 40. | 71958 | 6.7% | 3.3%(+3.45)#40 | 4.1%(+2.58)#2,896 |
| 41. | 72411 | 6.7% | 3.3%(+3.40)#41 | 4.1%(+2.53)#2,941 |
| 42. | 71665 | 6.4% | 3.3%(+3.14)#42 | 4.1%(+2.26)#3,243 |
| 43. | 72444 | 6.3% | 3.3%(+3.02)#43 | 4.1%(+2.15)#3,388 |
| 44. | 72335 | 6.2% | 3.3%(+2.91)#44 | 4.1%(+2.04)#3,509 |
| 45. | 72774 | 6.2% | 3.3%(+2.91)#45 | 4.1%(+2.04)#3,515 |
| 46. | 72405 | 6.2% | 3.3%(+2.90)#46 | 4.1%(+2.03)#3,535 |
| 47. | 72069 | 6.1% | 3.3%(+2.88)#47 | 4.1%(+2.01)#3,564 |
| 48. | 71642 | 6.1% | 3.3%(+2.86)#48 | 4.1%(+1.99)#3,591 |
| 49. | 72126 | 5.9% | 3.3%(+2.62)#49 | 4.1%(+1.75)#3,963 |
| 50. | 72927 | 5.9% | 3.3%(+2.61)#50 | 4.1%(+1.74)#3,996 |
| 51. | 72422 | 5.9% | 3.3%(+2.60)#51 | 4.1%(+1.73)#4,018 |
| 52. | 71968 | 5.8% | 3.3%(+2.50)#52 | 4.1%(+1.63)#4,167 |
| 53. | 72227 | 5.6% | 3.3%(+2.37)#53 | 4.1%(+1.50)#4,385 |
| 54. | 72116 | 5.6% | 3.3%(+2.36)#54 | 4.1%(+1.49)#4,395 |
| 55. | 72944 | 5.6% | 3.3%(+2.35)#55 | 4.1%(+1.48)#4,426 |
| 56. | 72472 | 5.4% | 3.3%(+2.17)#56 | 4.1%(+1.30)#4,781 |
| 57. | 72703 | 5.4% | 3.3%(+2.11)#57 | 4.1%(+1.24)#4,898 |
| 58. | 72360 | 5.3% | 3.3%(+2.02)#58 | 4.1%(+1.15)#5,064 |
| 59. | 72701 | 5.3% | 3.3%(+2.00)#59 | 4.1%(+1.13)#5,103 |
| 60. | 72633 | 5.3% | 3.3%(+2.00)#60 | 4.1%(+1.13)#5,107 |
| 61. | 72143 | 5.2% | 3.3%(+1.98)#61 | 4.1%(+1.11)#5,148 |
| 62. | 72067 | 5.2% | 3.3%(+1.97)#62 | 4.1%(+1.10)#5,172 |
| 63. | 72118 | 5.2% | 3.3%(+1.95)#63 | 4.1%(+1.08)#5,219 |
| 64. | 71962 | 5.2% | 3.3%(+1.93)#64 | 4.1%(+1.06)#5,268 |
| 65. | 72137 | 5.2% | 3.3%(+1.90)#65 | 4.1%(+1.03)#5,321 |
| 66. | 72936 | 5.2% | 3.3%(+1.90)#66 | 4.1%(+1.03)#5,328 |
| 67. | 72114 | 5.2% | 3.3%(+1.89)#67 | 4.1%(+1.02)#5,344 |
| 68. | 72390 | 5.1% | 3.3%(+1.84)#68 | 4.1%(+0.973)#5,444 |
| 69. | 72207 | 5.0% | 3.3%(+1.78)#69 | 4.1%(+0.906)#5,598 |
| 70. | 72768 | 4.9% | 3.3%(+1.67)#70 | 4.1%(+0.803)#5,837 |
| 71. | 72315 | 4.8% | 3.3%(+1.52)#71 | 4.1%(+0.652)#6,204 |
| 72. | 72718 | 4.8% | 3.3%(+1.52)#72 | 4.1%(+0.645)#6,225 |
| 73. | 72460 | 4.8% | 3.3%(+1.50)#73 | 4.1%(+0.627)#6,276 |
| 74. | 72002 | 4.6% | 3.3%(+1.34)#74 | 4.1%(+0.470)#6,676 |
| 75. | 71603 | 4.6% | 3.3%(+1.33)#75 | 4.1%(+0.462)#6,703 |
| 76. | 72102 | 4.6% | 3.3%(+1.32)#76 | 4.1%(+0.450)#6,733 |
| 77. | 72223 | 4.6% | 3.3%(+1.30)#77 | 4.1%(+0.435)#6,776 |
| 78. | 72761 | 4.6% | 3.3%(+1.30)#78 | 4.1%(+0.427)#6,798 |
| 79. | 72205 | 4.5% | 3.3%(+1.28)#79 | 4.1%(+0.412)#6,822 |
| 80. | 72327 | 4.5% | 3.3%(+1.25)#80 | 4.1%(+0.381)#6,909 |
| 81. | 72120 | 4.5% | 3.3%(+1.25)#81 | 4.1%(+0.377)#6,922 |
| 82. | 71957 | 4.5% | 3.3%(+1.23)#82 | 4.1%(+0.357)#6,990 |
| 83. | 72722 | 4.5% | 3.3%(+1.20)#83 | 4.1%(+0.326)#7,063 |
| 84. | 72719 | 4.4% | 3.3%(+1.17)#84 | 4.1%(+0.304)#7,130 |
| 85. | 72396 | 4.4% | 3.3%(+1.16)#85 | 4.1%(+0.290)#7,185 |
| 86. | 72370 | 4.4% | 3.3%(+1.13)#86 | 4.1%(+0.261)#7,264 |
| 87. | 72756 | 4.4% | 3.3%(+1.12)#87 | 4.1%(+0.253)#7,283 |
| 88. | 72758 | 4.4% | 3.3%(+1.09)#88 | 4.1%(+0.222)#7,388 |
| 89. | 72034 | 4.3% | 3.3%(+1.01)#89 | 4.1%(+0.135)#7,668 |
| 90. | 72065 | 4.2% | 3.3%(+0.960)#90 | 4.1%(+0.090)#7,817 |
| 91. | 72129 | 4.2% | 3.3%(+0.960)#91 | 4.1%(+0.090)#7,822 |
| 92. | 72176 | 4.1% | 3.3%(+0.878)#92 | 4.1%(+0.008)#8,085 |
| 93. | 72834 | 4.1% | 3.3%(+0.865)#93 | 4.1%(-0.005)#8,128 |
| 94. | 72135 | 4.0% | 3.3%(+0.785)#94 | 4.1%(-0.085)#8,411 |
| 95. | 72632 | 4.0% | 3.3%(+0.757)#95 | 4.1%(-0.113)#8,496 |
| 96. | 72601 | 4.0% | 3.3%(+0.750)#96 | 4.1%(-0.120)#8,517 |
| 97. | 72631 | 4.0% | 3.3%(+0.745)#97 | 4.1%(-0.125)#8,535 |
| 98. | 72762 | 4.0% | 3.3%(+0.728)#98 | 4.1%(-0.142)#8,588 |
| 99. | 72764 | 3.9% | 3.3%(+0.667)#99 | 4.1%(-0.203)#8,804 |
| 100. | 72476 | 3.9% | 3.3%(+0.637)#100 | 4.1%(-0.233)#8,897 |
Common Questions
What are the Top 10 Zip Codes with the Highest Percentage of Population with a Degree in Communications in Arkansas?
Top 10 Zip Codes with the Highest Percentage of Population with a Degree in Communications in Arkansas are:
What zip code has the Highest Percentage of Population with a Degree in Communications in Arkansas?
72331 has the Highest Percentage of Population with a Degree in Communications in Arkansas with 46.1%.
What is the Percentage of Population with a Degree in Communications in the State of Arkansas?
Percentage of Population with a Degree in Communications in Arkansas is 3.3%.
What is the Percentage of Population with a Degree in Communications in the United States?
Percentage of Population with a Degree in Communications in the United States is 4.1%.