Danbury, WI Map & Demographics
Danbury Map
Danbury Overview
$25,995
PER CAPITA INCOME
$68,750
AVG FAMILY INCOME
$44,375
AVG HOUSEHOLD INCOME
0.41
INEQUALITY / GINI INDEX
92
TOTAL POPULATION
36
MALE POPULATION
56
FEMALE POPULATION
64.29
MALES / 100 FEMALES
155.56
FEMALES / 100 MALES
60.0
MEDIAN AGE
2.5
AVG FAMILY SIZE
2.0
AVG HOUSEHOLD SIZE
40
LABOR FORCE [ PEOPLE ]
48.2%
PERCENT IN LABOR FORCE
12.5%
UNEMPLOYMENT RATE
Danbury Zip Codes
Danbury Area Codes
Income in Danbury
Income Overview in Danbury
Per Capita Income in Danbury is $25,995, while median incomes of families and households are $68,750 and $44,375 respectively.
| Characteristic | Number | Measure |
| Per Capita Income | 92 | $25,995 |
| Median Family Income | 19 | $68,750 |
| Mean Family Income | 19 | $69,505 |
| Median Household Income | 45 | $44,375 |
| Mean Household Income | 45 | $49,558 |
| Income Deficit | 19 | $0 |
| Wage / Income Gap (%) | 92 | 0.00% |
| Wage / Income Gap ($) | 92 | 100.00¢ per $1 |
| Gini / Inequality Index | 92 | 0.41 |
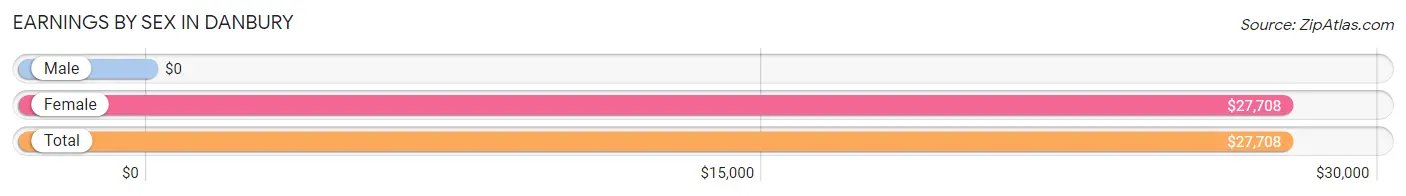
Earnings by Sex in Danbury
| Sex | Number | Average Earnings |
| Male | 16 (34.0%) | $0 |
| Female | 31 (66.0%) | $27,708 |
| Total | 47 (100.0%) | $27,708 |
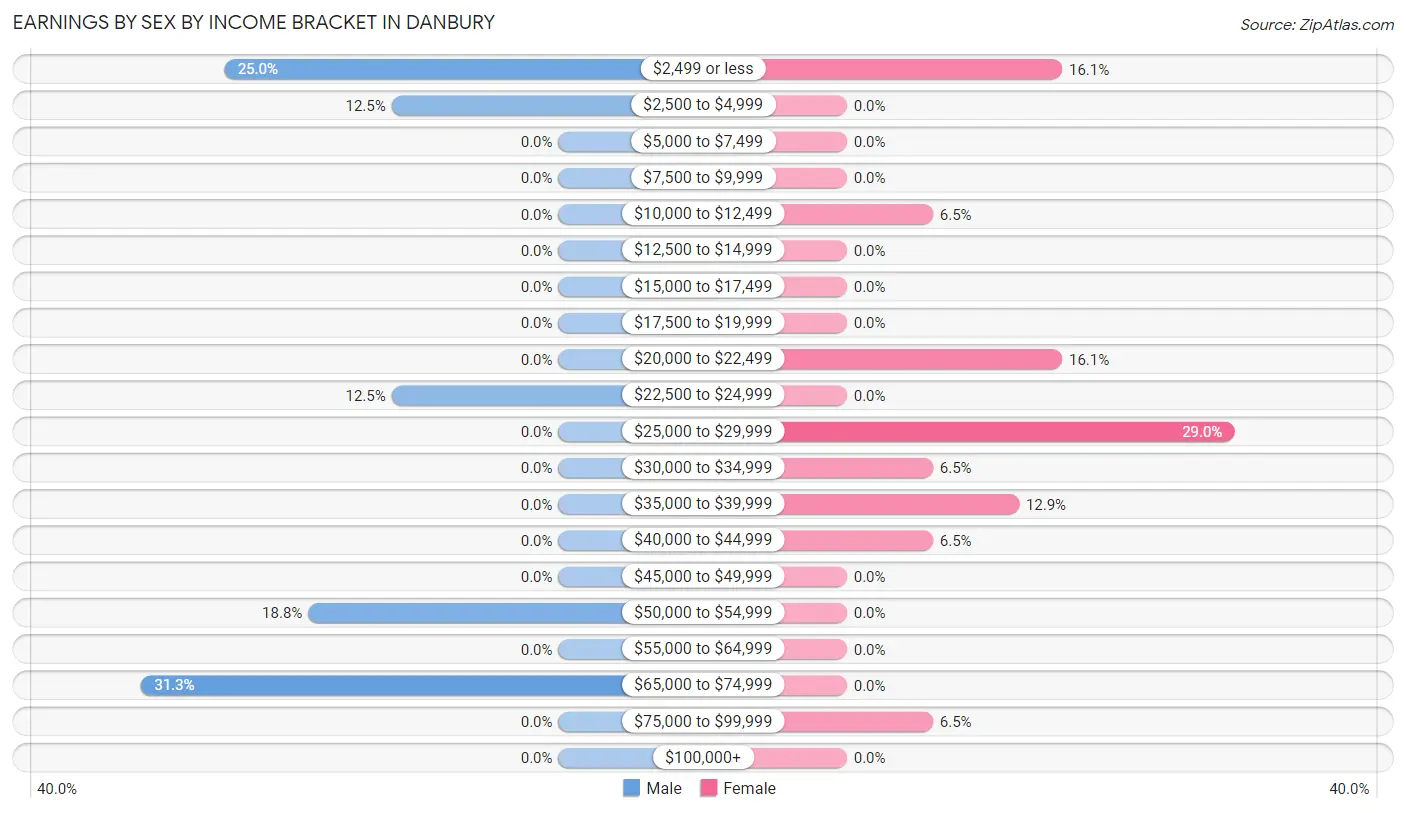
Earnings by Sex by Income Bracket in Danbury
The most common earnings brackets in Danbury are $65,000 to $74,999 for men (5 | 31.2%) and $25,000 to $29,999 for women (9 | 29.0%).
| Income | Male | Female |
| $2,499 or less | 4 (25.0%) | 5 (16.1%) |
| $2,500 to $4,999 | 2 (12.5%) | 0 (0.0%) |
| $5,000 to $7,499 | 0 (0.0%) | 0 (0.0%) |
| $7,500 to $9,999 | 0 (0.0%) | 0 (0.0%) |
| $10,000 to $12,499 | 0 (0.0%) | 2 (6.5%) |
| $12,500 to $14,999 | 0 (0.0%) | 0 (0.0%) |
| $15,000 to $17,499 | 0 (0.0%) | 0 (0.0%) |
| $17,500 to $19,999 | 0 (0.0%) | 0 (0.0%) |
| $20,000 to $22,499 | 0 (0.0%) | 5 (16.1%) |
| $22,500 to $24,999 | 2 (12.5%) | 0 (0.0%) |
| $25,000 to $29,999 | 0 (0.0%) | 9 (29.0%) |
| $30,000 to $34,999 | 0 (0.0%) | 2 (6.5%) |
| $35,000 to $39,999 | 0 (0.0%) | 4 (12.9%) |
| $40,000 to $44,999 | 0 (0.0%) | 2 (6.5%) |
| $45,000 to $49,999 | 0 (0.0%) | 0 (0.0%) |
| $50,000 to $54,999 | 3 (18.8%) | 0 (0.0%) |
| $55,000 to $64,999 | 0 (0.0%) | 0 (0.0%) |
| $65,000 to $74,999 | 5 (31.2%) | 0 (0.0%) |
| $75,000 to $99,999 | 0 (0.0%) | 2 (6.5%) |
| $100,000+ | 0 (0.0%) | 0 (0.0%) |
| Total | 16 (100.0%) | 31 (100.0%) |
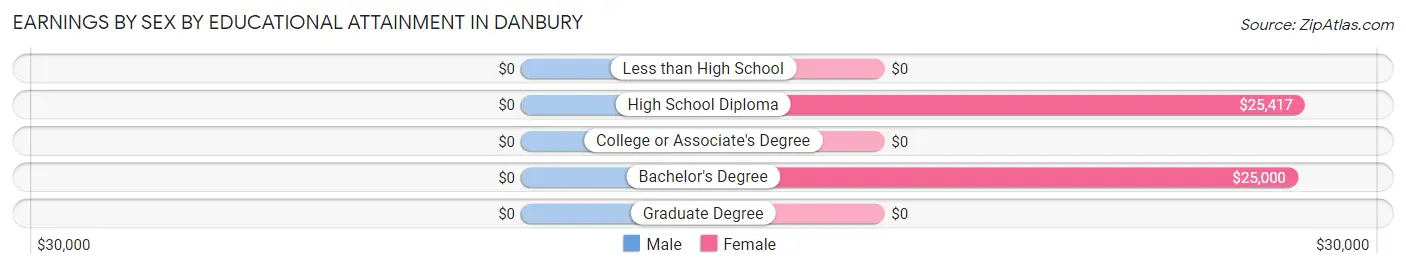
Earnings by Sex by Educational Attainment in Danbury
| Educational Attainment | Male Income | Female Income |
| Less than High School | - | - |
| High School Diploma | - | - |
| College or Associate's Degree | - | - |
| Bachelor's Degree | - | - |
| Graduate Degree | - | - |
| Total | - | - |
Family Income in Danbury
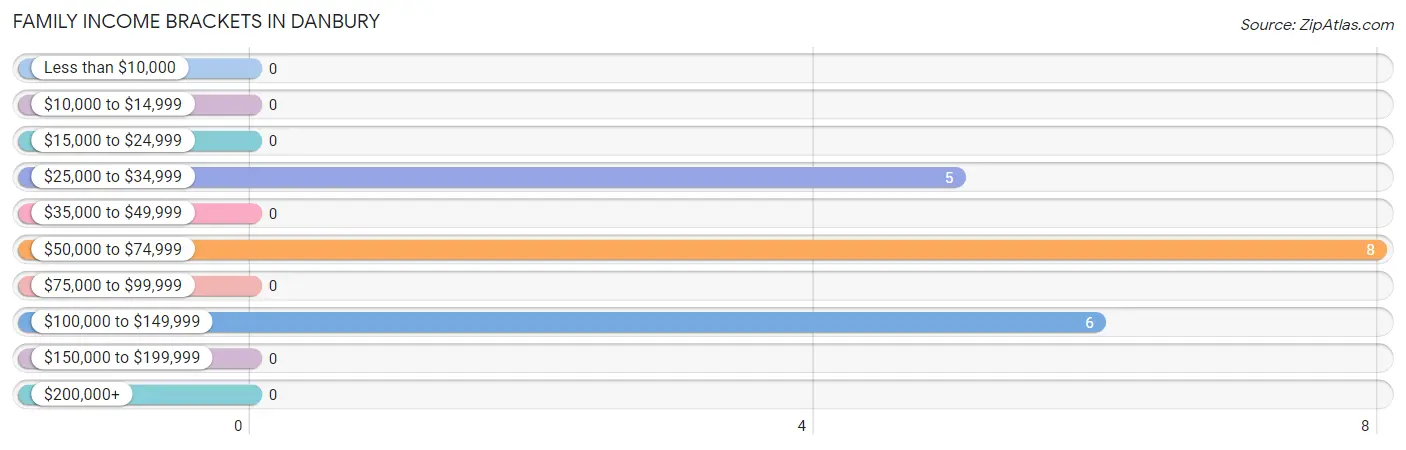
Family Income Brackets in Danbury
According to the Danbury family income data, there are 8 families falling into the $50,000 to $74,999 income range, which is the most common income bracket and makes up 42.1% of all families.
| Income Bracket | # Families | % Families |
| Less than $10,000 | 0 | 0.0% |
| $10,000 to $14,999 | 0 | 0.0% |
| $15,000 to $24,999 | 0 | 0.0% |
| $25,000 to $34,999 | 5 | 26.3% |
| $35,000 to $49,999 | 0 | 0.0% |
| $50,000 to $74,999 | 8 | 42.1% |
| $75,000 to $99,999 | 0 | 0.0% |
| $100,000 to $149,999 | 6 | 31.6% |
| $150,000 to $199,999 | 0 | 0.0% |
| $200,000+ | 0 | 0.0% |
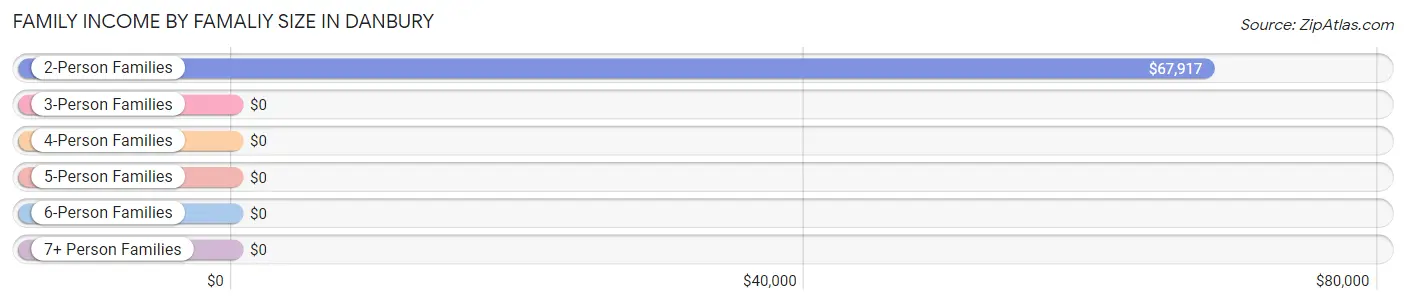
Family Income by Famaliy Size in Danbury
2-person families (17 | 89.5%) account for the highest median family income in Danbury with $67,917 per family, while 2-person families (17 | 89.5%) have the highest median income of $33,958 per family member.
| Income Bracket | # Families | Median Income |
| 2-Person Families | 17 (89.5%) | $67,917 |
| 3-Person Families | 2 (10.5%) | $0 |
| 4-Person Families | 0 (0.0%) | $0 |
| 5-Person Families | 0 (0.0%) | $0 |
| 6-Person Families | 0 (0.0%) | $0 |
| 7+ Person Families | 0 (0.0%) | $0 |
| Total | 19 (100.0%) | $68,750 |
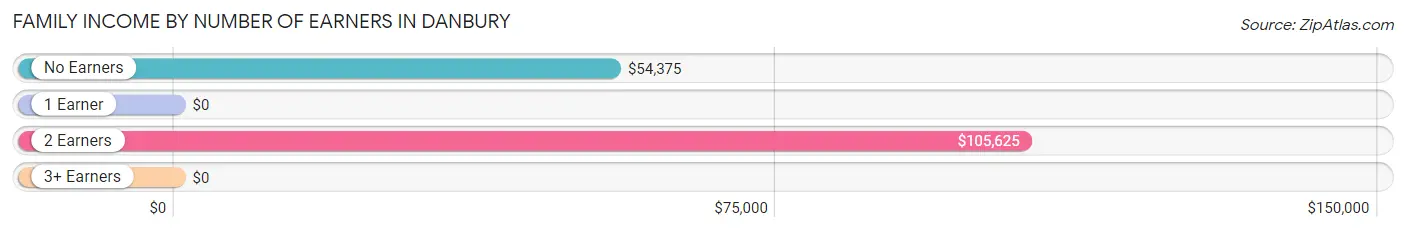
Family Income by Number of Earners in Danbury
| Number of Earners | # Families | Median Income |
| No Earners | 7 (36.8%) | $54,375 |
| 1 Earner | 5 (26.3%) | $0 |
| 2 Earners | 7 (36.8%) | $105,625 |
| 3+ Earners | 0 (0.0%) | $0 |
| Total | 19 (100.0%) | $68,750 |
Household Income in Danbury
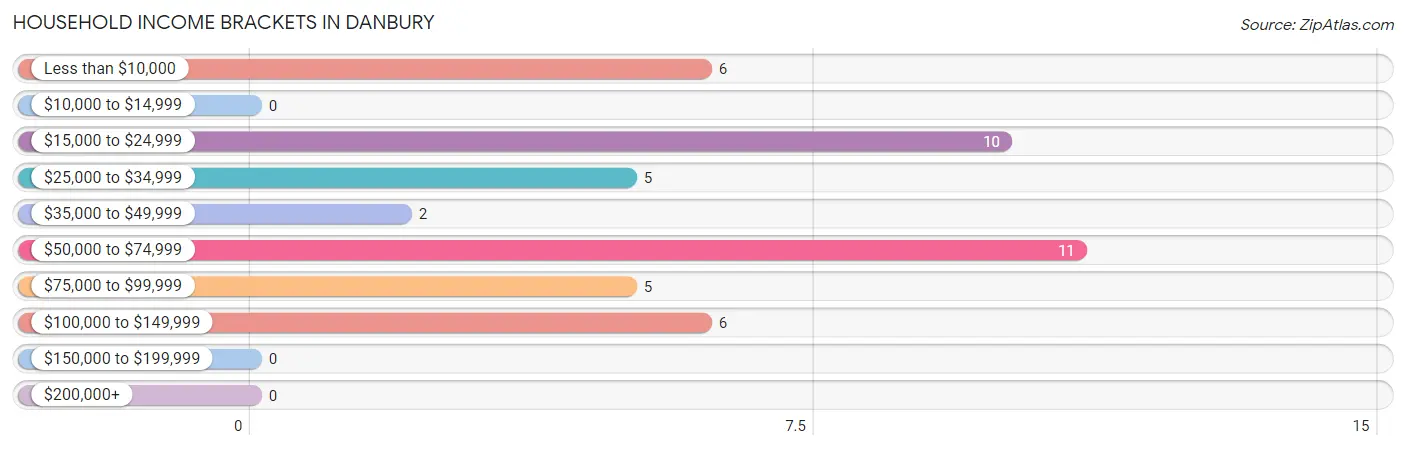
Household Income Brackets in Danbury
With 11 households falling in the category, the $50,000 to $74,999 income range is the most frequent in Danbury, accounting for 24.4% of all households.
| Income Bracket | # Households | % Households |
| Less than $10,000 | 6 | 13.3% |
| $10,000 to $14,999 | 0 | 0.0% |
| $15,000 to $24,999 | 10 | 22.2% |
| $25,000 to $34,999 | 5 | 11.1% |
| $35,000 to $49,999 | 2 | 4.4% |
| $50,000 to $74,999 | 11 | 24.4% |
| $75,000 to $99,999 | 5 | 11.1% |
| $100,000 to $149,999 | 6 | 13.3% |
| $150,000 to $199,999 | 0 | 0.0% |
| $200,000+ | 0 | 0.0% |
Household Income by Householder Age in Danbury
The median household income in Danbury is $44,375, with the highest median household income of $81,250 found in the 25 to 44 years age bracket for the primary householder. A total of 7 households (15.6%) fall into this category. Meanwhile, the 15 to 24 years age bracket for the primary householder has the lowest median household income of $0, with 2 households (4.4%) in this group.
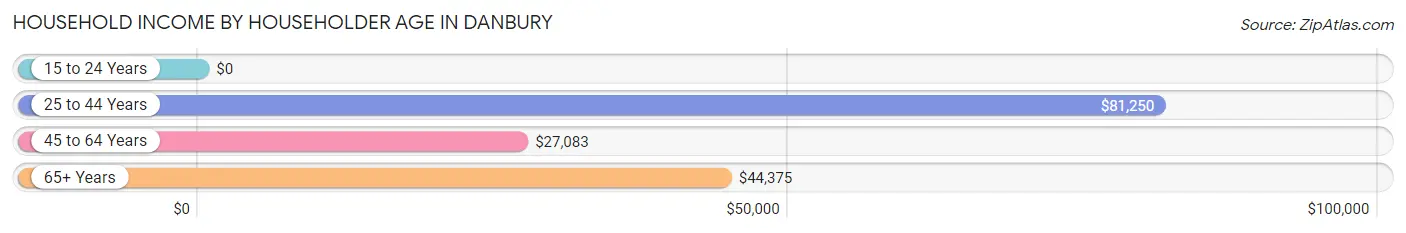
| Income Bracket | # Households | Median Income |
| 15 to 24 Years | 2 (4.4%) | $0 |
| 25 to 44 Years | 7 (15.6%) | $81,250 |
| 45 to 64 Years | 17 (37.8%) | $27,083 |
| 65+ Years | 19 (42.2%) | $44,375 |
| Total | 45 (100.0%) | $44,375 |
Poverty in Danbury
Income Below Poverty by Sex and Age in Danbury
With 27.8% poverty level for males and 1.9% for females among the residents of Danbury, 15 year old males and 55 to 64 year old females are the most vulnerable to poverty, with 5 males (100.0%) and 1 females (7.7%) in their respective age groups living below the poverty level.
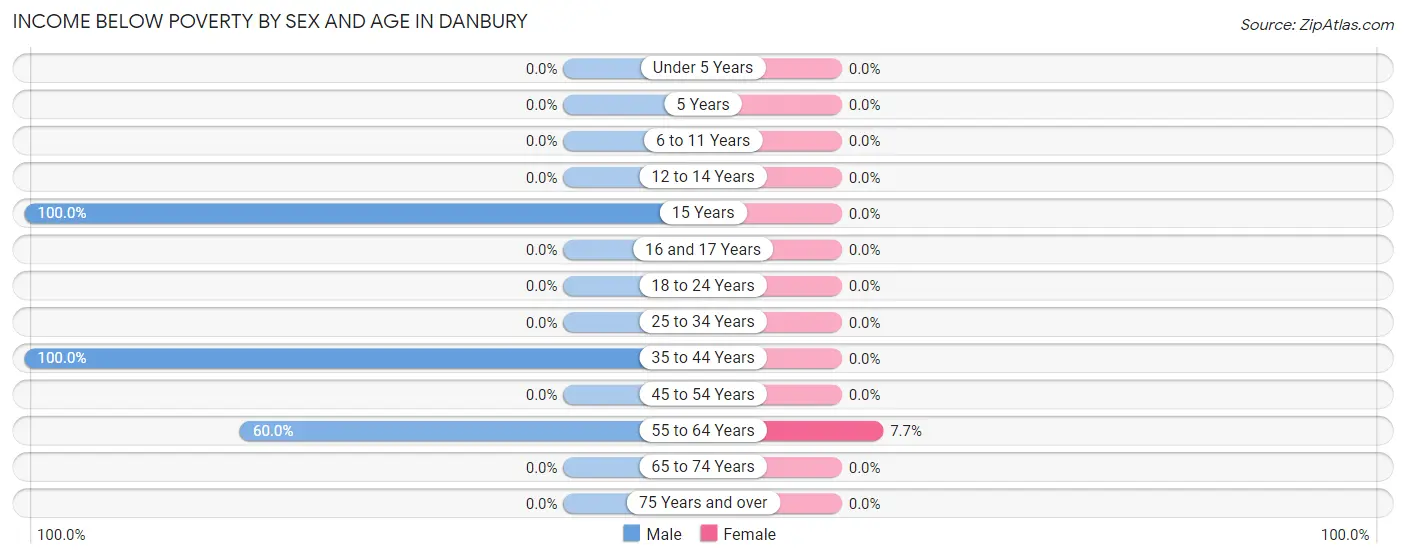
| Age Bracket | Male | Female |
| Under 5 Years | 0 (0.0%) | 0 (0.0%) |
| 5 Years | 0 (0.0%) | 0 (0.0%) |
| 6 to 11 Years | 0 (0.0%) | 0 (0.0%) |
| 12 to 14 Years | 0 (0.0%) | 0 (0.0%) |
| 15 Years | 5 (100.0%) | 0 (0.0%) |
| 16 and 17 Years | 0 (0.0%) | 0 (0.0%) |
| 18 to 24 Years | 0 (0.0%) | 0 (0.0%) |
| 25 to 34 Years | 0 (0.0%) | 0 (0.0%) |
| 35 to 44 Years | 2 (100.0%) | 0 (0.0%) |
| 45 to 54 Years | 0 (0.0%) | 0 (0.0%) |
| 55 to 64 Years | 3 (60.0%) | 1 (7.7%) |
| 65 to 74 Years | 0 (0.0%) | 0 (0.0%) |
| 75 Years and over | 0 (0.0%) | 0 (0.0%) |
| Total | 10 (27.8%) | 1 (1.9%) |
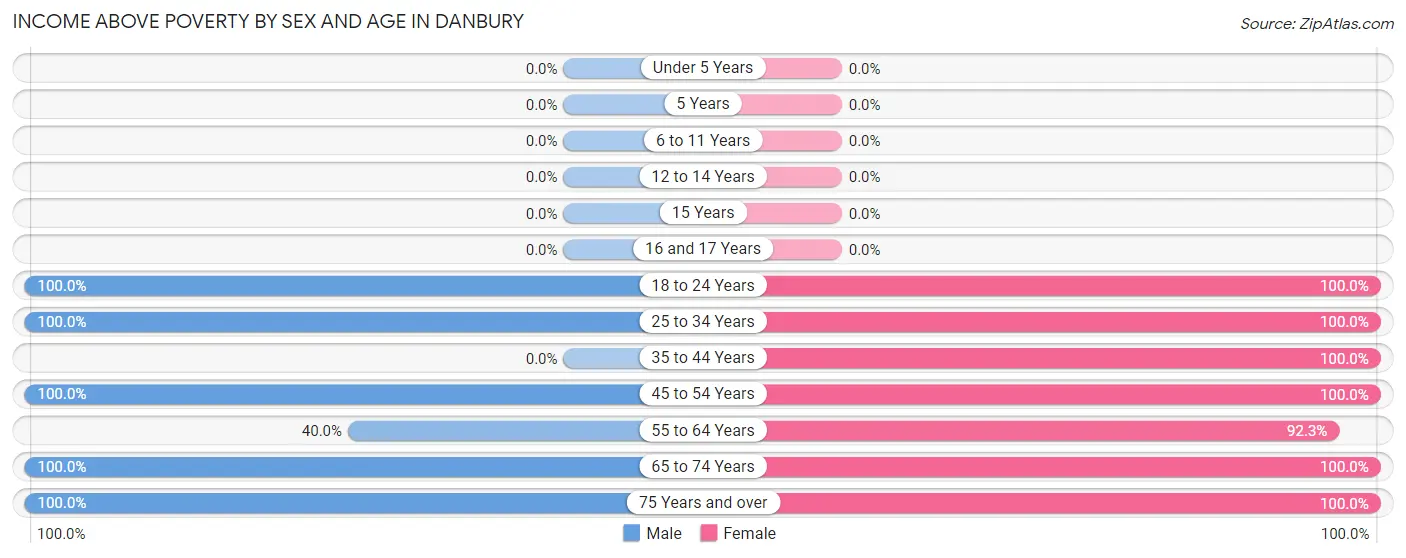
Income Above Poverty by Sex and Age in Danbury
According to the poverty statistics in Danbury, males aged 18 to 24 years and females aged 18 to 24 years are the age groups that are most secure financially, with 100.0% of males and 100.0% of females in these age groups living above the poverty line.
| Age Bracket | Male | Female |
| Under 5 Years | 0 (0.0%) | 0 (0.0%) |
| 5 Years | 0 (0.0%) | 0 (0.0%) |
| 6 to 11 Years | 0 (0.0%) | 0 (0.0%) |
| 12 to 14 Years | 0 (0.0%) | 0 (0.0%) |
| 15 Years | 0 (0.0%) | 0 (0.0%) |
| 16 and 17 Years | 0 (0.0%) | 0 (0.0%) |
| 18 to 24 Years | 2 (100.0%) | 6 (100.0%) |
| 25 to 34 Years | 5 (100.0%) | 3 (100.0%) |
| 35 to 44 Years | 0 (0.0%) | 5 (100.0%) |
| 45 to 54 Years | 6 (100.0%) | 3 (100.0%) |
| 55 to 64 Years | 2 (40.0%) | 12 (92.3%) |
| 65 to 74 Years | 6 (100.0%) | 10 (100.0%) |
| 75 Years and over | 5 (100.0%) | 12 (100.0%) |
| Total | 26 (72.2%) | 51 (98.1%) |
Income Below Poverty Among Married-Couple Families in Danbury
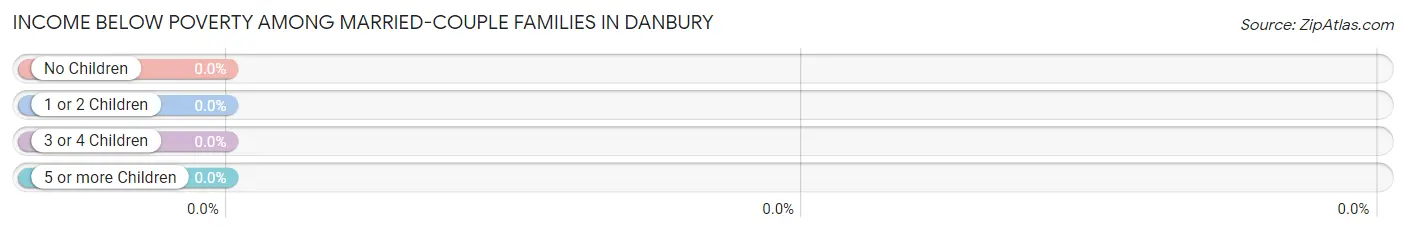
| Children | Above Poverty | Below Poverty |
| No Children | 15 (100.0%) | 0 (0.0%) |
| 1 or 2 Children | 0 (0.0%) | 0 (0.0%) |
| 3 or 4 Children | 0 (0.0%) | 0 (0.0%) |
| 5 or more Children | 0 (0.0%) | 0 (0.0%) |
| Total | 15 (100.0%) | 0 (0.0%) |
Income Below Poverty Among Single-Parent Households in Danbury
| Children | Single Father | Single Mother |
| No Children | 0 (0.0%) | 0 (0.0%) |
| 1 or 2 Children | 0 (0.0%) | 0 (0.0%) |
| 3 or 4 Children | 0 (0.0%) | 0 (0.0%) |
| 5 or more Children | 0 (0.0%) | 0 (0.0%) |
| Total | 0 (0.0%) | 0 (0.0%) |
Income Below Poverty Among Married-Couple vs Single-Parent Households in Danbury
| Children | Married-Couple Families | Single-Parent Households |
| No Children | 0 (0.0%) | 0 (0.0%) |
| 1 or 2 Children | 0 (0.0%) | 0 (0.0%) |
| 3 or 4 Children | 0 (0.0%) | 0 (0.0%) |
| 5 or more Children | 0 (0.0%) | 0 (0.0%) |
| Total | 0 (0.0%) | 0 (0.0%) |
Race in Danbury
The most populous races in Danbury are White / Caucasian (80 | 87.0%), Native / Alaskan (6 | 6.5%), and Two or more Races (3 | 3.3%).
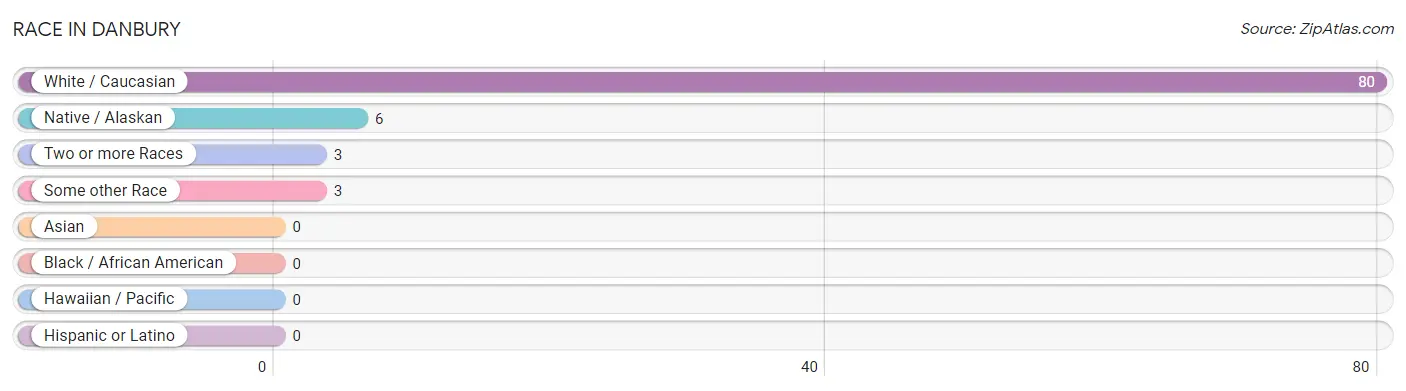
| Race | # Population | % Population |
| Asian | 0 | 0.0% |
| Black / African American | 0 | 0.0% |
| Hawaiian / Pacific | 0 | 0.0% |
| Hispanic or Latino | 0 | 0.0% |
| Native / Alaskan | 6 | 6.5% |
| White / Caucasian | 80 | 87.0% |
| Two or more Races | 3 | 3.3% |
| Some other Race | 3 | 3.3% |
| Total | 92 | 100.0% |
Ancestry in Danbury
The most populous ancestries reported in Danbury are German (33 | 35.9%), Scandinavian (14 | 15.2%), English (9 | 9.8%), Dutch (7 | 7.6%), and French (7 | 7.6%), together accounting for 76.1% of all Danbury residents.
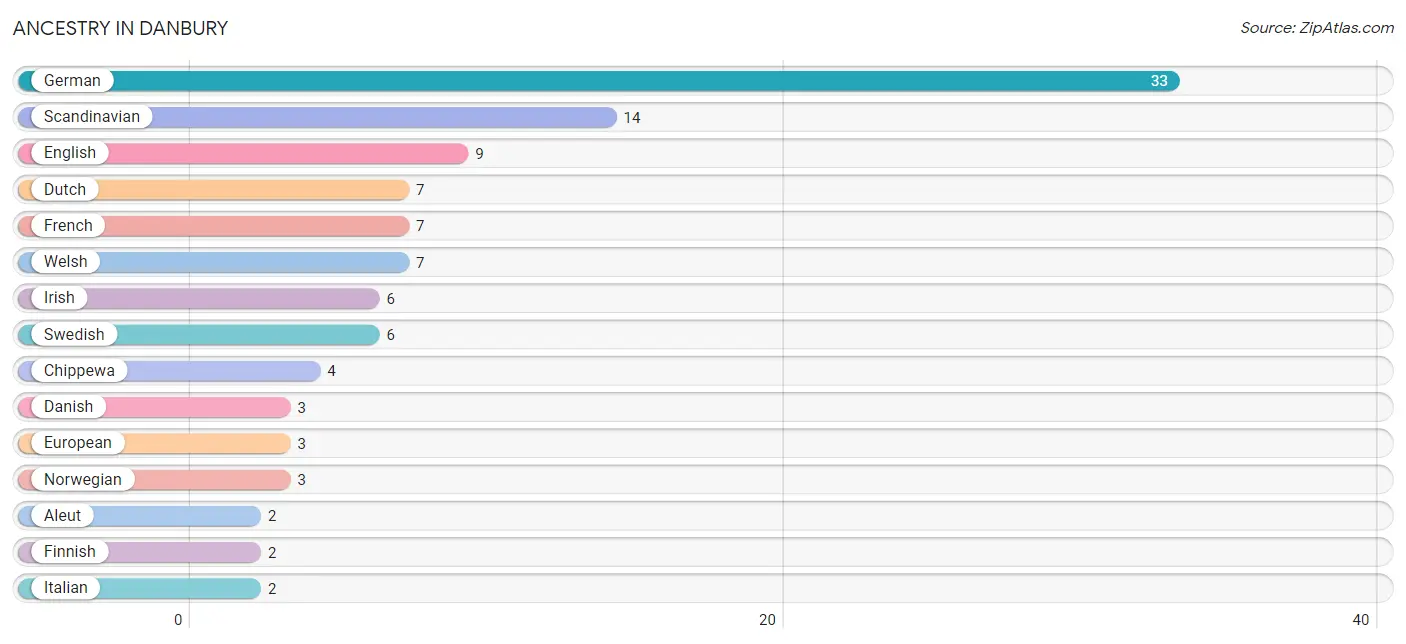
| Ancestry | # Population | % Population |
| Aleut | 2 | 2.2% |
| Chippewa | 4 | 4.3% |
| Danish | 3 | 3.3% |
| Dutch | 7 | 7.6% |
| English | 9 | 9.8% |
| European | 3 | 3.3% |
| Finnish | 2 | 2.2% |
| French | 7 | 7.6% |
| French Canadian | 1 | 1.1% |
| German | 33 | 35.9% |
| Irish | 6 | 6.5% |
| Italian | 2 | 2.2% |
| Northern European | 2 | 2.2% |
| Norwegian | 3 | 3.3% |
| Scandinavian | 14 | 15.2% |
| Swedish | 6 | 6.5% |
| Welsh | 7 | 7.6% | View All 17 Rows |
Immigrants in Danbury

| Immigration Origin | # Population | % Population | View All 0 Rows |
Sex and Age in Danbury
Sex and Age in Danbury
The most populous age groups in Danbury are 15 to 19 Years (5 | 13.9%) for men and 60 to 64 Years (13 | 23.2%) for women.
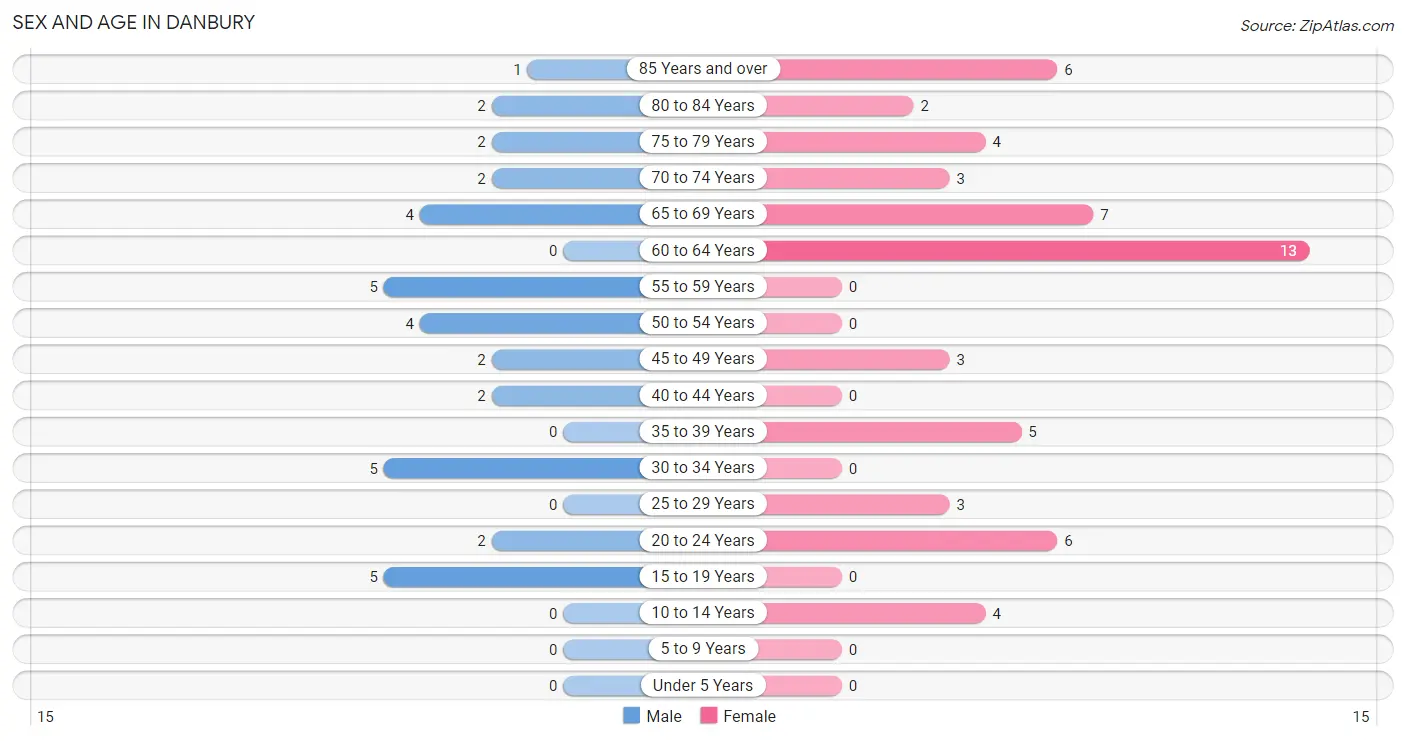
| Age Bracket | Male | Female |
| Under 5 Years | 0 (0.0%) | 0 (0.0%) |
| 5 to 9 Years | 0 (0.0%) | 0 (0.0%) |
| 10 to 14 Years | 0 (0.0%) | 4 (7.1%) |
| 15 to 19 Years | 5 (13.9%) | 0 (0.0%) |
| 20 to 24 Years | 2 (5.6%) | 6 (10.7%) |
| 25 to 29 Years | 0 (0.0%) | 3 (5.4%) |
| 30 to 34 Years | 5 (13.9%) | 0 (0.0%) |
| 35 to 39 Years | 0 (0.0%) | 5 (8.9%) |
| 40 to 44 Years | 2 (5.6%) | 0 (0.0%) |
| 45 to 49 Years | 2 (5.6%) | 3 (5.4%) |
| 50 to 54 Years | 4 (11.1%) | 0 (0.0%) |
| 55 to 59 Years | 5 (13.9%) | 0 (0.0%) |
| 60 to 64 Years | 0 (0.0%) | 13 (23.2%) |
| 65 to 69 Years | 4 (11.1%) | 7 (12.5%) |
| 70 to 74 Years | 2 (5.6%) | 3 (5.4%) |
| 75 to 79 Years | 2 (5.6%) | 4 (7.1%) |
| 80 to 84 Years | 2 (5.6%) | 2 (3.6%) |
| 85 Years and over | 1 (2.8%) | 6 (10.7%) |
| Total | 36 (100.0%) | 56 (100.0%) |
Families and Households in Danbury
Median Family Size in Danbury
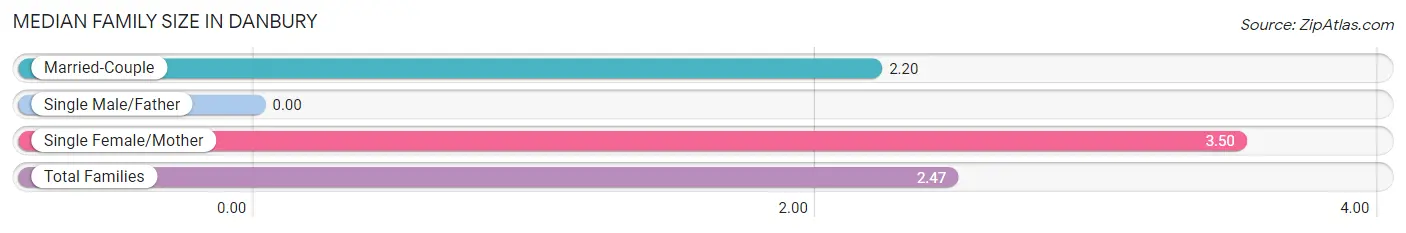
| Family Type | # Families | Family Size |
| Married-Couple | 15 (78.9%) | 2.20 |
| Single Male/Father | 0 (0.0%) | - |
| Single Female/Mother | 4 (21.0%) | 3.50 |
| Total Families | 19 (100.0%) | 2.47 |
Median Household Size in Danbury
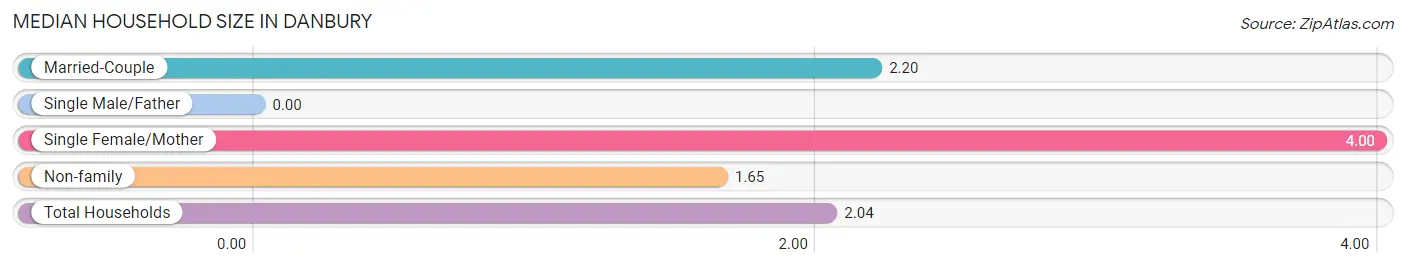
| Household Type | # Households | Household Size |
| Married-Couple | 15 (33.3%) | 2.20 |
| Single Male/Father | 0 (0.0%) | - |
| Single Female/Mother | 4 (8.9%) | 4.00 |
| Non-family | 26 (57.8%) | 1.65 |
| Total Households | 45 (100.0%) | 2.04 |
Household Size by Marriage Status in Danbury
Out of a total of 45 households in Danbury, 19 (42.2%) are family households, while 26 (57.8%) are nonfamily households. The most numerous type of family households are 2-person households, comprising 15, and the most common type of nonfamily households are 1-person households, comprising 21.
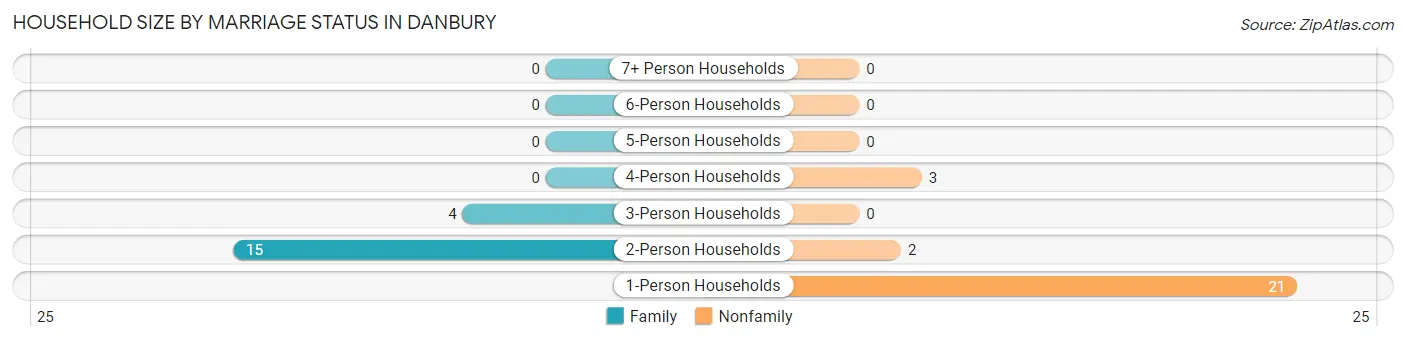
| Household Size | Family Households | Nonfamily Households |
| 1-Person Households | - | 21 (46.7%) |
| 2-Person Households | 15 (33.3%) | 2 (4.4%) |
| 3-Person Households | 4 (8.9%) | 0 (0.0%) |
| 4-Person Households | 0 (0.0%) | 3 (6.7%) |
| 5-Person Households | 0 (0.0%) | 0 (0.0%) |
| 6-Person Households | 0 (0.0%) | 0 (0.0%) |
| 7+ Person Households | 0 (0.0%) | 0 (0.0%) |
| Total | 19 (42.2%) | 26 (57.8%) |
Female Fertility in Danbury
Fertility by Age in Danbury
| Age Bracket | Women with Births | Births / 1,000 Women |
| 15 to 19 years | 0 (0.0%) | 0.0 |
| 20 to 34 years | 0 (0.0%) | 0.0 |
| 35 to 50 years | 0 (0.0%) | 0.0 |
| Total | 0 (0.0%) | 0.0 |
Fertility by Age by Marriage Status in Danbury
| Age Bracket | Married | Unmarried |
| 15 to 19 years | 0 (0.0%) | 0 (0.0%) |
| 20 to 34 years | 0 (0.0%) | 0 (0.0%) |
| 35 to 50 years | 0 (0.0%) | 0 (0.0%) |
| Total | 0 (0.0%) | 0 (0.0%) |
Fertility by Education in Danbury
| Educational Attainment | Women with Births | Births / 1,000 Women |
| Less than High School | 0 (0.0%) | 0.0 |
| High School Diploma | 0 (0.0%) | 0.0 |
| College or Associate's Degree | 0 (0.0%) | 0.0 |
| Bachelor's Degree | 0 (0.0%) | 0.0 |
| Graduate Degree | 0 (0.0%) | 0.0 |
| Total | 0 (0.0%) | 0.0 |
Fertility by Education by Marriage Status in Danbury
| Educational Attainment | Married | Unmarried |
| Less than High School | 0 (0.0%) | 0 (0.0%) |
| High School Diploma | 0 (0.0%) | 0 (0.0%) |
| College or Associate's Degree | 0 (0.0%) | 0 (0.0%) |
| Bachelor's Degree | 0 (0.0%) | 0 (0.0%) |
| Graduate Degree | 0 (0.0%) | 0 (0.0%) |
| Total | 0 (0.0%) | 0 (0.0%) |
Employment Characteristics in Danbury
Employment by Class of Employer in Danbury
Among the 33 employed individuals in Danbury, private company employees (22 | 66.7%), self-employed (not incorporated) (6 | 18.2%), and local government employees (4 | 12.1%) make up the most common classes of employment.
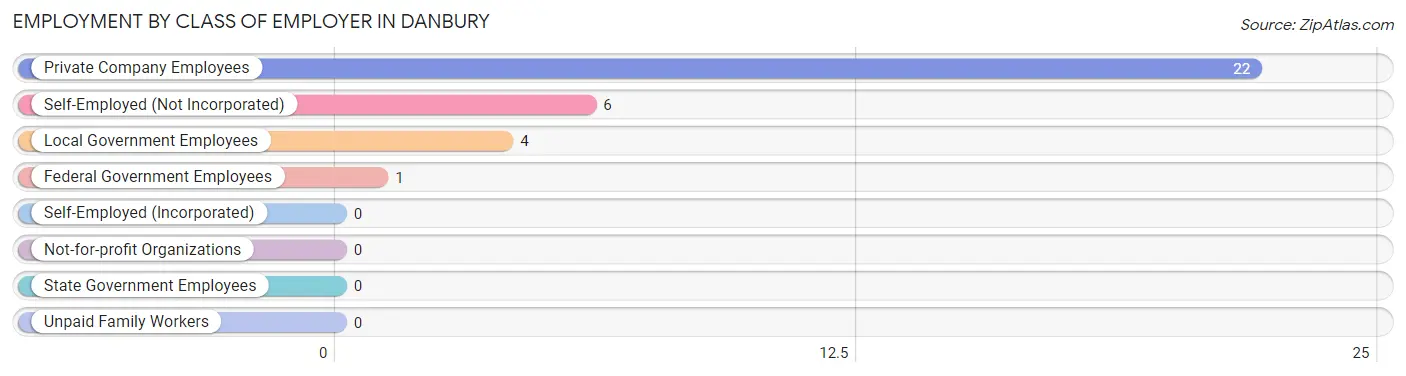
| Employer Class | # Employees | % Employees |
| Private Company Employees | 22 | 66.7% |
| Self-Employed (Incorporated) | 0 | 0.0% |
| Self-Employed (Not Incorporated) | 6 | 18.2% |
| Not-for-profit Organizations | 0 | 0.0% |
| Local Government Employees | 4 | 12.1% |
| State Government Employees | 0 | 0.0% |
| Federal Government Employees | 1 | 3.0% |
| Unpaid Family Workers | 0 | 0.0% |
| Total | 33 | 100.0% |
Employment Status by Age in Danbury
According to the labor force statistics for Danbury, out of the total population over 16 years of age (83), 48.2% or 40 individuals are in the labor force, with 12.5% or 5 of them unemployed. The age group with the highest labor force participation rate is 20 to 24 years, with 100.0% or 8 individuals in the labor force. Within the labor force, the 35 to 44 years age range has the highest percentage of unemployed individuals, with 100.0% or 5 of them being unemployed.
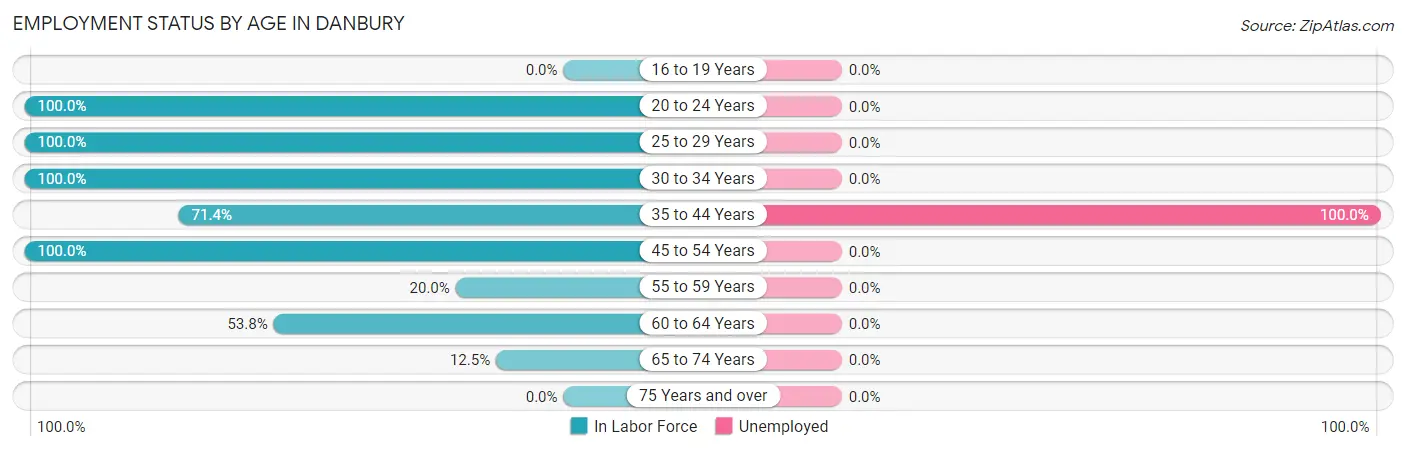
| Age Bracket | In Labor Force | Unemployed |
| 16 to 19 Years | 0 (0.0%) | 0 (0.0%) |
| 20 to 24 Years | 8 (100.0%) | 0 (0.0%) |
| 25 to 29 Years | 3 (100.0%) | 0 (0.0%) |
| 30 to 34 Years | 5 (100.0%) | 0 (0.0%) |
| 35 to 44 Years | 5 (71.4%) | 5 (100.0%) |
| 45 to 54 Years | 9 (100.0%) | 0 (0.0%) |
| 55 to 59 Years | 1 (20.0%) | 0 (0.0%) |
| 60 to 64 Years | 7 (53.8%) | 0 (0.0%) |
| 65 to 74 Years | 2 (12.5%) | 0 (0.0%) |
| 75 Years and over | 0 (0.0%) | 0 (0.0%) |
| Total | 40 (48.2%) | 5 (12.5%) |
Employment Status by Educational Attainment in Danbury
According to labor force statistics for Danbury, 71.4% of individuals (30) out of the total population between 25 and 64 years of age (42) are in the labor force, with 16.7% or 5 of them being unemployed. The group with the highest labor force participation rate are those with the educational attainment of bachelor's degree or higher, with 100.0% or 12 individuals in the labor force. Within the labor force, individuals with bachelor's degree or higher education have the highest percentage of unemployment, with 41.7% or 5 of them being unemployed.
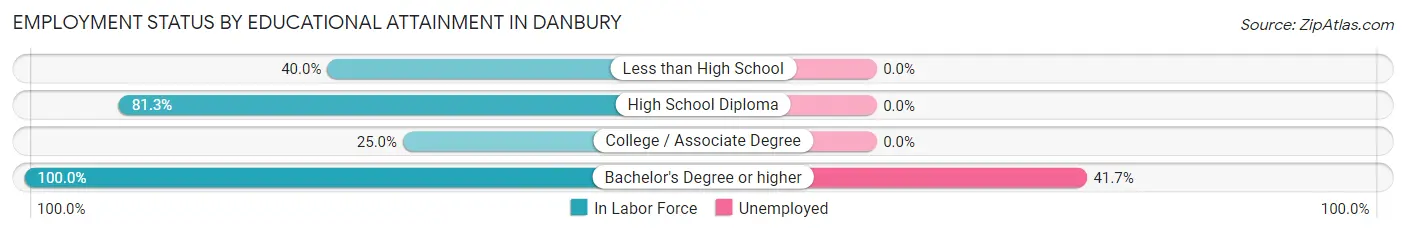
| Educational Attainment | In Labor Force | Unemployed |
| Less than High School | 4 (40.0%) | 0 (0.0%) |
| High School Diploma | 13 (81.3%) | 0 (0.0%) |
| College / Associate Degree | 1 (25.0%) | 0 (0.0%) |
| Bachelor's Degree or higher | 12 (100.0%) | 5 (41.7%) |
| Total | 30 (71.4%) | 7 (16.7%) |
Employment Occupations by Sex in Danbury
Management, Business, Science and Arts Occupations
The most common Management, Business, Science and Arts occupations in Danbury are , and Management (4 | 11.4%).
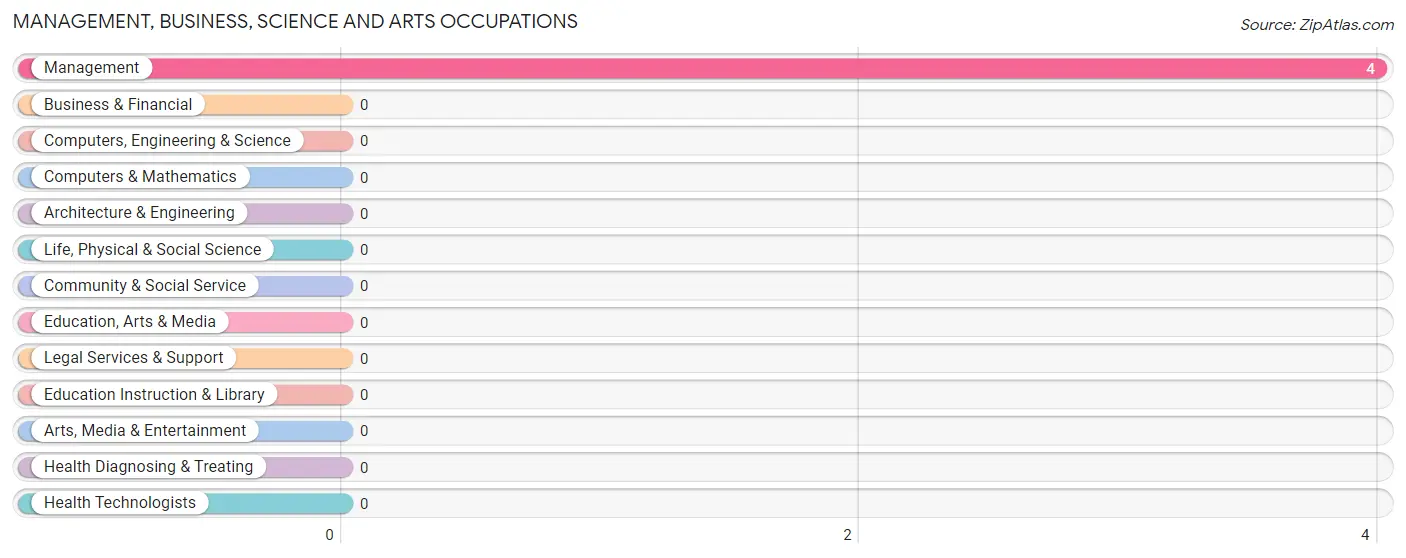
Management, Business, Science and Arts Occupations by Sex
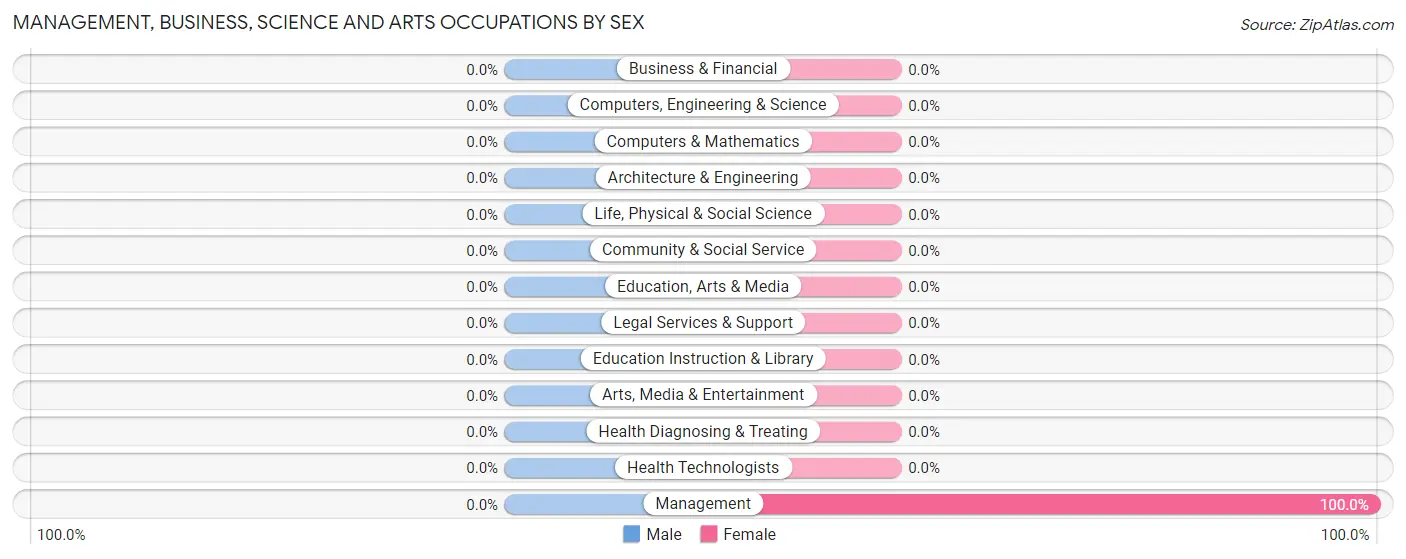
| Occupation | Male | Female |
| Management | 0 (0.0%) | 4 (100.0%) |
| Business & Financial | 0 (0.0%) | 0 (0.0%) |
| Computers, Engineering & Science | 0 (0.0%) | 0 (0.0%) |
| Computers & Mathematics | 0 (0.0%) | 0 (0.0%) |
| Architecture & Engineering | 0 (0.0%) | 0 (0.0%) |
| Life, Physical & Social Science | 0 (0.0%) | 0 (0.0%) |
| Community & Social Service | 0 (0.0%) | 0 (0.0%) |
| Education, Arts & Media | 0 (0.0%) | 0 (0.0%) |
| Legal Services & Support | 0 (0.0%) | 0 (0.0%) |
| Education Instruction & Library | 0 (0.0%) | 0 (0.0%) |
| Arts, Media & Entertainment | 0 (0.0%) | 0 (0.0%) |
| Health Diagnosing & Treating | 0 (0.0%) | 0 (0.0%) |
| Health Technologists | 0 (0.0%) | 0 (0.0%) |
| Total (Category) | 0 (0.0%) | 4 (100.0%) |
| Total (Overall) | 14 (40.0%) | 21 (60.0%) |
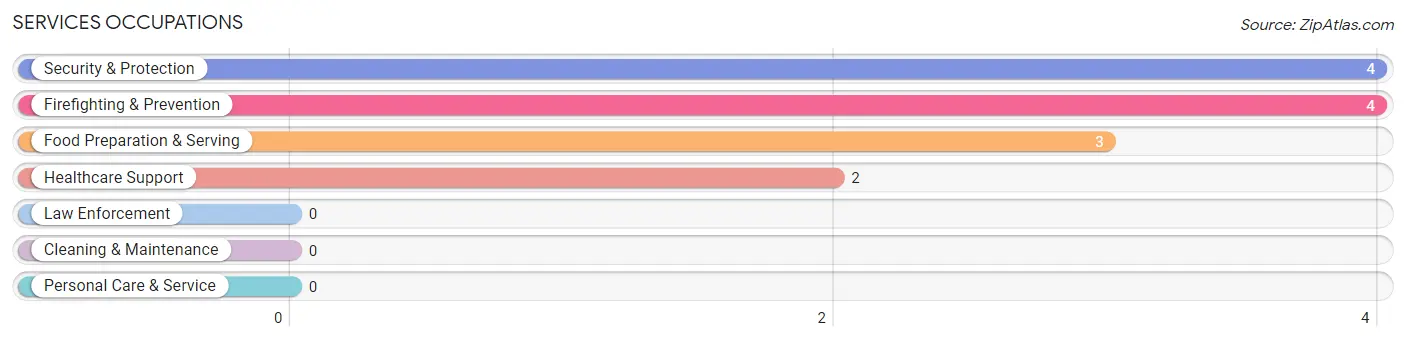
Services Occupations
The most common Services occupations in Danbury are Security & Protection (4 | 11.4%), Firefighting & Prevention (4 | 11.4%), Food Preparation & Serving (3 | 8.6%), and Healthcare Support (2 | 5.7%).
Services Occupations by Sex
Within the Services occupations in Danbury, the most male-oriented occupations are Security & Protection (100.0%), and Firefighting & Prevention (100.0%), while the most female-oriented occupations are Healthcare Support (100.0%), and Food Preparation & Serving (100.0%).
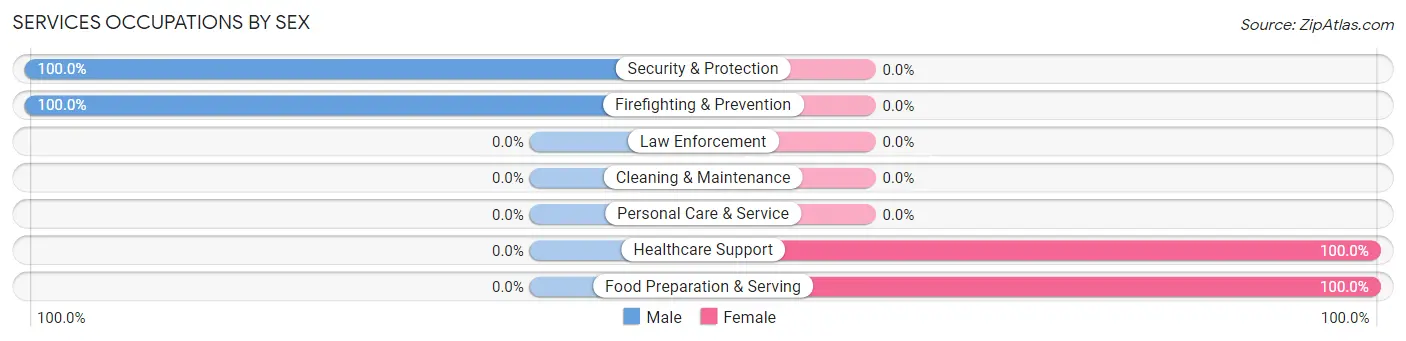
| Occupation | Male | Female |
| Healthcare Support | 0 (0.0%) | 2 (100.0%) |
| Security & Protection | 4 (100.0%) | 0 (0.0%) |
| Firefighting & Prevention | 4 (100.0%) | 0 (0.0%) |
| Law Enforcement | 0 (0.0%) | 0 (0.0%) |
| Food Preparation & Serving | 0 (0.0%) | 3 (100.0%) |
| Cleaning & Maintenance | 0 (0.0%) | 0 (0.0%) |
| Personal Care & Service | 0 (0.0%) | 0 (0.0%) |
| Total (Category) | 4 (44.4%) | 5 (55.6%) |
| Total (Overall) | 14 (40.0%) | 21 (60.0%) |
Sales and Office Occupations
The most common Sales and Office occupations in Danbury are Sales & Related (6 | 17.1%), and Office & Administration (5 | 14.3%).
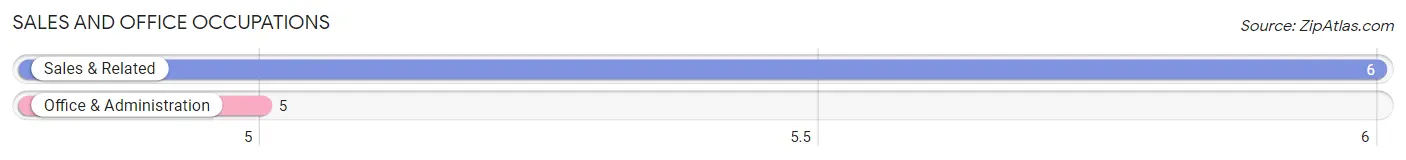
Sales and Office Occupations by Sex
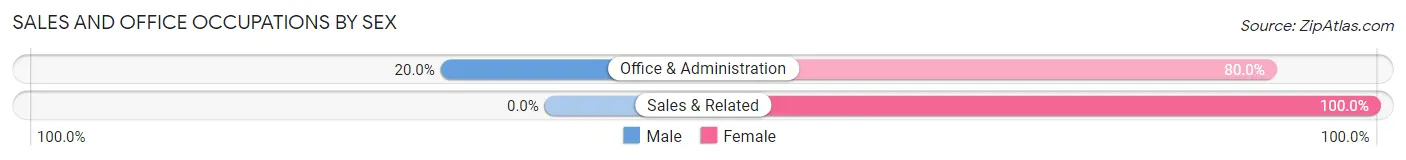
| Occupation | Male | Female |
| Sales & Related | 0 (0.0%) | 6 (100.0%) |
| Office & Administration | 1 (20.0%) | 4 (80.0%) |
| Total (Category) | 1 (9.1%) | 10 (90.9%) |
| Total (Overall) | 14 (40.0%) | 21 (60.0%) |
Natural Resources, Construction and Maintenance Occupations
The most common Natural Resources, Construction and Maintenance occupations in Danbury are , and Farming, Fishing & Forestry (5 | 14.3%).
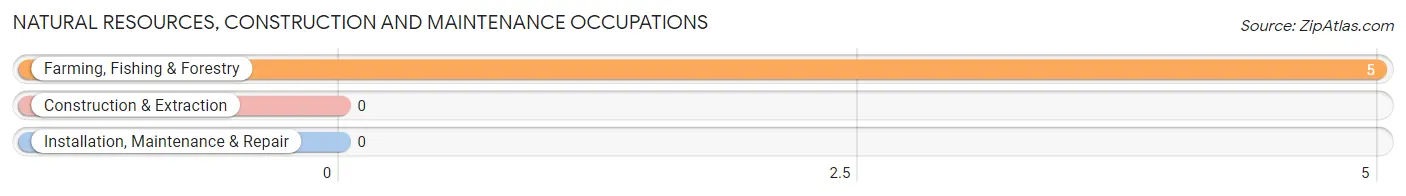
Natural Resources, Construction and Maintenance Occupations by Sex
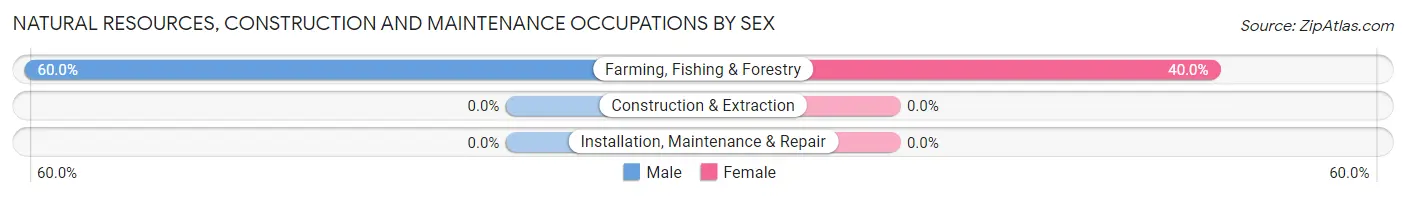
| Occupation | Male | Female |
| Farming, Fishing & Forestry | 3 (60.0%) | 2 (40.0%) |
| Construction & Extraction | 0 (0.0%) | 0 (0.0%) |
| Installation, Maintenance & Repair | 0 (0.0%) | 0 (0.0%) |
| Total (Category) | 3 (60.0%) | 2 (40.0%) |
| Total (Overall) | 14 (40.0%) | 21 (60.0%) |
Production, Transportation and Moving Occupations
The most common Production, Transportation and Moving occupations in Danbury are Transportation (4 | 11.4%), and Production (2 | 5.7%).
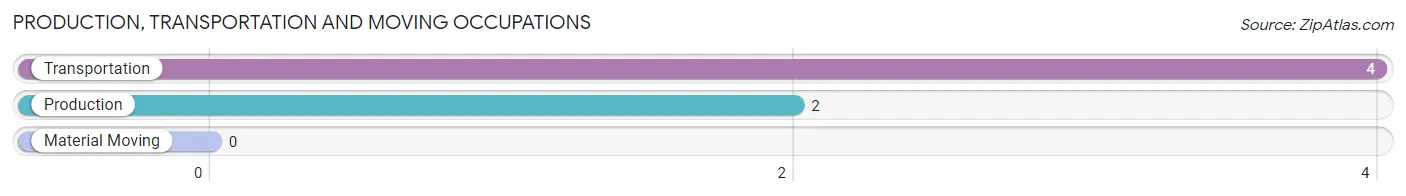
Production, Transportation and Moving Occupations by Sex
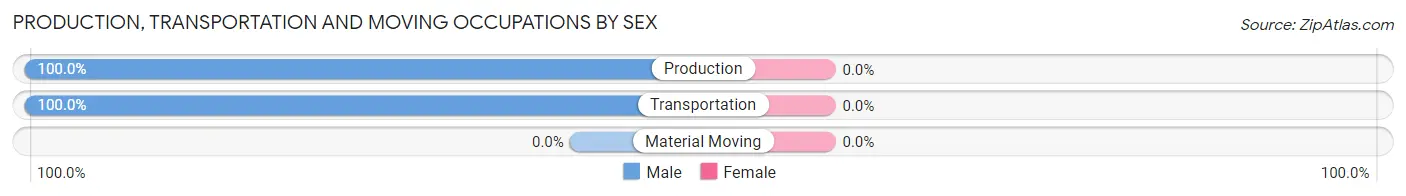
| Occupation | Male | Female |
| Production | 2 (100.0%) | 0 (0.0%) |
| Transportation | 4 (100.0%) | 0 (0.0%) |
| Material Moving | 0 (0.0%) | 0 (0.0%) |
| Total (Category) | 6 (100.0%) | 0 (0.0%) |
| Total (Overall) | 14 (40.0%) | 21 (60.0%) |
Employment Industries by Sex in Danbury
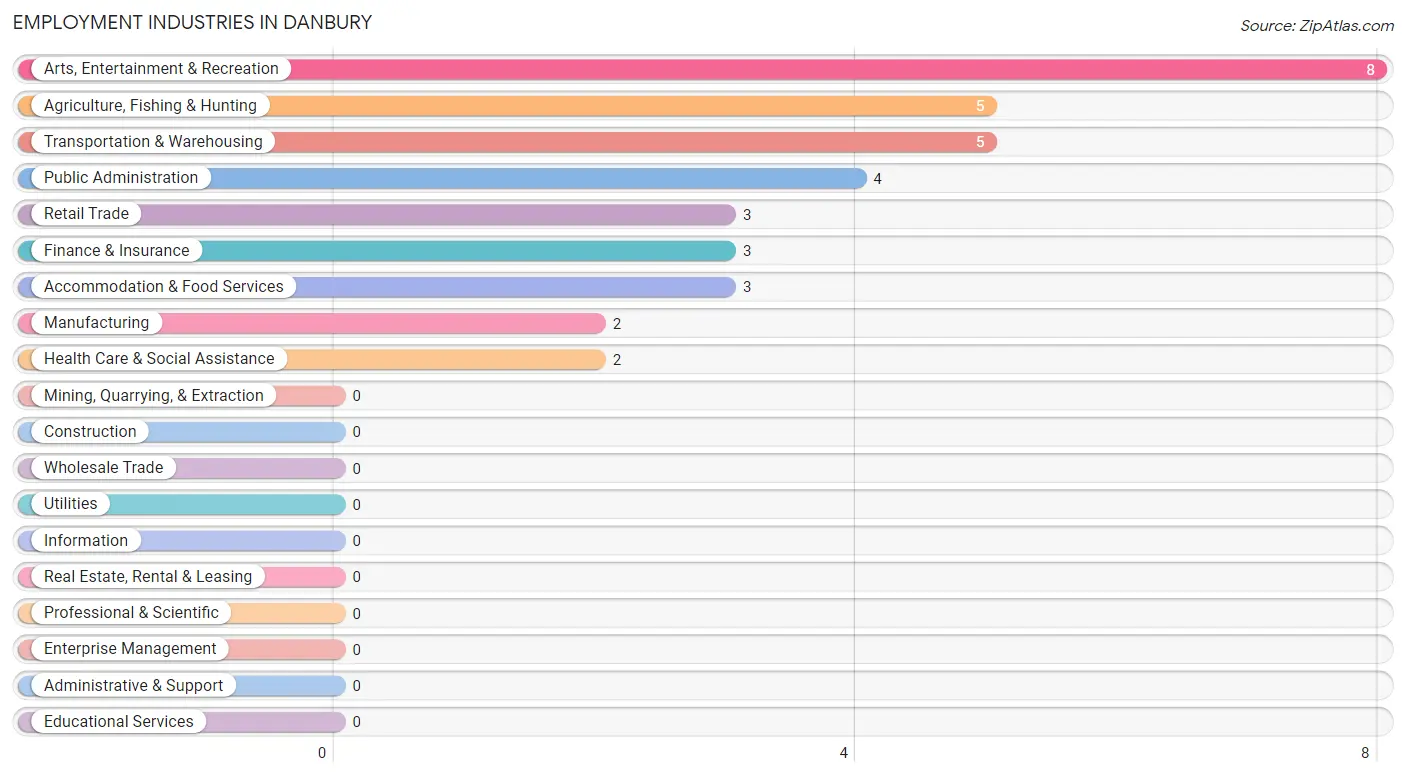
Employment Industries in Danbury
The major employment industries in Danbury include Arts, Entertainment & Recreation (8 | 22.9%), Agriculture, Fishing & Hunting (5 | 14.3%), Transportation & Warehousing (5 | 14.3%), Public Administration (4 | 11.4%), and Retail Trade (3 | 8.6%).
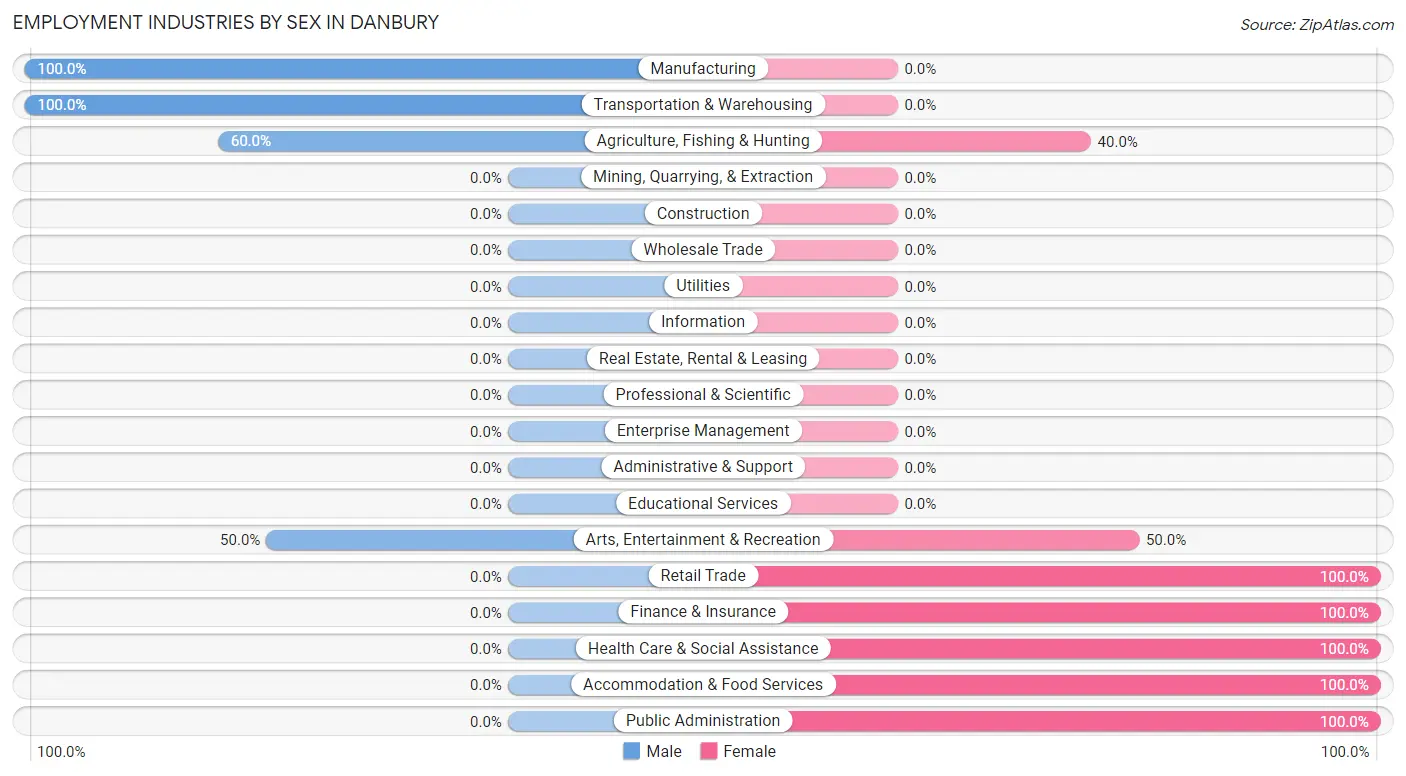
Employment Industries by Sex in Danbury
The Danbury industries that see more men than women are Manufacturing (100.0%), Transportation & Warehousing (100.0%), and Agriculture, Fishing & Hunting (60.0%), whereas the industries that tend to have a higher number of women are Retail Trade (100.0%), Finance & Insurance (100.0%), and Health Care & Social Assistance (100.0%).
| Industry | Male | Female |
| Agriculture, Fishing & Hunting | 3 (60.0%) | 2 (40.0%) |
| Mining, Quarrying, & Extraction | 0 (0.0%) | 0 (0.0%) |
| Construction | 0 (0.0%) | 0 (0.0%) |
| Manufacturing | 2 (100.0%) | 0 (0.0%) |
| Wholesale Trade | 0 (0.0%) | 0 (0.0%) |
| Retail Trade | 0 (0.0%) | 3 (100.0%) |
| Transportation & Warehousing | 5 (100.0%) | 0 (0.0%) |
| Utilities | 0 (0.0%) | 0 (0.0%) |
| Information | 0 (0.0%) | 0 (0.0%) |
| Finance & Insurance | 0 (0.0%) | 3 (100.0%) |
| Real Estate, Rental & Leasing | 0 (0.0%) | 0 (0.0%) |
| Professional & Scientific | 0 (0.0%) | 0 (0.0%) |
| Enterprise Management | 0 (0.0%) | 0 (0.0%) |
| Administrative & Support | 0 (0.0%) | 0 (0.0%) |
| Educational Services | 0 (0.0%) | 0 (0.0%) |
| Health Care & Social Assistance | 0 (0.0%) | 2 (100.0%) |
| Arts, Entertainment & Recreation | 4 (50.0%) | 4 (50.0%) |
| Accommodation & Food Services | 0 (0.0%) | 3 (100.0%) |
| Public Administration | 0 (0.0%) | 4 (100.0%) |
| Total | 14 (40.0%) | 21 (60.0%) |
Education in Danbury
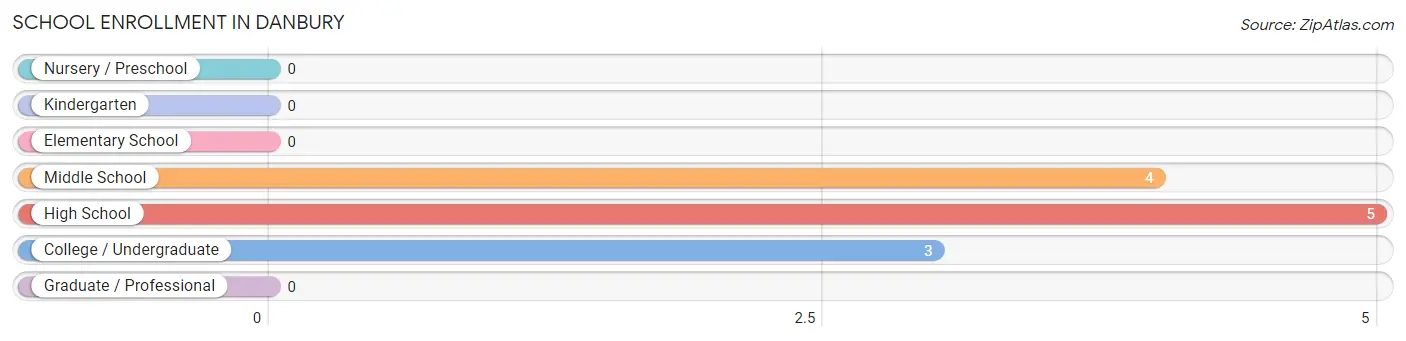
School Enrollment in Danbury
The most common levels of schooling among the 12 students in Danbury are high school (5 | 41.7%), middle school (4 | 33.3%), and college / undergraduate (3 | 25.0%).
| School Level | # Students | % Students |
| Nursery / Preschool | 0 | 0.0% |
| Kindergarten | 0 | 0.0% |
| Elementary School | 0 | 0.0% |
| Middle School | 4 | 33.3% |
| High School | 5 | 41.7% |
| College / Undergraduate | 3 | 25.0% |
| Graduate / Professional | 0 | 0.0% |
| Total | 12 | 100.0% |
School Enrollment by Age by Funding Source in Danbury
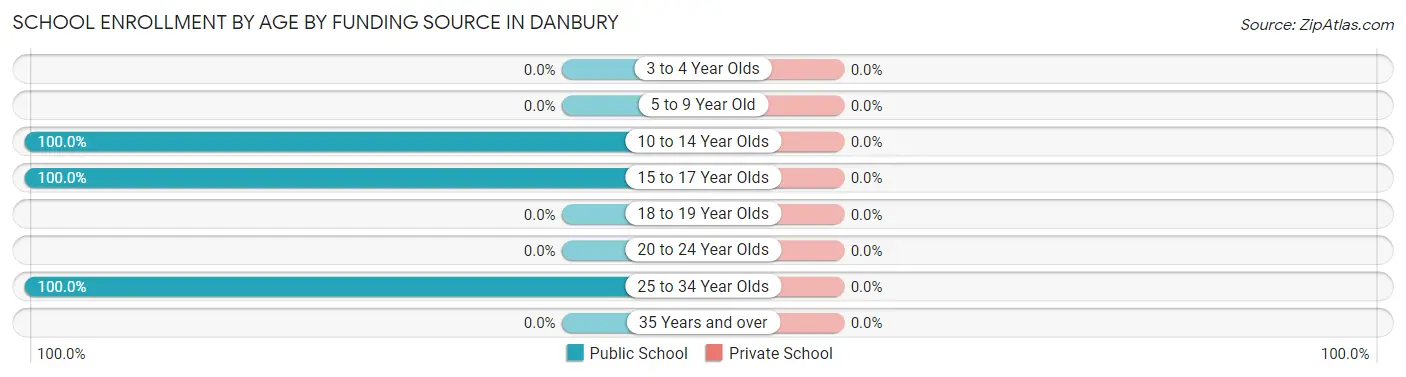
| Age Bracket | Public School | Private School |
| 3 to 4 Year Olds | 0 (0.0%) | 0 (0.0%) |
| 5 to 9 Year Old | 0 (0.0%) | 0 (0.0%) |
| 10 to 14 Year Olds | 4 (100.0%) | 0 (0.0%) |
| 15 to 17 Year Olds | 5 (100.0%) | 0 (0.0%) |
| 18 to 19 Year Olds | 0 (0.0%) | 0 (0.0%) |
| 20 to 24 Year Olds | 0 (0.0%) | 0 (0.0%) |
| 25 to 34 Year Olds | 3 (100.0%) | 0 (0.0%) |
| 35 Years and over | 0 (0.0%) | 0 (0.0%) |
| Total | 12 (100.0%) | 0 (0.0%) |
Educational Attainment by Field of Study in Danbury
Psychology (5 | 27.8%), education (4 | 22.2%), bio, nature & agricultural (3 | 16.7%), engineering (2 | 11.1%), and science & technology (2 | 11.1%) are the most common fields of study among 18 individuals in Danbury who have obtained a bachelor's degree or higher.
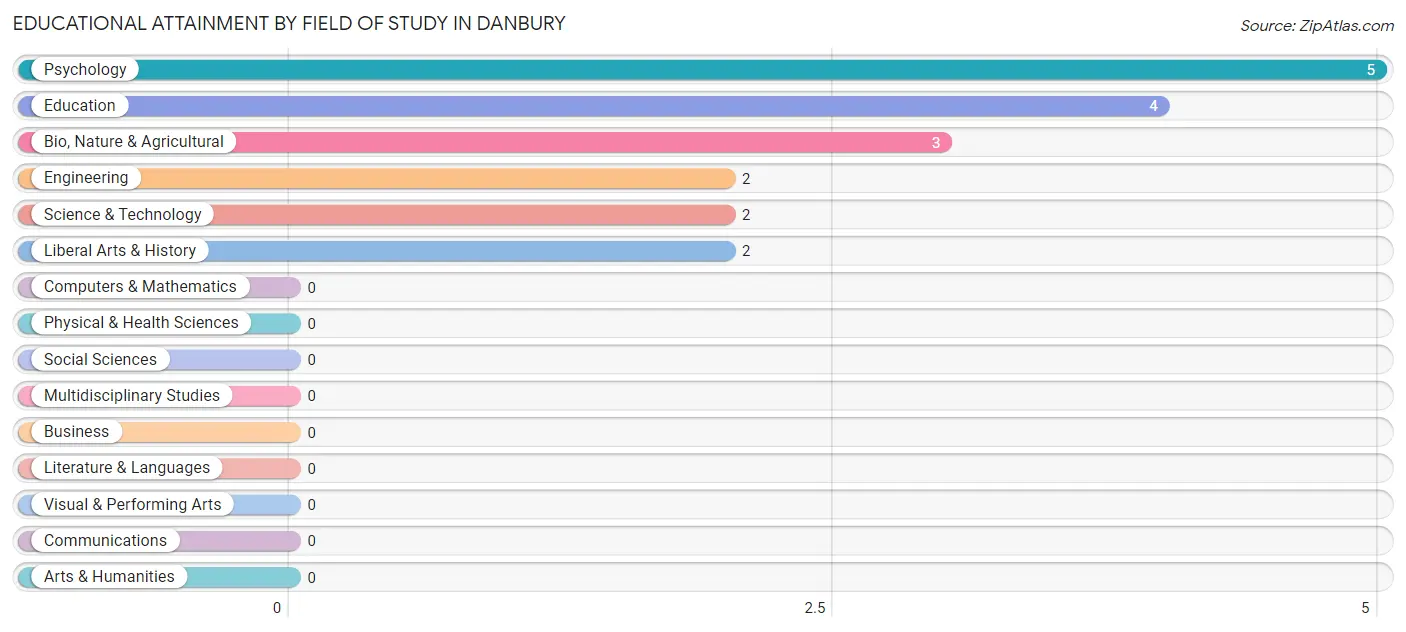
| Field of Study | # Graduates | % Graduates |
| Computers & Mathematics | 0 | 0.0% |
| Bio, Nature & Agricultural | 3 | 16.7% |
| Physical & Health Sciences | 0 | 0.0% |
| Psychology | 5 | 27.8% |
| Social Sciences | 0 | 0.0% |
| Engineering | 2 | 11.1% |
| Multidisciplinary Studies | 0 | 0.0% |
| Science & Technology | 2 | 11.1% |
| Business | 0 | 0.0% |
| Education | 4 | 22.2% |
| Literature & Languages | 0 | 0.0% |
| Liberal Arts & History | 2 | 11.1% |
| Visual & Performing Arts | 0 | 0.0% |
| Communications | 0 | 0.0% |
| Arts & Humanities | 0 | 0.0% |
| Total | 18 | 100.0% |
Transportation & Commute in Danbury
Vehicle Availability by Sex in Danbury
The most prevalent vehicle ownership categories in Danbury are males with 5 or more vehicles (4, accounting for 33.3%) and females with 5 or more vehicles (3, making up 19.1%).
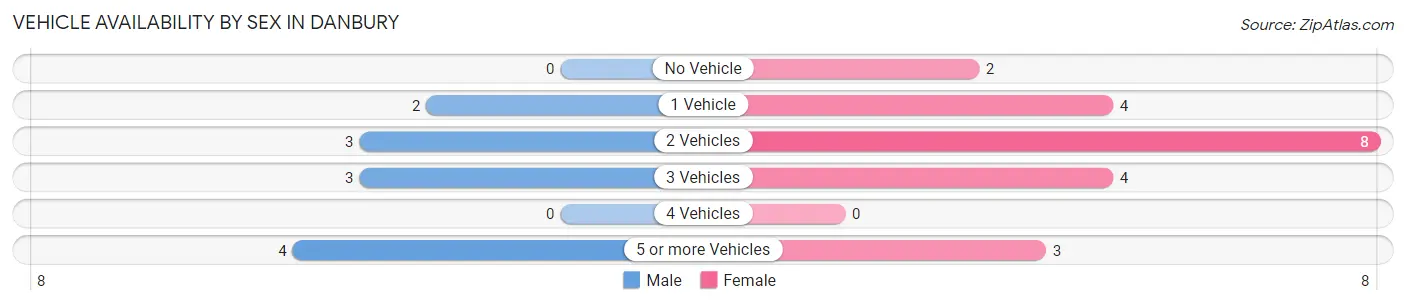
| Vehicles Available | Male | Female |
| No Vehicle | 0 (0.0%) | 2 (9.5%) |
| 1 Vehicle | 2 (16.7%) | 4 (19.1%) |
| 2 Vehicles | 3 (25.0%) | 8 (38.1%) |
| 3 Vehicles | 3 (25.0%) | 4 (19.1%) |
| 4 Vehicles | 0 (0.0%) | 0 (0.0%) |
| 5 or more Vehicles | 4 (33.3%) | 3 (14.3%) |
| Total | 12 (100.0%) | 21 (100.0%) |
Commute Time in Danbury
The most frequently occuring commute durations in Danbury are 5 to 9 minutes (11 commuters, 35.5%), 10 to 14 minutes (5 commuters, 16.1%), and 35 to 39 minutes (4 commuters, 12.9%).
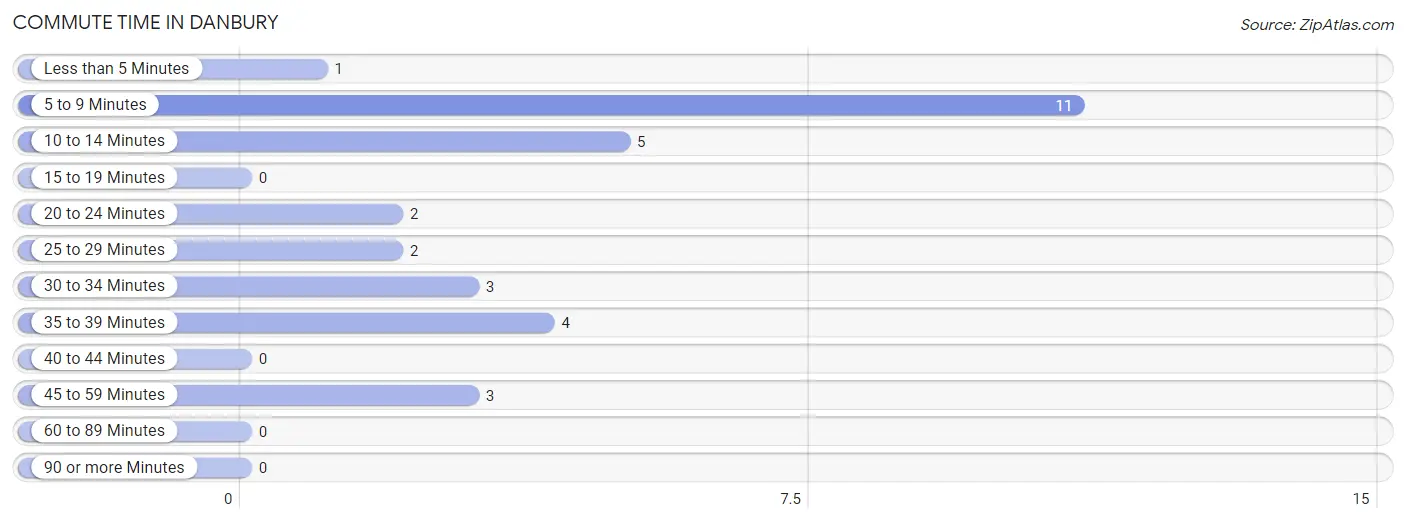
| Commute Time | # Commuters | % Commuters |
| Less than 5 Minutes | 1 | 3.2% |
| 5 to 9 Minutes | 11 | 35.5% |
| 10 to 14 Minutes | 5 | 16.1% |
| 15 to 19 Minutes | 0 | 0.0% |
| 20 to 24 Minutes | 2 | 6.5% |
| 25 to 29 Minutes | 2 | 6.5% |
| 30 to 34 Minutes | 3 | 9.7% |
| 35 to 39 Minutes | 4 | 12.9% |
| 40 to 44 Minutes | 0 | 0.0% |
| 45 to 59 Minutes | 3 | 9.7% |
| 60 to 89 Minutes | 0 | 0.0% |
| 90 or more Minutes | 0 | 0.0% |
Commute Time by Sex in Danbury
The most common commute times in Danbury are 5 to 9 minutes (6 commuters, 50.0%) for males and 5 to 9 minutes (5 commuters, 26.3%) for females.
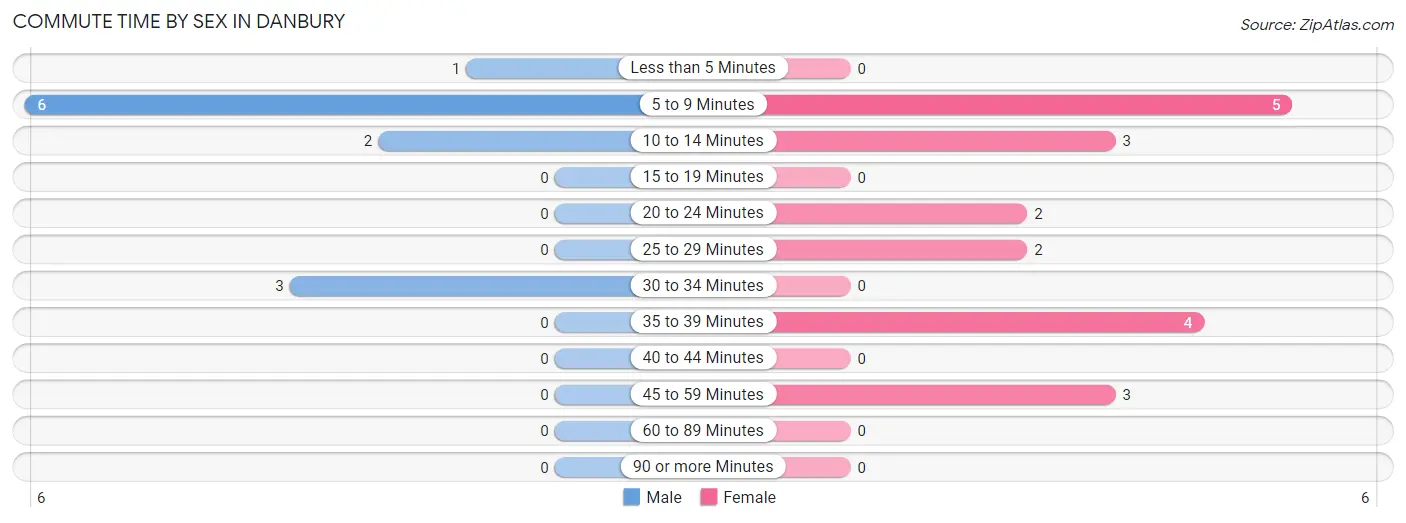
| Commute Time | Male | Female |
| Less than 5 Minutes | 1 (8.3%) | 0 (0.0%) |
| 5 to 9 Minutes | 6 (50.0%) | 5 (26.3%) |
| 10 to 14 Minutes | 2 (16.7%) | 3 (15.8%) |
| 15 to 19 Minutes | 0 (0.0%) | 0 (0.0%) |
| 20 to 24 Minutes | 0 (0.0%) | 2 (10.5%) |
| 25 to 29 Minutes | 0 (0.0%) | 2 (10.5%) |
| 30 to 34 Minutes | 3 (25.0%) | 0 (0.0%) |
| 35 to 39 Minutes | 0 (0.0%) | 4 (21.0%) |
| 40 to 44 Minutes | 0 (0.0%) | 0 (0.0%) |
| 45 to 59 Minutes | 0 (0.0%) | 3 (15.8%) |
| 60 to 89 Minutes | 0 (0.0%) | 0 (0.0%) |
| 90 or more Minutes | 0 (0.0%) | 0 (0.0%) |
Time of Departure to Work by Sex in Danbury
The most frequent times of departure to work in Danbury are 4:00 PM to 11:59 PM (4, 33.3%) for males and 7:30 AM to 7:59 AM (9, 47.4%) for females.
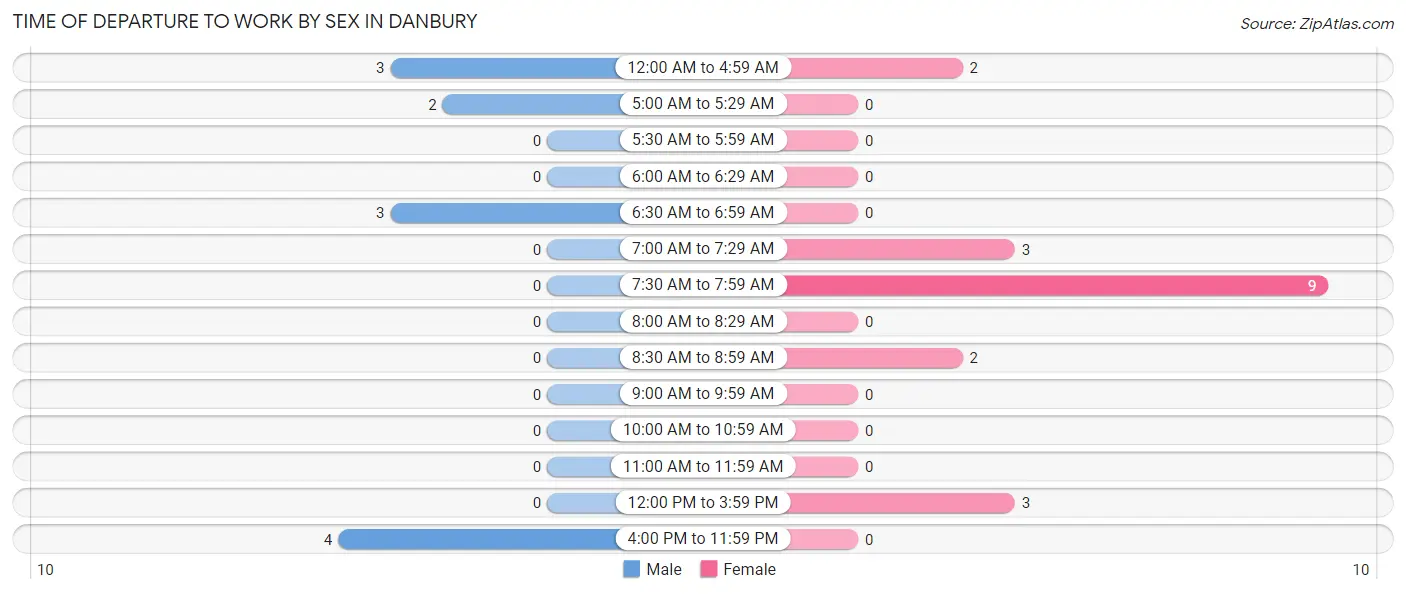
| Time of Departure | Male | Female |
| 12:00 AM to 4:59 AM | 3 (25.0%) | 2 (10.5%) |
| 5:00 AM to 5:29 AM | 2 (16.7%) | 0 (0.0%) |
| 5:30 AM to 5:59 AM | 0 (0.0%) | 0 (0.0%) |
| 6:00 AM to 6:29 AM | 0 (0.0%) | 0 (0.0%) |
| 6:30 AM to 6:59 AM | 3 (25.0%) | 0 (0.0%) |
| 7:00 AM to 7:29 AM | 0 (0.0%) | 3 (15.8%) |
| 7:30 AM to 7:59 AM | 0 (0.0%) | 9 (47.4%) |
| 8:00 AM to 8:29 AM | 0 (0.0%) | 0 (0.0%) |
| 8:30 AM to 8:59 AM | 0 (0.0%) | 2 (10.5%) |
| 9:00 AM to 9:59 AM | 0 (0.0%) | 0 (0.0%) |
| 10:00 AM to 10:59 AM | 0 (0.0%) | 0 (0.0%) |
| 11:00 AM to 11:59 AM | 0 (0.0%) | 0 (0.0%) |
| 12:00 PM to 3:59 PM | 0 (0.0%) | 3 (15.8%) |
| 4:00 PM to 11:59 PM | 4 (33.3%) | 0 (0.0%) |
| Total | 12 (100.0%) | 19 (100.0%) |
Housing Occupancy in Danbury
Occupancy by Ownership in Danbury
Of the total 45 dwellings in Danbury, owner-occupied units account for 36 (80.0%), while renter-occupied units make up 9 (20.0%).
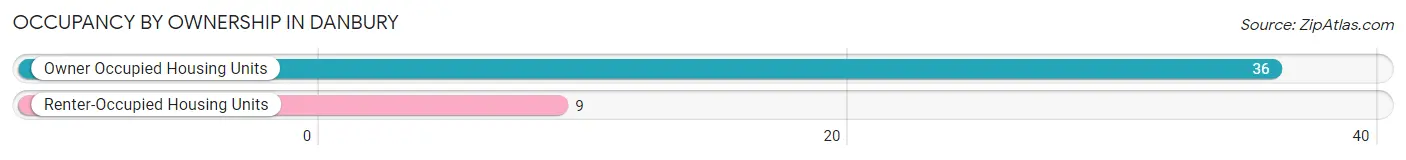
| Occupancy | # Housing Units | % Housing Units |
| Owner Occupied Housing Units | 36 | 80.0% |
| Renter-Occupied Housing Units | 9 | 20.0% |
| Total Occupied Housing Units | 45 | 100.0% |
Occupancy by Household Size in Danbury
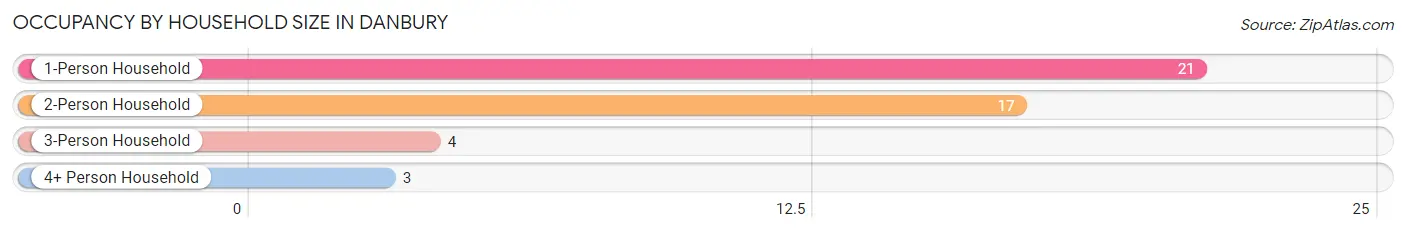
| Household Size | # Housing Units | % Housing Units |
| 1-Person Household | 21 | 46.7% |
| 2-Person Household | 17 | 37.8% |
| 3-Person Household | 4 | 8.9% |
| 4+ Person Household | 3 | 6.7% |
| Total Housing Units | 45 | 100.0% |
Occupancy by Ownership by Household Size in Danbury
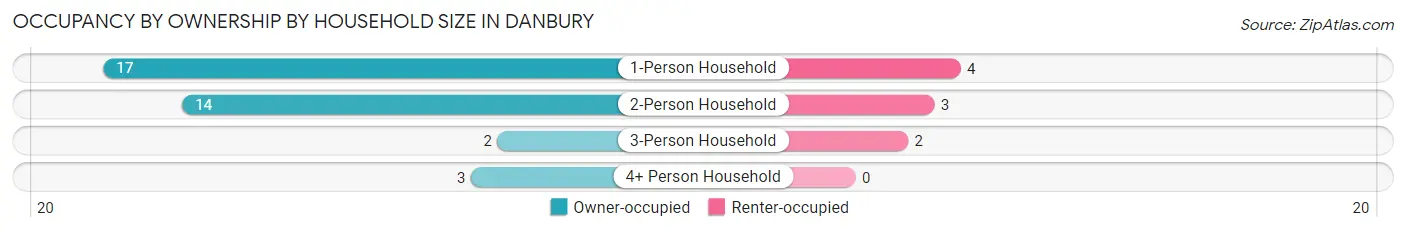
| Household Size | Owner-occupied | Renter-occupied |
| 1-Person Household | 17 (80.9%) | 4 (19.1%) |
| 2-Person Household | 14 (82.4%) | 3 (17.6%) |
| 3-Person Household | 2 (50.0%) | 2 (50.0%) |
| 4+ Person Household | 3 (100.0%) | 0 (0.0%) |
| Total Housing Units | 36 (80.0%) | 9 (20.0%) |
Occupancy by Educational Attainment in Danbury
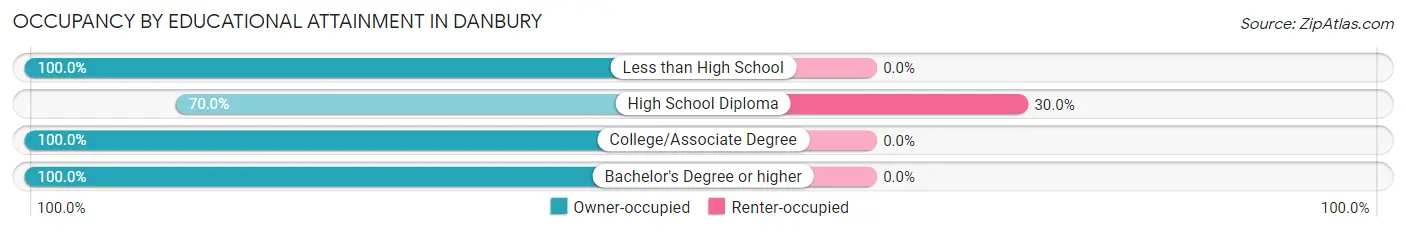
| Household Size | Owner-occupied | Renter-occupied |
| Less than High School | 1 (100.0%) | 0 (0.0%) |
| High School Diploma | 21 (70.0%) | 9 (30.0%) |
| College/Associate Degree | 8 (100.0%) | 0 (0.0%) |
| Bachelor's Degree or higher | 6 (100.0%) | 0 (0.0%) |
Occupancy by Age of Householder in Danbury
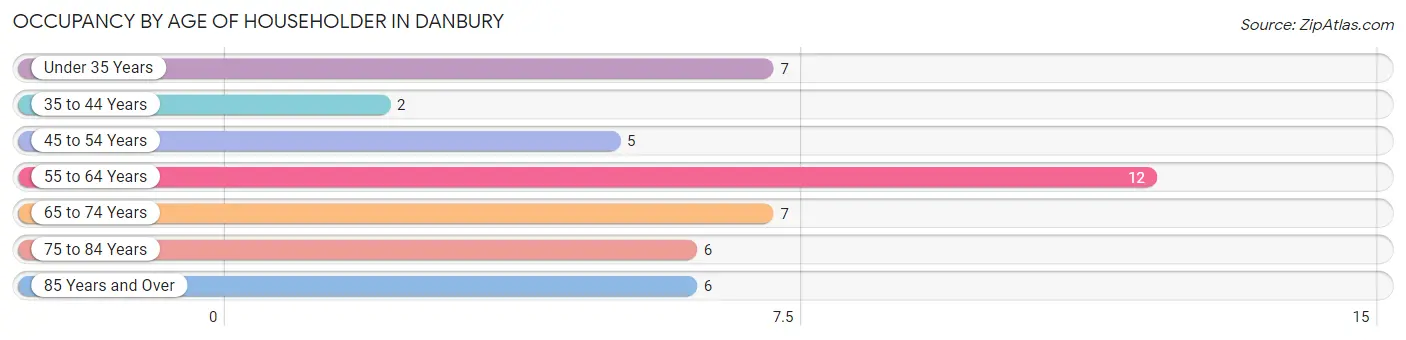
| Age Bracket | # Households | % Households |
| Under 35 Years | 7 | 15.6% |
| 35 to 44 Years | 2 | 4.4% |
| 45 to 54 Years | 5 | 11.1% |
| 55 to 64 Years | 12 | 26.7% |
| 65 to 74 Years | 7 | 15.6% |
| 75 to 84 Years | 6 | 13.3% |
| 85 Years and Over | 6 | 13.3% |
| Total | 45 | 100.0% |
Housing Finances in Danbury
Median Income by Occupancy in Danbury
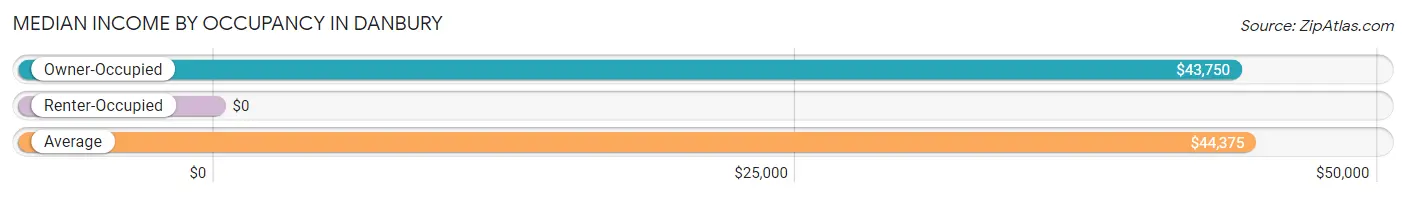
| Occupancy Type | # Households | Median Income |
| Owner-Occupied | 36 (80.0%) | $43,750 |
| Renter-Occupied | 9 (20.0%) | $0 |
| Average | 45 (100.0%) | $44,375 |
Occupancy by Householder Income Bracket in Danbury
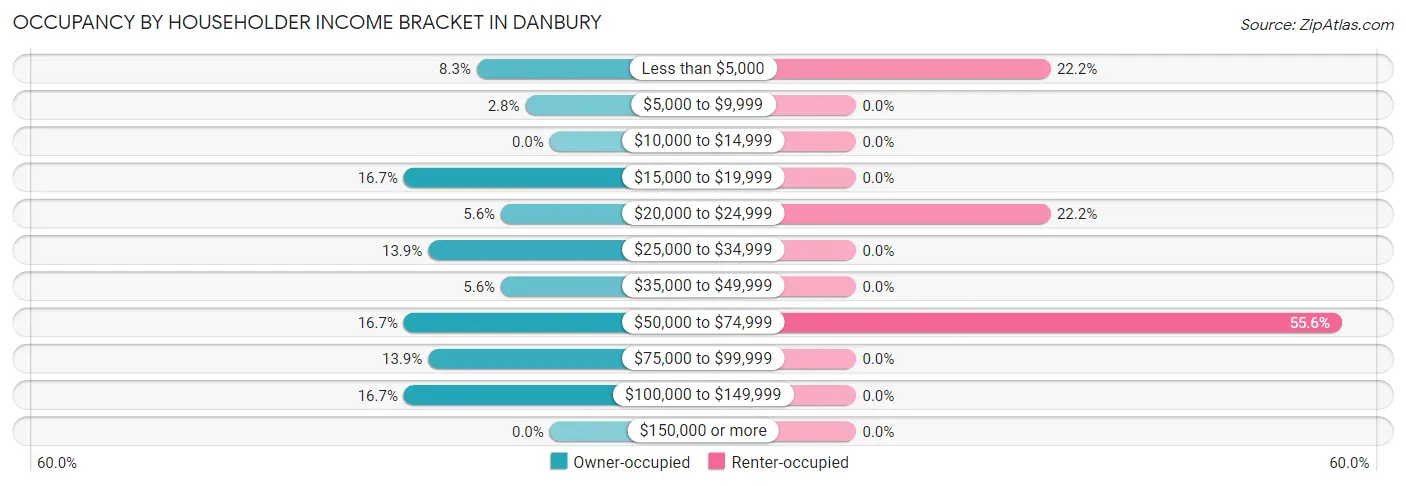
| Income Bracket | Owner-occupied | Renter-occupied |
| Less than $5,000 | 3 (8.3%) | 2 (22.2%) |
| $5,000 to $9,999 | 1 (2.8%) | 0 (0.0%) |
| $10,000 to $14,999 | 0 (0.0%) | 0 (0.0%) |
| $15,000 to $19,999 | 6 (16.7%) | 0 (0.0%) |
| $20,000 to $24,999 | 2 (5.6%) | 2 (22.2%) |
| $25,000 to $34,999 | 5 (13.9%) | 0 (0.0%) |
| $35,000 to $49,999 | 2 (5.6%) | 0 (0.0%) |
| $50,000 to $74,999 | 6 (16.7%) | 5 (55.6%) |
| $75,000 to $99,999 | 5 (13.9%) | 0 (0.0%) |
| $100,000 to $149,999 | 6 (16.7%) | 0 (0.0%) |
| $150,000 or more | 0 (0.0%) | 0 (0.0%) |
| Total | 36 (100.0%) | 9 (100.0%) |
Monthly Housing Cost Tiers in Danbury
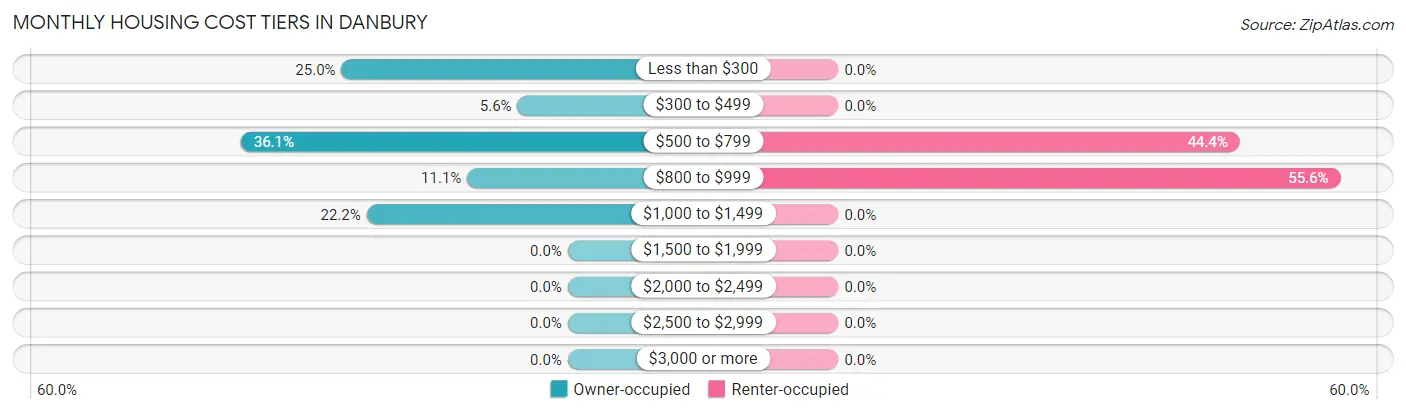
| Monthly Cost | Owner-occupied | Renter-occupied |
| Less than $300 | 9 (25.0%) | 0 (0.0%) |
| $300 to $499 | 2 (5.6%) | 0 (0.0%) |
| $500 to $799 | 13 (36.1%) | 4 (44.4%) |
| $800 to $999 | 4 (11.1%) | 5 (55.6%) |
| $1,000 to $1,499 | 8 (22.2%) | 0 (0.0%) |
| $1,500 to $1,999 | 0 (0.0%) | 0 (0.0%) |
| $2,000 to $2,499 | 0 (0.0%) | 0 (0.0%) |
| $2,500 to $2,999 | 0 (0.0%) | 0 (0.0%) |
| $3,000 or more | 0 (0.0%) | 0 (0.0%) |
| Total | 36 (100.0%) | 9 (100.0%) |
Physical Housing Characteristics in Danbury
Housing Structures in Danbury
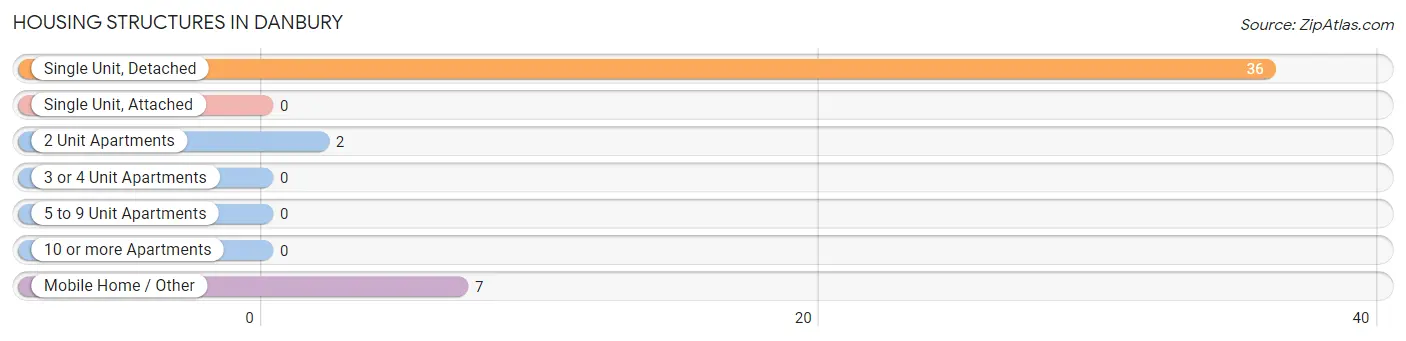
| Structure Type | # Housing Units | % Housing Units |
| Single Unit, Detached | 36 | 80.0% |
| Single Unit, Attached | 0 | 0.0% |
| 2 Unit Apartments | 2 | 4.4% |
| 3 or 4 Unit Apartments | 0 | 0.0% |
| 5 to 9 Unit Apartments | 0 | 0.0% |
| 10 or more Apartments | 0 | 0.0% |
| Mobile Home / Other | 7 | 15.6% |
| Total | 45 | 100.0% |
Housing Structures by Occupancy in Danbury
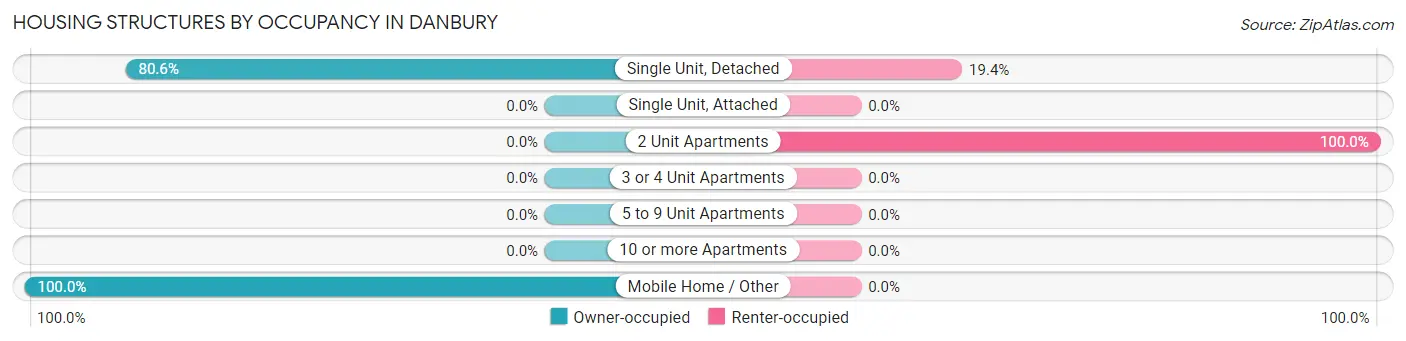
| Structure Type | Owner-occupied | Renter-occupied |
| Single Unit, Detached | 29 (80.6%) | 7 (19.4%) |
| Single Unit, Attached | 0 (0.0%) | 0 (0.0%) |
| 2 Unit Apartments | 0 (0.0%) | 2 (100.0%) |
| 3 or 4 Unit Apartments | 0 (0.0%) | 0 (0.0%) |
| 5 to 9 Unit Apartments | 0 (0.0%) | 0 (0.0%) |
| 10 or more Apartments | 0 (0.0%) | 0 (0.0%) |
| Mobile Home / Other | 7 (100.0%) | 0 (0.0%) |
| Total | 36 (80.0%) | 9 (20.0%) |
Housing Structures by Number of Rooms in Danbury
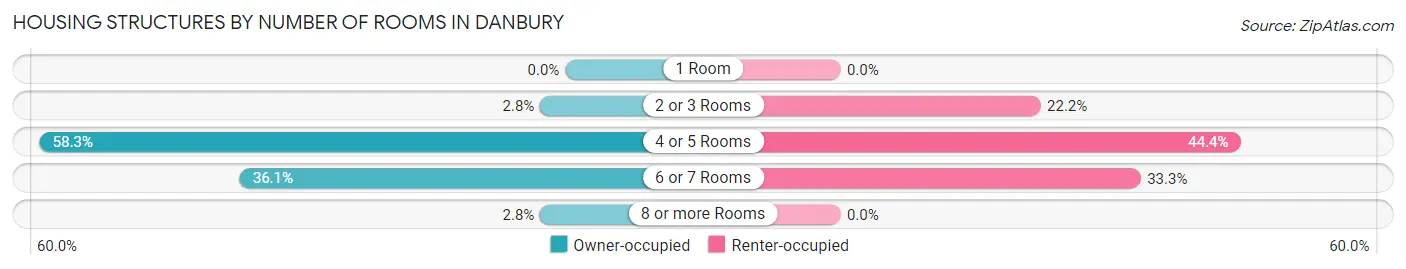
| Number of Rooms | Owner-occupied | Renter-occupied |
| 1 Room | 0 (0.0%) | 0 (0.0%) |
| 2 or 3 Rooms | 1 (2.8%) | 2 (22.2%) |
| 4 or 5 Rooms | 21 (58.3%) | 4 (44.4%) |
| 6 or 7 Rooms | 13 (36.1%) | 3 (33.3%) |
| 8 or more Rooms | 1 (2.8%) | 0 (0.0%) |
| Total | 36 (100.0%) | 9 (100.0%) |
Housing Structure by Heating Type in Danbury
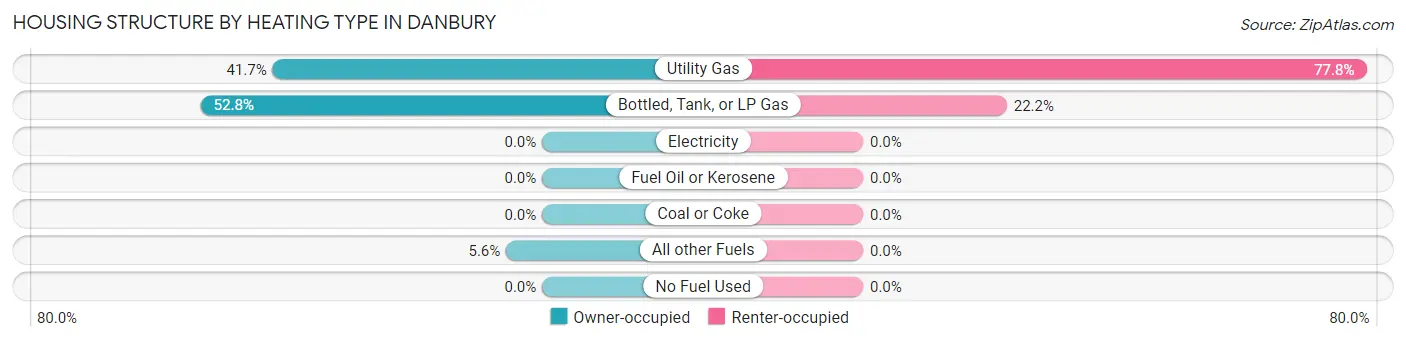
| Heating Type | Owner-occupied | Renter-occupied |
| Utility Gas | 15 (41.7%) | 7 (77.8%) |
| Bottled, Tank, or LP Gas | 19 (52.8%) | 2 (22.2%) |
| Electricity | 0 (0.0%) | 0 (0.0%) |
| Fuel Oil or Kerosene | 0 (0.0%) | 0 (0.0%) |
| Coal or Coke | 0 (0.0%) | 0 (0.0%) |
| All other Fuels | 2 (5.6%) | 0 (0.0%) |
| No Fuel Used | 0 (0.0%) | 0 (0.0%) |
| Total | 36 (100.0%) | 9 (100.0%) |
Household Vehicle Usage in Danbury
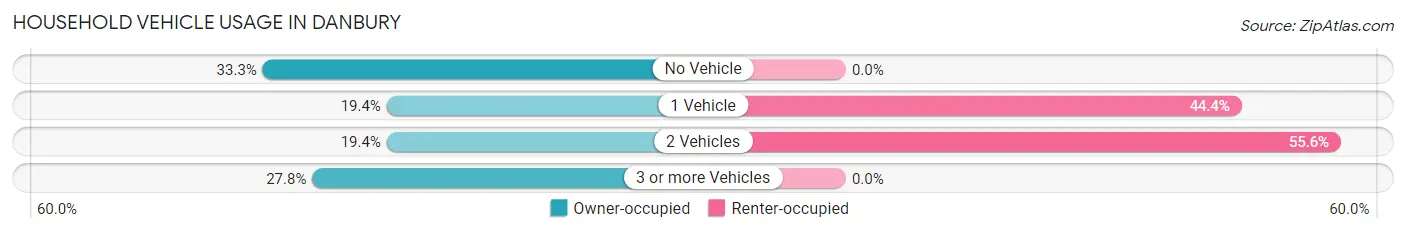
| Vehicles per Household | Owner-occupied | Renter-occupied |
| No Vehicle | 12 (33.3%) | 0 (0.0%) |
| 1 Vehicle | 7 (19.4%) | 4 (44.4%) |
| 2 Vehicles | 7 (19.4%) | 5 (55.6%) |
| 3 or more Vehicles | 10 (27.8%) | 0 (0.0%) |
| Total | 36 (100.0%) | 9 (100.0%) |
Real Estate & Mortgages in Danbury
Real Estate and Mortgage Overview in Danbury
| Characteristic | Without Mortgage | With Mortgage |
| Housing Units | 21 | 15 |
| Median Property Value | $77,500 | $110,400 |
| Median Household Income | - | - |
| Monthly Housing Costs | $388 | $0 |
| Real Estate Taxes | - | - |
Property Value by Mortgage Status in Danbury
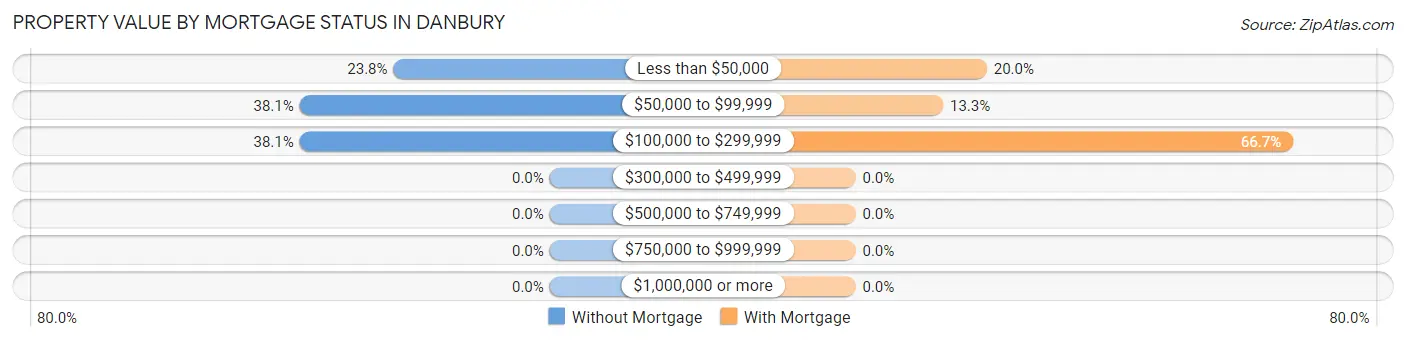
| Property Value | Without Mortgage | With Mortgage |
| Less than $50,000 | 5 (23.8%) | 3 (20.0%) |
| $50,000 to $99,999 | 8 (38.1%) | 2 (13.3%) |
| $100,000 to $299,999 | 8 (38.1%) | 10 (66.7%) |
| $300,000 to $499,999 | 0 (0.0%) | 0 (0.0%) |
| $500,000 to $749,999 | 0 (0.0%) | 0 (0.0%) |
| $750,000 to $999,999 | 0 (0.0%) | 0 (0.0%) |
| $1,000,000 or more | 0 (0.0%) | 0 (0.0%) |
| Total | 21 (100.0%) | 15 (100.0%) |
Household Income by Mortgage Status in Danbury
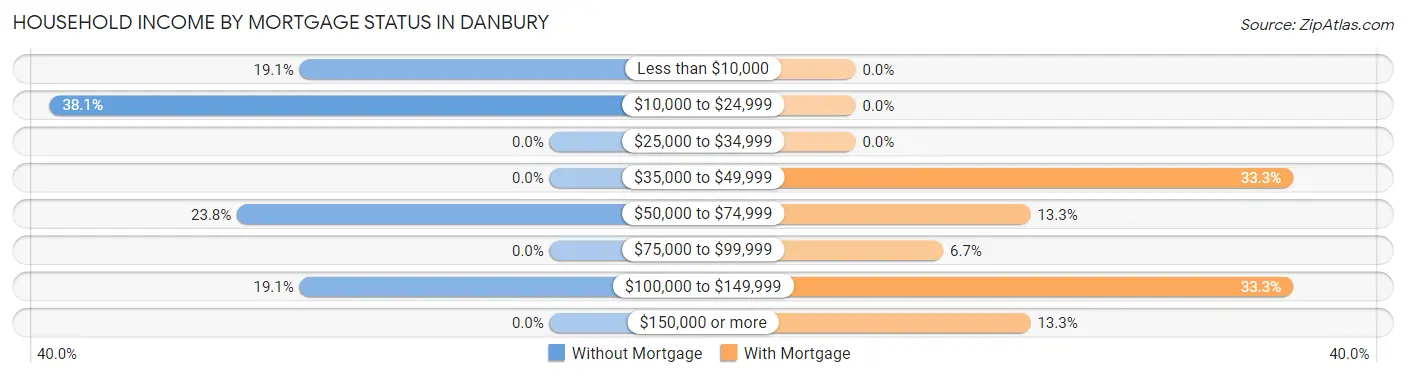
| Household Income | Without Mortgage | With Mortgage |
| Less than $10,000 | 4 (19.1%) | 0 (0.0%) |
| $10,000 to $24,999 | 8 (38.1%) | 0 (0.0%) |
| $25,000 to $34,999 | 0 (0.0%) | 0 (0.0%) |
| $35,000 to $49,999 | 0 (0.0%) | 5 (33.3%) |
| $50,000 to $74,999 | 5 (23.8%) | 2 (13.3%) |
| $75,000 to $99,999 | 0 (0.0%) | 1 (6.7%) |
| $100,000 to $149,999 | 4 (19.1%) | 5 (33.3%) |
| $150,000 or more | 0 (0.0%) | 2 (13.3%) |
| Total | 21 (100.0%) | 15 (100.0%) |
Property Value to Household Income Ratio in Danbury
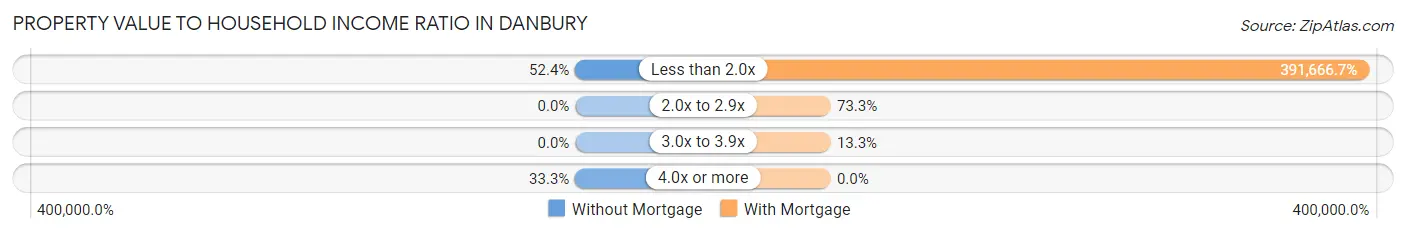
| Value-to-Income Ratio | Without Mortgage | With Mortgage |
| Less than 2.0x | 11 (52.4%) | 58,750 (391,666.7%) |
| 2.0x to 2.9x | 0 (0.0%) | 11 (73.3%) |
| 3.0x to 3.9x | 0 (0.0%) | 2 (13.3%) |
| 4.0x or more | 7 (33.3%) | 0 (0.0%) |
| Total | 21 (100.0%) | 15 (100.0%) |
Real Estate Taxes by Mortgage Status in Danbury
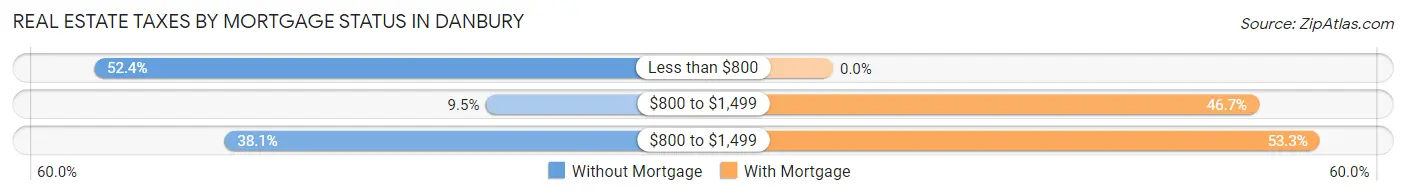
| Property Taxes | Without Mortgage | With Mortgage |
| Less than $800 | 11 (52.4%) | 0 (0.0%) |
| $800 to $1,499 | 2 (9.5%) | 7 (46.7%) |
| $800 to $1,499 | 8 (38.1%) | 8 (53.3%) |
| Total | 21 (100.0%) | 15 (100.0%) |
Health & Disability in Danbury
Health Insurance Coverage by Age in Danbury
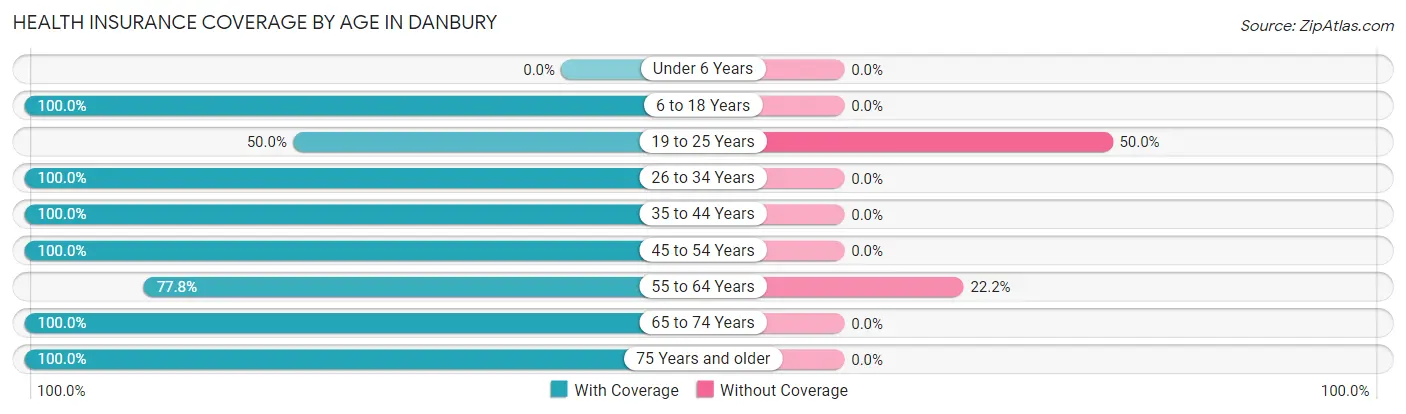
| Age Bracket | With Coverage | Without Coverage |
| Under 6 Years | 0 (0.0%) | 0 (0.0%) |
| 6 to 18 Years | 9 (100.0%) | 0 (0.0%) |
| 19 to 25 Years | 4 (50.0%) | 4 (50.0%) |
| 26 to 34 Years | 8 (100.0%) | 0 (0.0%) |
| 35 to 44 Years | 7 (100.0%) | 0 (0.0%) |
| 45 to 54 Years | 9 (100.0%) | 0 (0.0%) |
| 55 to 64 Years | 14 (77.8%) | 4 (22.2%) |
| 65 to 74 Years | 16 (100.0%) | 0 (0.0%) |
| 75 Years and older | 17 (100.0%) | 0 (0.0%) |
| Total | 84 (91.3%) | 8 (8.7%) |
Health Insurance Coverage by Citizenship Status in Danbury
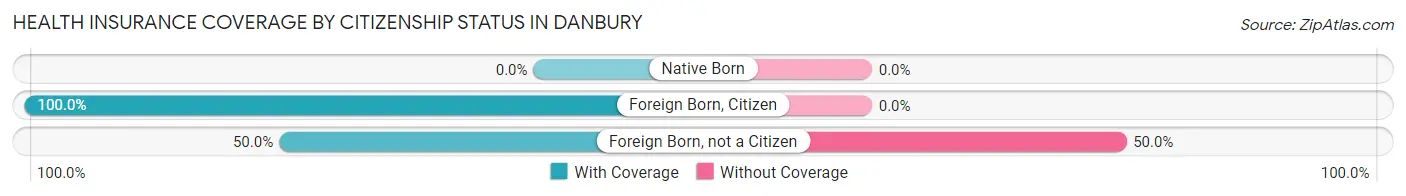
| Citizenship Status | With Coverage | Without Coverage |
| Native Born | 0 (0.0%) | 0 (0.0%) |
| Foreign Born, Citizen | 9 (100.0%) | 0 (0.0%) |
| Foreign Born, not a Citizen | 4 (50.0%) | 4 (50.0%) |
Health Insurance Coverage by Household Income in Danbury
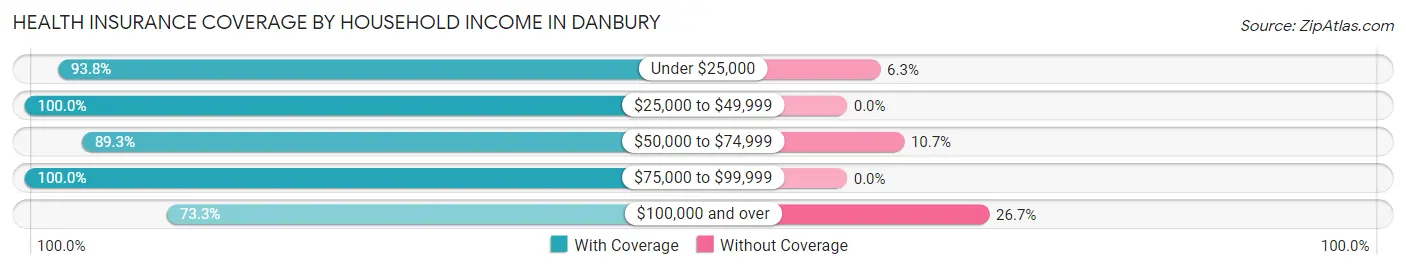
| Household Income | With Coverage | Without Coverage |
| Under $25,000 | 15 (93.8%) | 1 (6.2%) |
| $25,000 to $49,999 | 11 (100.0%) | 0 (0.0%) |
| $50,000 to $74,999 | 25 (89.3%) | 3 (10.7%) |
| $75,000 to $99,999 | 22 (100.0%) | 0 (0.0%) |
| $100,000 and over | 11 (73.3%) | 4 (26.7%) |
Public vs Private Health Insurance Coverage by Age in Danbury
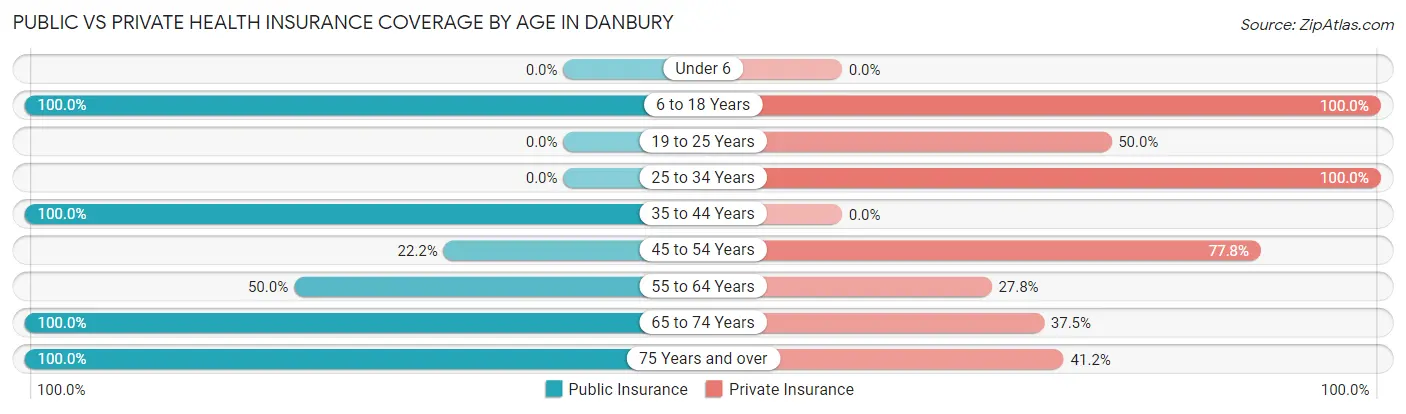
| Age Bracket | Public Insurance | Private Insurance |
| Under 6 | 0 (0.0%) | 0 (0.0%) |
| 6 to 18 Years | 9 (100.0%) | 9 (100.0%) |
| 19 to 25 Years | 0 (0.0%) | 4 (50.0%) |
| 25 to 34 Years | 0 (0.0%) | 8 (100.0%) |
| 35 to 44 Years | 7 (100.0%) | 0 (0.0%) |
| 45 to 54 Years | 2 (22.2%) | 7 (77.8%) |
| 55 to 64 Years | 9 (50.0%) | 5 (27.8%) |
| 65 to 74 Years | 16 (100.0%) | 6 (37.5%) |
| 75 Years and over | 17 (100.0%) | 7 (41.2%) |
| Total | 60 (65.2%) | 46 (50.0%) |
Disability Status by Sex by Age in Danbury
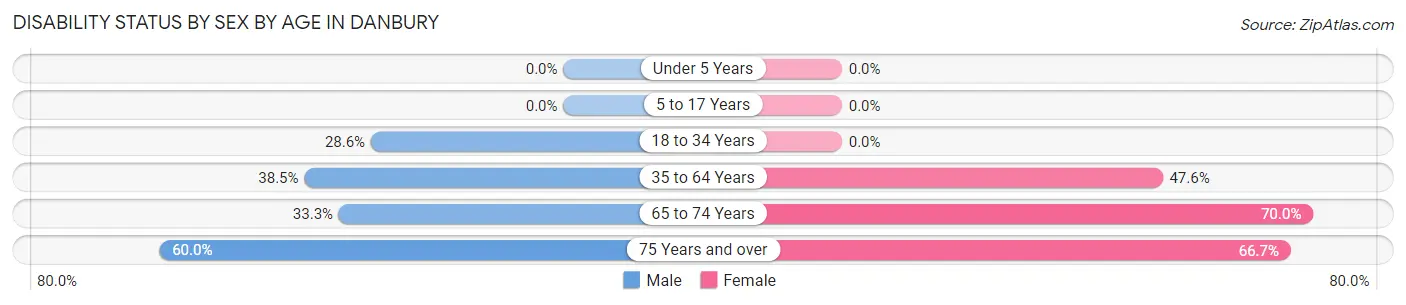
| Age Bracket | Male | Female |
| Under 5 Years | 0 (0.0%) | 0 (0.0%) |
| 5 to 17 Years | 0 (0.0%) | 0 (0.0%) |
| 18 to 34 Years | 2 (28.6%) | 0 (0.0%) |
| 35 to 64 Years | 5 (38.5%) | 10 (47.6%) |
| 65 to 74 Years | 2 (33.3%) | 7 (70.0%) |
| 75 Years and over | 3 (60.0%) | 8 (66.7%) |
Disability Class by Sex by Age in Danbury
Disability Class: Hearing Difficulty
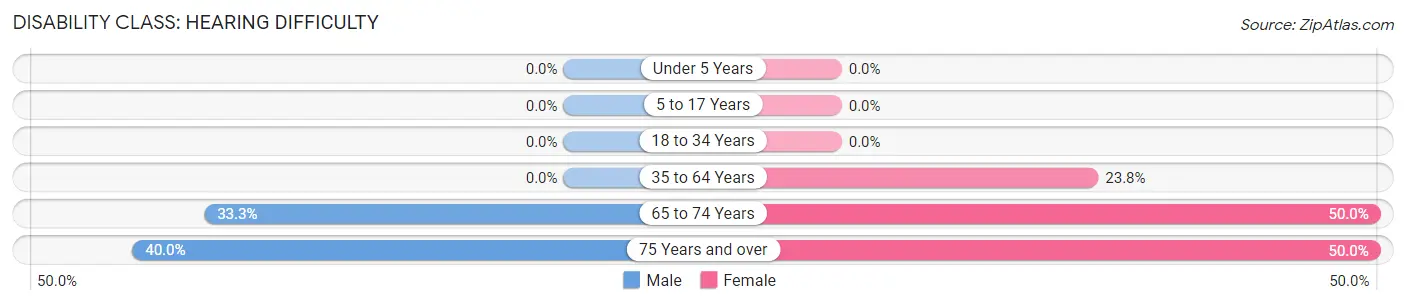
| Age Bracket | Male | Female |
| Under 5 Years | 0 (0.0%) | 0 (0.0%) |
| 5 to 17 Years | 0 (0.0%) | 0 (0.0%) |
| 18 to 34 Years | 0 (0.0%) | 0 (0.0%) |
| 35 to 64 Years | 0 (0.0%) | 5 (23.8%) |
| 65 to 74 Years | 2 (33.3%) | 5 (50.0%) |
| 75 Years and over | 2 (40.0%) | 6 (50.0%) |
Disability Class: Vision Difficulty
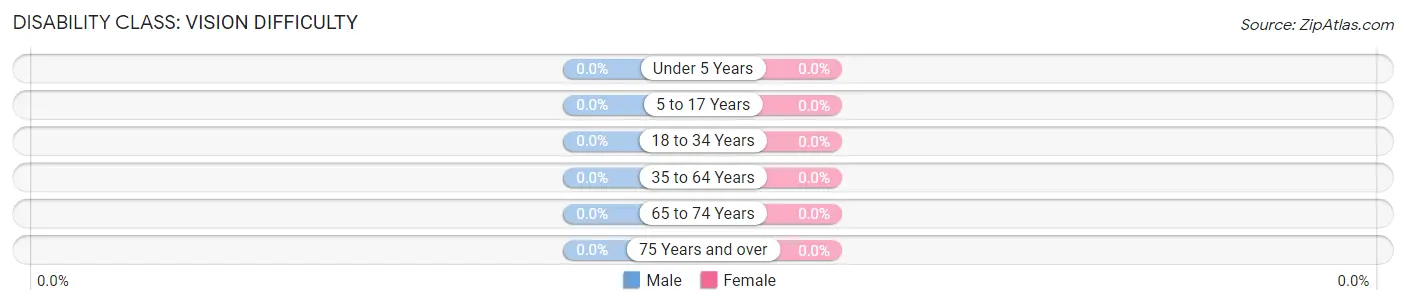
| Age Bracket | Male | Female |
| Under 5 Years | 0 (0.0%) | 0 (0.0%) |
| 5 to 17 Years | 0 (0.0%) | 0 (0.0%) |
| 18 to 34 Years | 0 (0.0%) | 0 (0.0%) |
| 35 to 64 Years | 0 (0.0%) | 0 (0.0%) |
| 65 to 74 Years | 0 (0.0%) | 0 (0.0%) |
| 75 Years and over | 0 (0.0%) | 0 (0.0%) |
Disability Class: Cognitive Difficulty
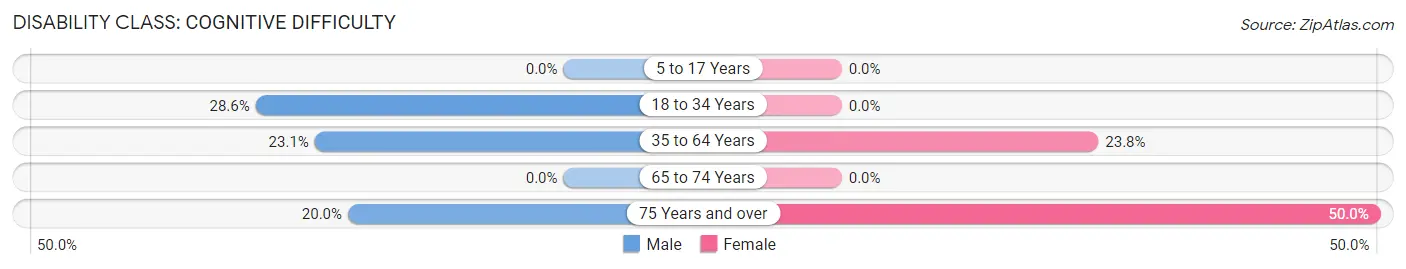
| Age Bracket | Male | Female |
| 5 to 17 Years | 0 (0.0%) | 0 (0.0%) |
| 18 to 34 Years | 2 (28.6%) | 0 (0.0%) |
| 35 to 64 Years | 3 (23.1%) | 5 (23.8%) |
| 65 to 74 Years | 0 (0.0%) | 0 (0.0%) |
| 75 Years and over | 1 (20.0%) | 6 (50.0%) |
Disability Class: Ambulatory Difficulty
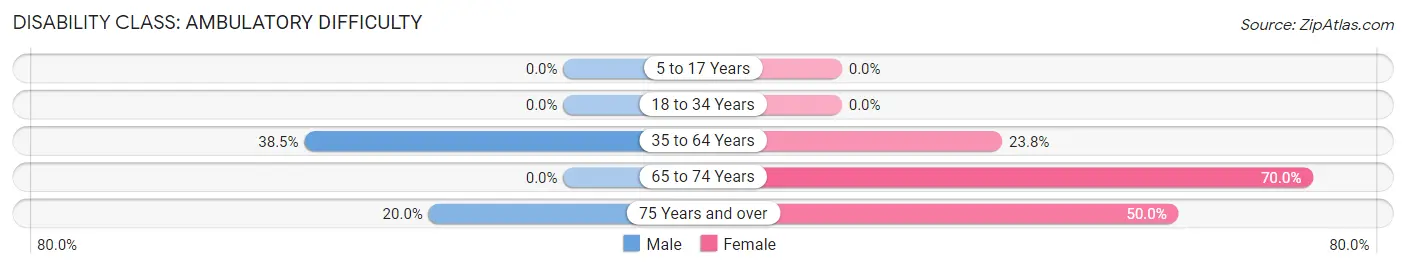
| Age Bracket | Male | Female |
| 5 to 17 Years | 0 (0.0%) | 0 (0.0%) |
| 18 to 34 Years | 0 (0.0%) | 0 (0.0%) |
| 35 to 64 Years | 5 (38.5%) | 5 (23.8%) |
| 65 to 74 Years | 0 (0.0%) | 7 (70.0%) |
| 75 Years and over | 1 (20.0%) | 6 (50.0%) |
Disability Class: Self-Care Difficulty
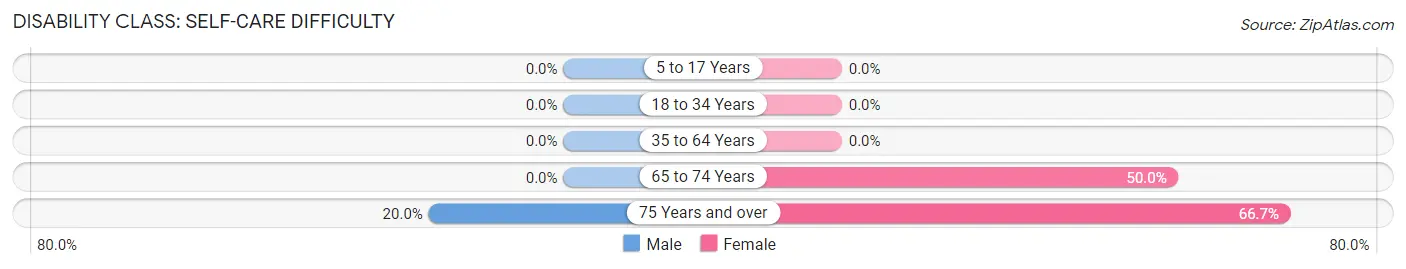
| Age Bracket | Male | Female |
| 5 to 17 Years | 0 (0.0%) | 0 (0.0%) |
| 18 to 34 Years | 0 (0.0%) | 0 (0.0%) |
| 35 to 64 Years | 0 (0.0%) | 0 (0.0%) |
| 65 to 74 Years | 0 (0.0%) | 5 (50.0%) |
| 75 Years and over | 1 (20.0%) | 8 (66.7%) |
Technology Access in Danbury
Computing Device Access in Danbury
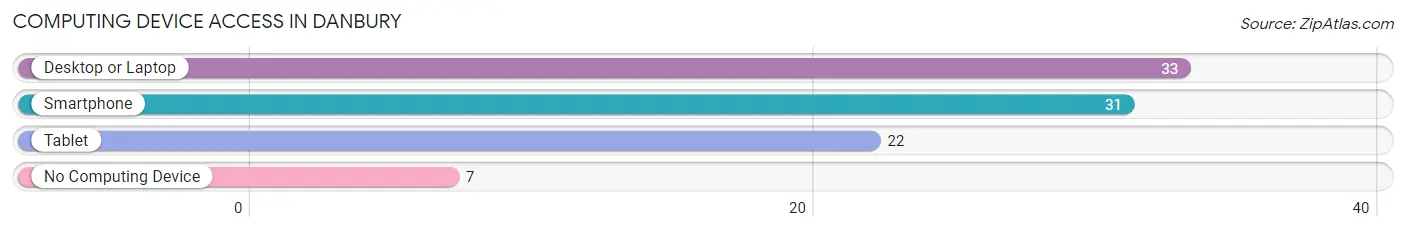
| Device Type | # Households | % Households |
| Desktop or Laptop | 33 | 73.3% |
| Smartphone | 31 | 68.9% |
| Tablet | 22 | 48.9% |
| No Computing Device | 7 | 15.6% |
| Total | 45 | 100.0% |
Internet Access in Danbury
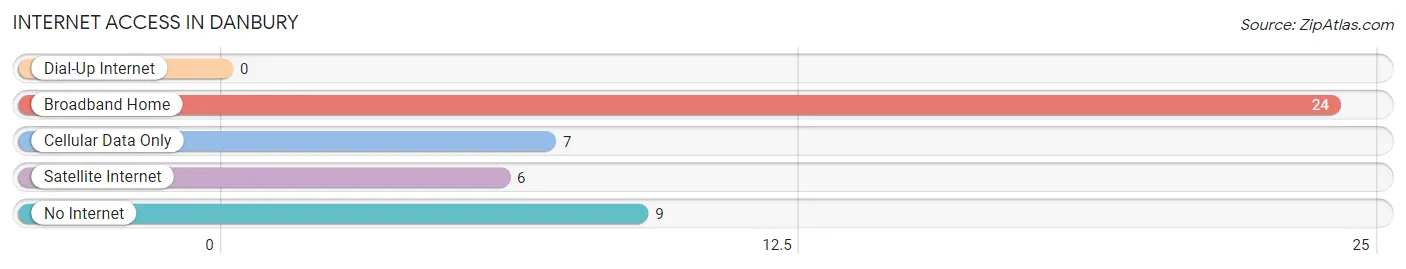
| Internet Type | # Households | % Households |
| Dial-Up Internet | 0 | 0.0% |
| Broadband Home | 24 | 53.3% |
| Cellular Data Only | 7 | 15.6% |
| Satellite Internet | 6 | 13.3% |
| No Internet | 9 | 20.0% |
| Total | 45 | 100.0% |
Danbury Summary
Danbury, Wisconsin is a small town located in Burnett County, Wisconsin. It is situated on the western shore of the Namekagon River, and is part of the Twin Cities metropolitan area. The town has a population of approximately 1,000 people, and is known for its rural charm and natural beauty.
History
The area that is now Danbury was first settled in the late 1800s by a group of Swedish immigrants. The town was originally known as “Swedish Settlement”, and was later renamed Danbury after the nearby town of Danbury, Connecticut. The town was officially incorporated in 1891.
In the early 1900s, Danbury was a thriving logging and farming community. The town was home to several sawmills, and the surrounding area was heavily logged. The town also had a thriving dairy industry, and was home to several cheese factories.
In the 1950s, the town began to decline as the logging industry declined and the dairy industry moved away. The town was also affected by the construction of the St. Croix River Dam, which flooded much of the surrounding area.
Geography
Danbury is located in western Wisconsin, in Burnett County. It is situated on the western shore of the Namekagon River, and is part of the Twin Cities metropolitan area. The town is located approximately 30 miles east of Minneapolis, and is bordered by the towns of Webster, Grantsburg, and Siren.
The town has a total area of 1.2 square miles, all of which is land. The terrain is mostly flat, with some rolling hills. The town is located in a heavily forested area, and is home to several lakes and rivers.
Economy
The economy of Danbury is largely based on tourism and recreation. The town is home to several resorts and campgrounds, and is a popular destination for fishing, hunting, and other outdoor activities. The town is also home to several small businesses, including restaurants, shops, and a grocery store.
Demographics
As of the 2010 census, the population of Danbury was 1,000 people. The racial makeup of the town was 97.2% White, 0.7% African American, 0.3% Native American, 0.2% Asian, 0.1% Pacific Islander, 0.7% from other races, and 0.9% from two or more races. Hispanic or Latino of any race were 1.7% of the population.
The median household income in Danbury was $41,250, and the median family income was $45,833. The per capita income for the town was $19,945. About 8.3% of families and 10.2% of the population were below the poverty line, including 14.3% of those under age 18 and 6.3% of those age 65 or over.
Common Questions
What is Per Capita Income in Danbury?
Per Capita income in Danbury is $25,995.
What is the Median Family Income in Danbury?
Median Family Income in Danbury is $68,750.
What is the Median Household income in Danbury?
Median Household Income in Danbury is $44,375.
What is Inequality or Gini Index in Danbury?
Inequality or Gini Index in Danbury is 0.41.
What is the Total Population of Danbury?
Total Population of Danbury is 92.
What is the Total Male Population of Danbury?
Total Male Population of Danbury is 36.
What is the Total Female Population of Danbury?
Total Female Population of Danbury is 56.
What is the Ratio of Males per 100 Females in Danbury?
There are 64.29 Males per 100 Females in Danbury.
What is the Ratio of Females per 100 Males in Danbury?
There are 155.56 Females per 100 Males in Danbury.
What is the Median Population Age in Danbury?
Median Population Age in Danbury is 60.0 Years.
What is the Average Family Size in Danbury
Average Family Size in Danbury is 2.5 People.
What is the Average Household Size in Danbury
Average Household Size in Danbury is 2.0 People.
How Large is the Labor Force in Danbury?
There are 40 People in the Labor Forcein in Danbury.
What is the Percentage of People in the Labor Force in Danbury?
48.2% of People are in the Labor Force in Danbury.
What is the Unemployment Rate in Danbury?
Unemployment Rate in Danbury is 12.5%.