Zip Codes with the Highest Percentage of Population Employed in Life, Physical & Social Science in Bellevue, WA
RELATED REPORTS & OPTIONS
Life, Physical & Social Science
Bellevue
Compare Zip Codes
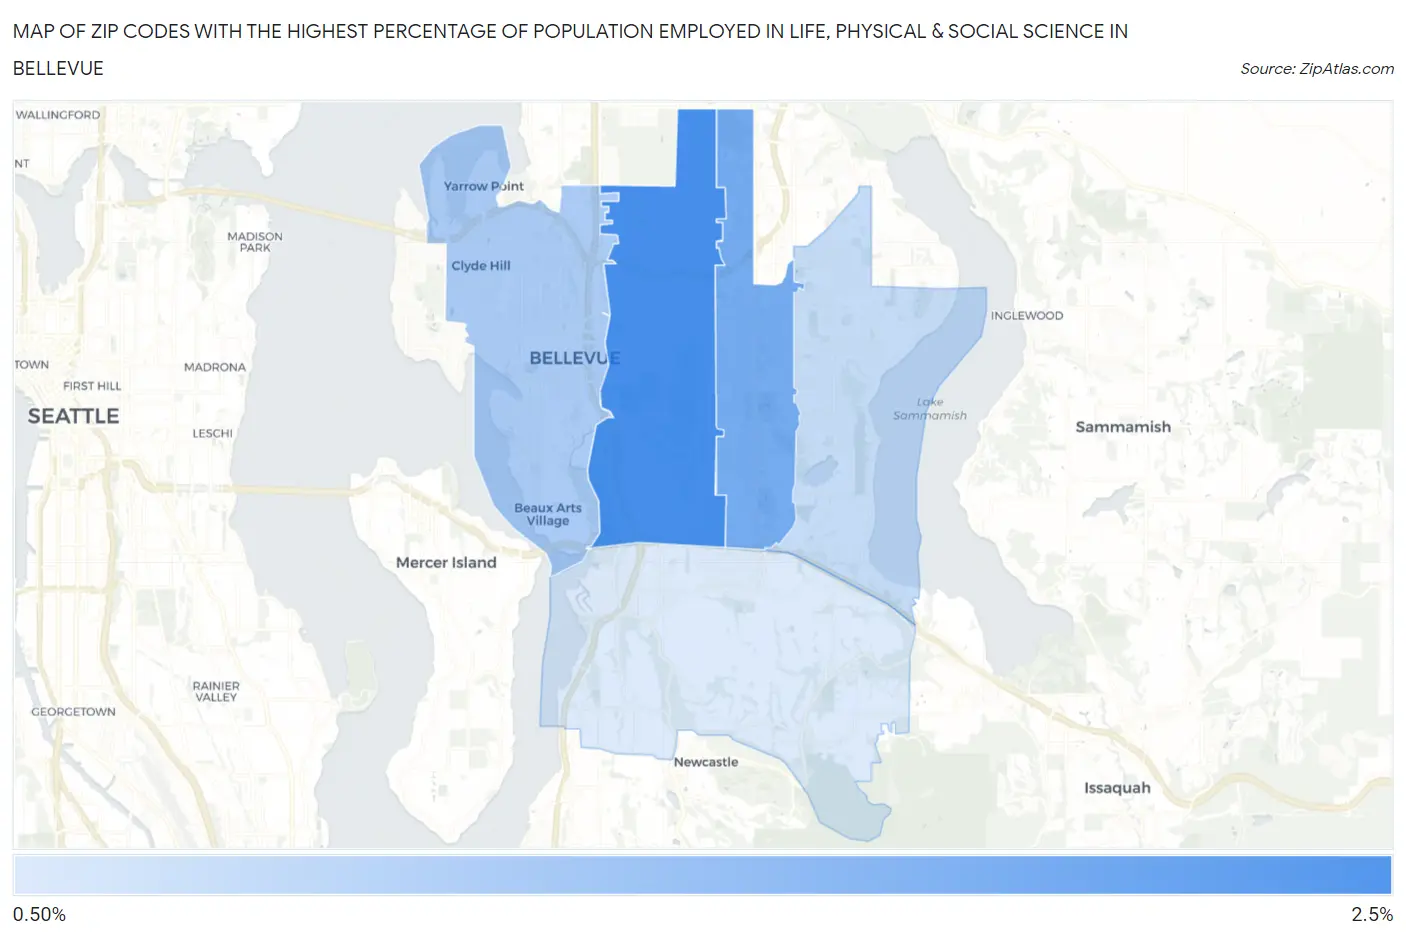
Map of Zip Codes with the Highest Percentage of Population Employed in Life, Physical & Social Science in Bellevue
0.73%
2.1%
Zip Codes with the Highest Percentage of Population Employed in Life, Physical & Social Science in Bellevue, WA
| Zip Code | % Employed | vs State | vs National | |
| 1. | 98005 | 2.1% | 1.3%(+0.754)#101 | 1.1%(+0.974)#3,502 |
| 2. | 98007 | 1.6% | 1.3%(+0.332)#133 | 1.1%(+0.552)#4,981 |
| 3. | 98004 | 1.2% | 1.3%(-0.127)#201 | 1.1%(+0.093)#7,606 |
| 4. | 98008 | 0.94% | 1.3%(-0.371)#235 | 1.1%(-0.151)#9,572 |
| 5. | 98006 | 0.73% | 1.3%(-0.580)#282 | 1.1%(-0.360)#11,702 |
1
Common Questions
What are the Top 3 Zip Codes with the Highest Percentage of Population Employed in Life, Physical & Social Science in Bellevue, WA?
Top 3 Zip Codes with the Highest Percentage of Population Employed in Life, Physical & Social Science in Bellevue, WA are:
What zip code has the Highest Percentage of Population Employed in Life, Physical & Social Science in Bellevue, WA?
98005 has the Highest Percentage of Population Employed in Life, Physical & Social Science in Bellevue, WA with 2.1%.
What is the Percentage of Population Employed in Life, Physical & Social Science in Bellevue, WA?
Percentage of Population Employed in Life, Physical & Social Science in Bellevue is 1.3%.
What is the Percentage of Population Employed in Life, Physical & Social Science in Washington?
Percentage of Population Employed in Life, Physical & Social Science in Washington is 1.3%.
What is the Percentage of Population Employed in Life, Physical & Social Science in the United States?
Percentage of Population Employed in Life, Physical & Social Science in the United States is 1.1%.