Zip Codes with the Highest Percentage of Population Employed in Life, Physical & Social Science in Redmond, WA
RELATED REPORTS & OPTIONS
Life, Physical & Social Science
Redmond
Compare Zip Codes
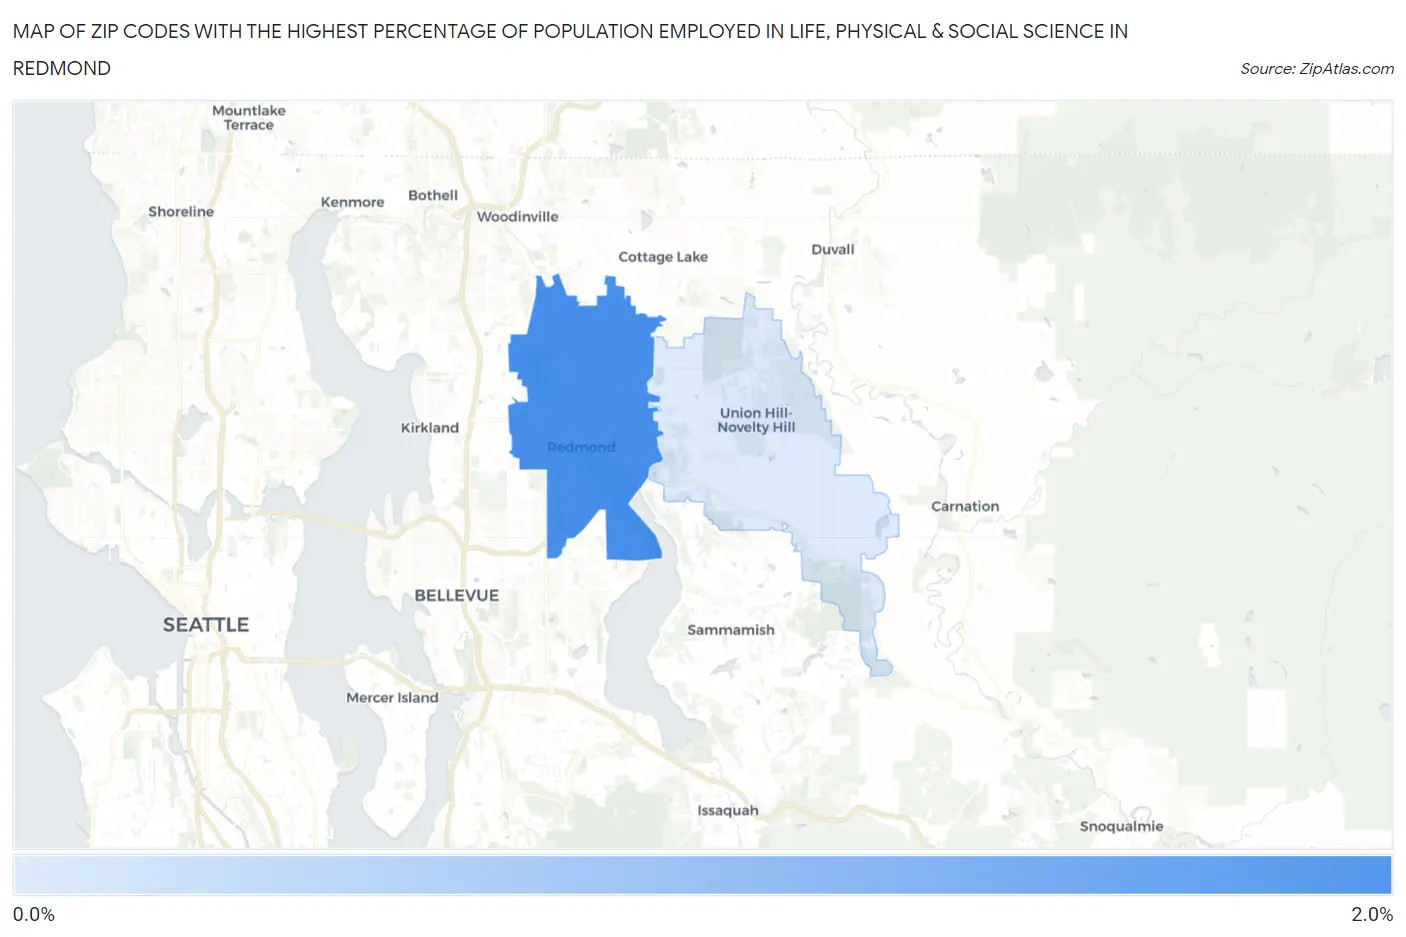
Map of Zip Codes with the Highest Percentage of Population Employed in Life, Physical & Social Science in Redmond
0.61%
1.5%
Zip Codes with the Highest Percentage of Population Employed in Life, Physical & Social Science in Redmond, WA
| Zip Code | % Employed | vs State | vs National | |
| 1. | 98052 | 1.5% | 1.3%(+0.203)#146 | 1.1%(+0.423)#5,582 |
| 2. | 98053 | 0.61% | 1.3%(-0.700)#314 | 1.1%(-0.480)#13,147 |
1
Common Questions
What are the Top Zip Codes with the Highest Percentage of Population Employed in Life, Physical & Social Science in Redmond, WA?
Top Zip Codes with the Highest Percentage of Population Employed in Life, Physical & Social Science in Redmond, WA are:
What zip code has the Highest Percentage of Population Employed in Life, Physical & Social Science in Redmond, WA?
98052 has the Highest Percentage of Population Employed in Life, Physical & Social Science in Redmond, WA with 1.5%.
What is the Percentage of Population Employed in Life, Physical & Social Science in Redmond, WA?
Percentage of Population Employed in Life, Physical & Social Science in Redmond is 1.4%.
What is the Percentage of Population Employed in Life, Physical & Social Science in Washington?
Percentage of Population Employed in Life, Physical & Social Science in Washington is 1.3%.
What is the Percentage of Population Employed in Life, Physical & Social Science in the United States?
Percentage of Population Employed in Life, Physical & Social Science in the United States is 1.1%.