Zip Codes with the Highest Percentage of Population Employed in Life, Physical & Social Science in Marysville, WA
RELATED REPORTS & OPTIONS
Life, Physical & Social Science
Marysville
Compare Zip Codes
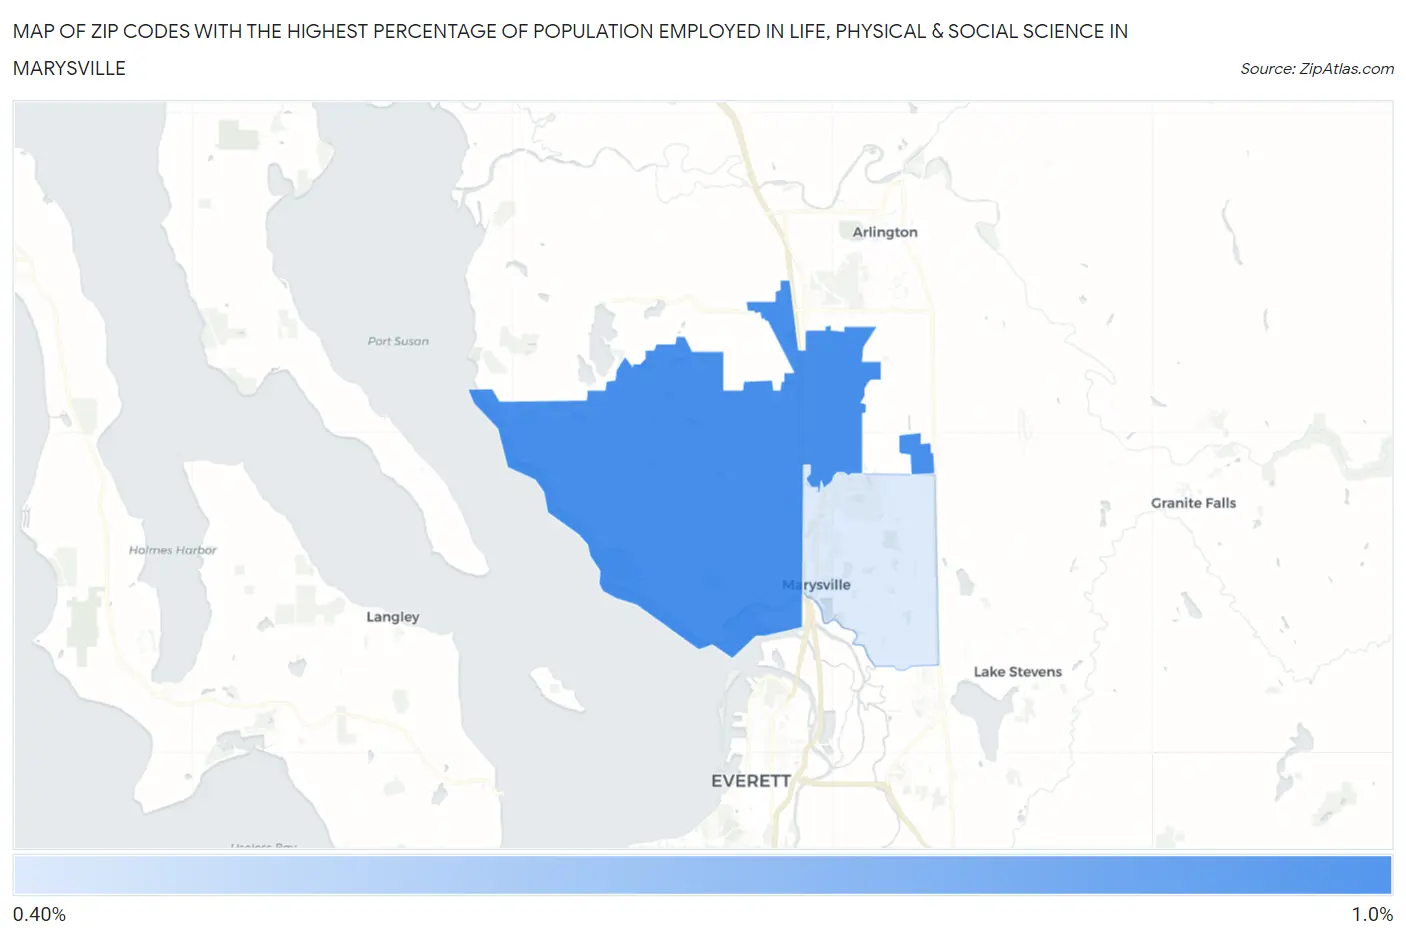
Map of Zip Codes with the Highest Percentage of Population Employed in Life, Physical & Social Science in Marysville
0.48%
1.00%
Zip Codes with the Highest Percentage of Population Employed in Life, Physical & Social Science in Marysville, WA
| Zip Code | % Employed | vs State | vs National | |
| 1. | 98271 | 1.00% | 1.3%(-0.313)#221 | 1.1%(-0.093)#9,063 |
| 2. | 98270 | 0.48% | 1.3%(-0.831)#342 | 1.1%(-0.611)#14,764 |
1
Common Questions
What are the Top Zip Codes with the Highest Percentage of Population Employed in Life, Physical & Social Science in Marysville, WA?
Top Zip Codes with the Highest Percentage of Population Employed in Life, Physical & Social Science in Marysville, WA are:
What zip code has the Highest Percentage of Population Employed in Life, Physical & Social Science in Marysville, WA?
98271 has the Highest Percentage of Population Employed in Life, Physical & Social Science in Marysville, WA with 1.00%.
What is the Percentage of Population Employed in Life, Physical & Social Science in Marysville, WA?
Percentage of Population Employed in Life, Physical & Social Science in Marysville is 0.68%.
What is the Percentage of Population Employed in Life, Physical & Social Science in Washington?
Percentage of Population Employed in Life, Physical & Social Science in Washington is 1.3%.
What is the Percentage of Population Employed in Life, Physical & Social Science in the United States?
Percentage of Population Employed in Life, Physical & Social Science in the United States is 1.1%.