Zip Codes with the Highest Percentage of Population Employed in Life, Physical & Social Science in Kirkland, WA
RELATED REPORTS & OPTIONS
Life, Physical & Social Science
Kirkland
Compare Zip Codes
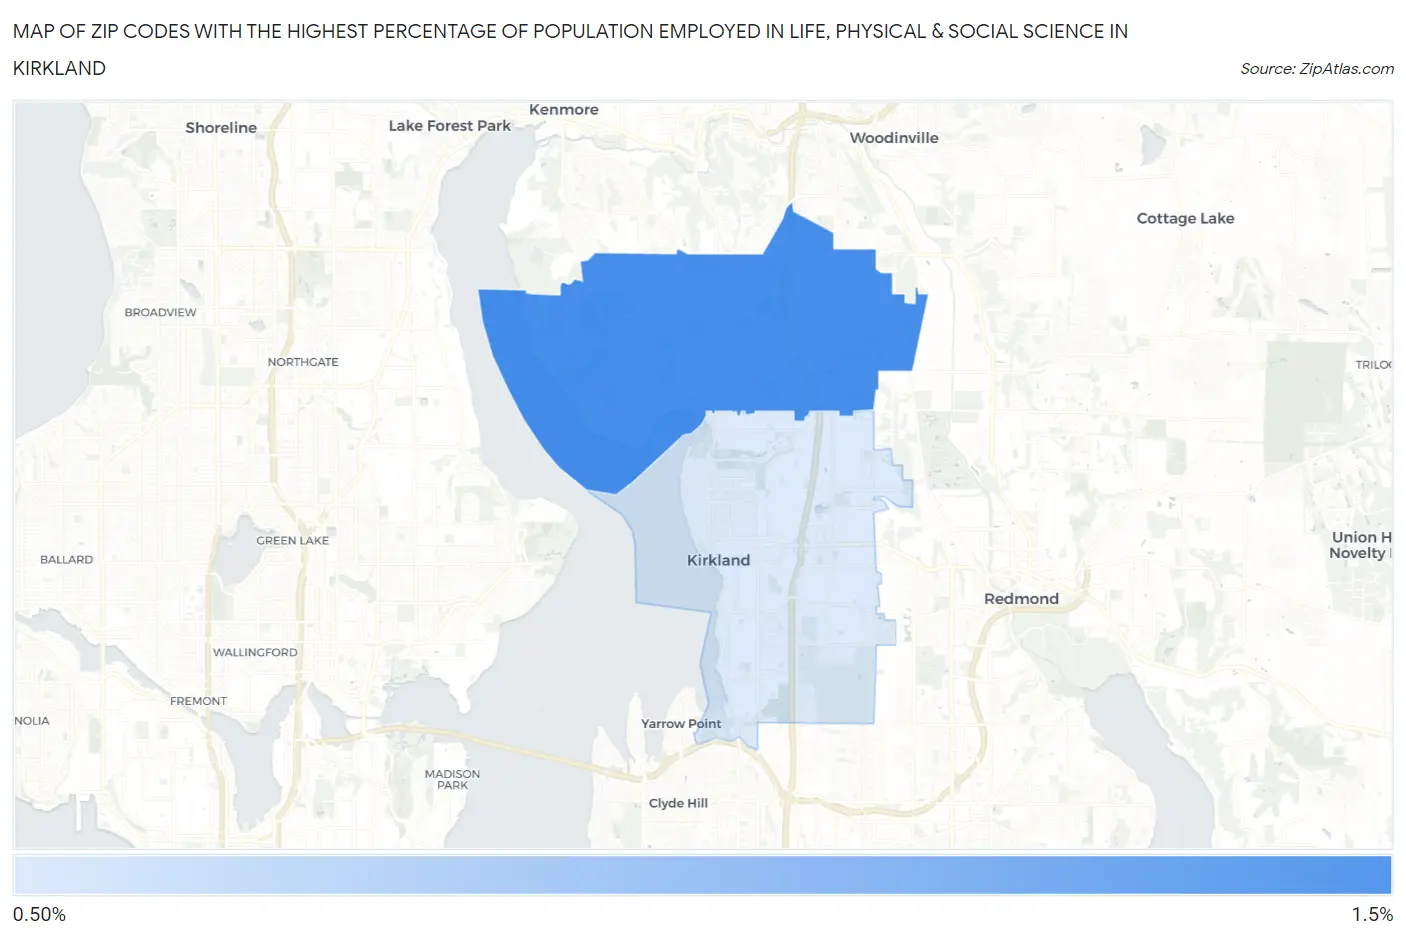
Map of Zip Codes with the Highest Percentage of Population Employed in Life, Physical & Social Science in Kirkland
1.2%
1.4%
Zip Codes with the Highest Percentage of Population Employed in Life, Physical & Social Science in Kirkland, WA
| Zip Code | % Employed | vs State | vs National | |
| 1. | 98034 | 1.4% | 1.3%(+0.071)#171 | 1.1%(+0.292)#6,292 |
| 2. | 98033 | 1.2% | 1.3%(-0.114)#198 | 1.1%(+0.106)#7,516 |
1
Common Questions
What are the Top Zip Codes with the Highest Percentage of Population Employed in Life, Physical & Social Science in Kirkland, WA?
Top Zip Codes with the Highest Percentage of Population Employed in Life, Physical & Social Science in Kirkland, WA are:
What zip code has the Highest Percentage of Population Employed in Life, Physical & Social Science in Kirkland, WA?
98034 has the Highest Percentage of Population Employed in Life, Physical & Social Science in Kirkland, WA with 1.4%.
What is the Percentage of Population Employed in Life, Physical & Social Science in Kirkland, WA?
Percentage of Population Employed in Life, Physical & Social Science in Kirkland is 1.2%.
What is the Percentage of Population Employed in Life, Physical & Social Science in Washington?
Percentage of Population Employed in Life, Physical & Social Science in Washington is 1.3%.
What is the Percentage of Population Employed in Life, Physical & Social Science in the United States?
Percentage of Population Employed in Life, Physical & Social Science in the United States is 1.1%.