Zip Codes with the Highest Percentage of Population Employed in Life, Physical & Social Science in Everett, WA

RELATED REPORTS & OPTIONS

Life, Physical & Social Science
Population
Families and Households
Female Fertility
Female Fertility (Unmarried)
Race (Community Size)
Race (Percentage)
Ancestry (Community Size)
AfricanAlaska NativeAlaskan AthabascanAlbanianAleutAmericanApacheArabArgentineanArmenianAustralianAustrianBangladeshiBasqueBelgianBhutaneseBlackfeetBrazilianBritishBulgarianBurmeseCambodianCanadianCelticCentral AmericanCentral American IndianCherokeeChickasawChileanChippewaChoctawColombianColvilleCosta RicanCreekCroatianCubanCzechCzechoslovakianDanishDominicanDutchEastern EuropeanEcuadorianEgyptianEnglishEstonianEthiopianEuropeanFijianFilipinoFinnishFrenchFrench American IndianFrench CanadianGermanGreekGuamanian / ChamorroGuatemalanHaitianHungarianIcelanderIndian (Asian)IndonesianInupiatIranianIraqiIrishIroquoisItalianJamaicanJapaneseJordanianKenyanKoreanLaotianLebaneseLithuanianLuxembourgerMalaysianMexicanMexican American IndianMoroccanNative HawaiianNavajoNicaraguanNigerianNorthern EuropeanNorwegianPakistaniPanamanianPennsylvania GermanPeruvianPolishPortuguesePuerto RicanPuget Sound SalishRomanianRussianSalvadoranSamoanScandinavianScotch-IrishScottishSeminoleSerbianSiouxSlavicSlovakSouth AmericanSpaniardSpanishSri LankanSubsaharan AfricanSwedishSwissThaiTlingit-HaidaTonganTurkishUgandanUkrainianVenezuelanWelshYakamaYugoslavian
Ancestry (Percentage)
AfricanAlaska NativeAlaskan AthabascanAlbanianAleutAmericanApacheArabArgentineanArmenianAustralianAustrianBangladeshiBasqueBelgianBhutaneseBlackfeetBrazilianBritishBulgarianBurmeseCambodianCanadianCelticCentral AmericanCentral American IndianCherokeeChickasawChileanChippewaChoctawColombianColvilleCosta RicanCreekCroatianCubanCzechCzechoslovakianDanishDominicanDutchEastern EuropeanEcuadorianEgyptianEnglishEstonianEthiopianEuropeanFijianFilipinoFinnishFrenchFrench American IndianFrench CanadianGermanGreekGuamanian / ChamorroGuatemalanHaitianHungarianIcelanderIndian (Asian)IndonesianInupiatIranianIraqiIrishIroquoisItalianJamaicanJapaneseJordanianKenyanKoreanLaotianLebaneseLithuanianLuxembourgerMalaysianMexicanMexican American IndianMoroccanNative HawaiianNavajoNicaraguanNigerianNorthern EuropeanNorwegianPakistaniPanamanianPennsylvania GermanPeruvianPolishPortuguesePuerto RicanPuget Sound SalishRomanianRussianSalvadoranSamoanScandinavianScotch-IrishScottishSeminoleSerbianSiouxSlavicSlovakSouth AmericanSpaniardSpanishSri LankanSubsaharan AfricanSwedishSwissThaiTlingit-HaidaTonganTurkishUgandanUkrainianVenezuelanWelshYakamaYugoslavian
Immigrant Origin (Total)
Immigrant Origin (Percentage)
Income
Income (Families)
Income (Households)
Poverty
Poverty (Families)
Unemployment
Employment Occupations
Employment Industries
Employer Class
Commute Time
Commute Means
School Enrollment
Education by Degree Field
Occupancy
Finances
Physical Characteristics
Everett
Compare Zip Codes
Comparison Subject

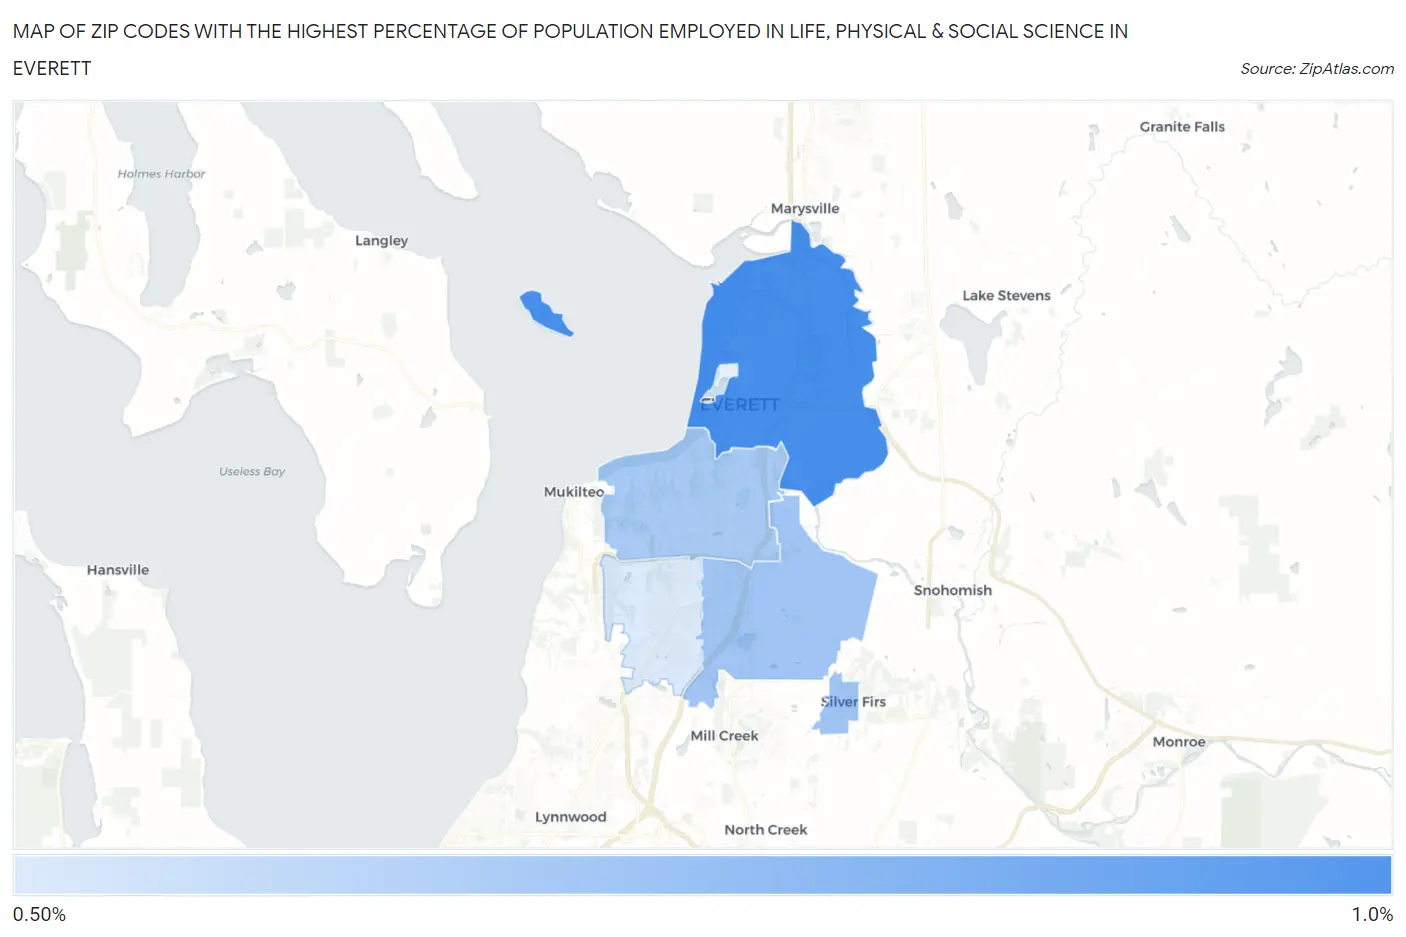
Map of Zip Codes with the Highest Percentage of Population Employed in Life, Physical & Social Science in Everett

0.0%
1.0%
Zip Codes with the Highest Percentage of Population Employed in Life, Physical & Social Science in Everett Map

Zip Codes with the Highest Percentage of Population Employed in Life, Physical & Social Science in Everett, WA

Zip Code % Employed vs State vs National
1.982010.88%1.3%(-0.435)#2461.1%(-0.215)#10,184
2.982080.66%1.3%(-0.655)#3031.1%(-0.435)#12,586
3.982030.64%1.3%(-0.673)#3061.1%(-0.453)#12,810
4.982040.51%1.3%(-0.804)#3361.1%(-0.584)#14,417

Common Questions

What are the Top 3 Zip Codes with the Highest Percentage of Population Employed in Life, Physical & Social Science in Everett, WA?
Top 3 Zip Codes with the Highest Percentage of Population Employed in Life, Physical & Social Science in Everett, WA are:
#1
0.88%
#2
0.66%
#3
0.64%
What zip code has the Highest Percentage of Population Employed in Life, Physical & Social Science in Everett, WA?
98201 has the Highest Percentage of Population Employed in Life, Physical & Social Science in Everett, WA with 0.88%.
What is the Percentage of Population Employed in Life, Physical & Social Science in Everett, WA?
Percentage of Population Employed in Life, Physical & Social Science in Everett is 0.70%.
What is the Percentage of Population Employed in Life, Physical & Social Science in Washington?
Percentage of Population Employed in Life, Physical & Social Science in Washington is 1.3%.
What is the Percentage of Population Employed in Life, Physical & Social Science in the United States?
Percentage of Population Employed in Life, Physical & Social Science in the United States is 1.1%.