Zip Codes with the Highest Percentage of Population Employed in Life, Physical & Social Science in Puyallup, WA
RELATED REPORTS & OPTIONS
Life, Physical & Social Science
Puyallup
Compare Zip Codes
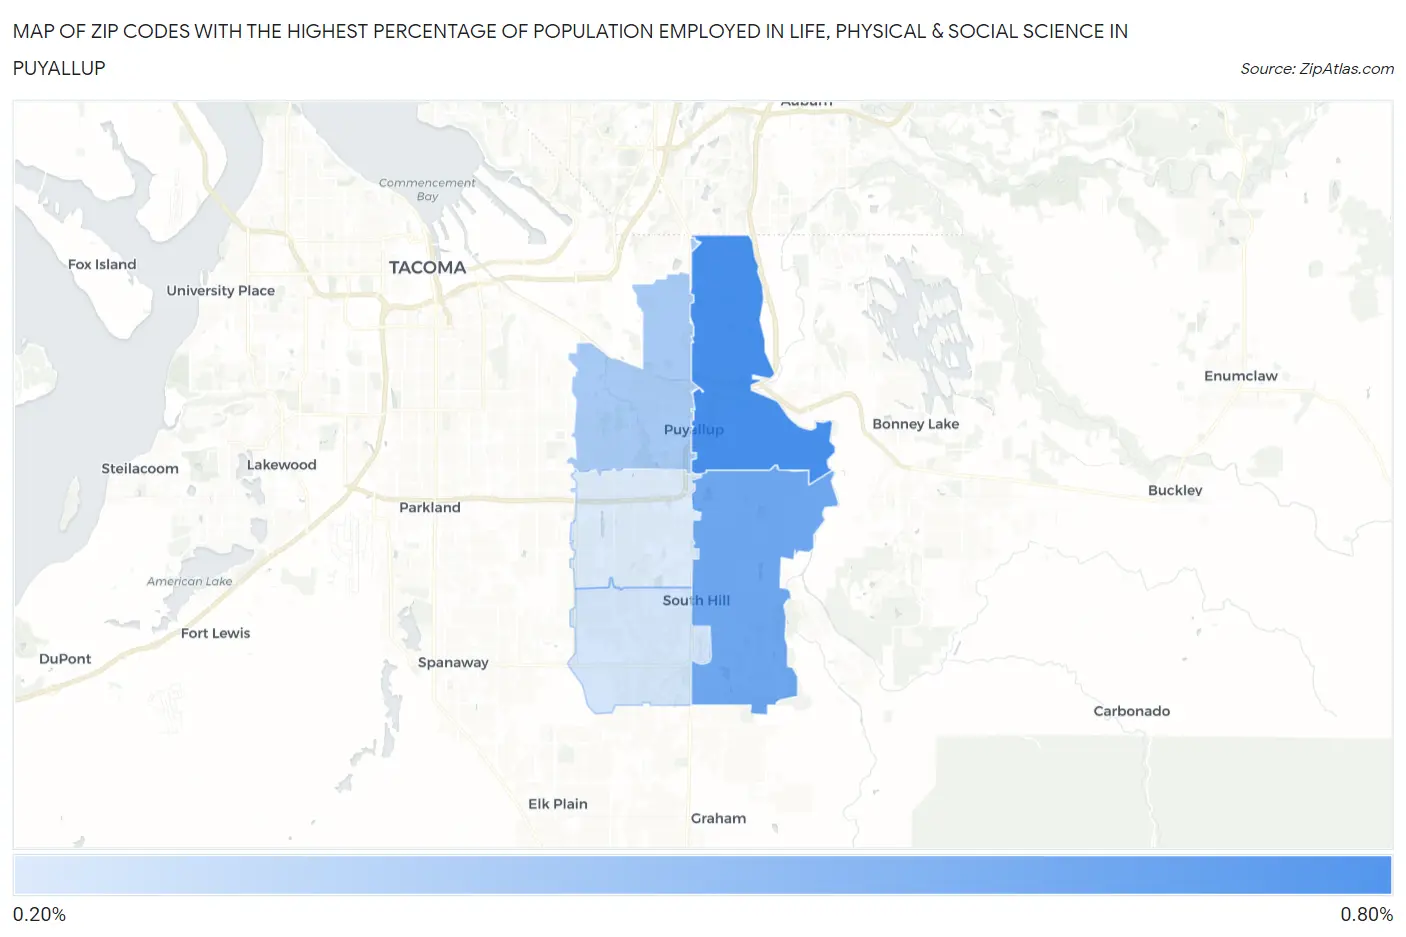
Map of Zip Codes with the Highest Percentage of Population Employed in Life, Physical & Social Science in Puyallup
0.28%
0.73%
Zip Codes with the Highest Percentage of Population Employed in Life, Physical & Social Science in Puyallup, WA
| Zip Code | % Employed | vs State | vs National | |
| 1. | 98372 | 0.73% | 1.3%(-0.578)#281 | 1.1%(-0.358)#11,674 |
| 2. | 98374 | 0.61% | 1.3%(-0.698)#313 | 1.1%(-0.478)#13,133 |
| 3. | 98371 | 0.44% | 1.3%(-0.875)#348 | 1.1%(-0.655)#15,319 |
| 4. | 98375 | 0.30% | 1.3%(-1.01)#371 | 1.1%(-0.787)#17,015 |
| 5. | 98373 | 0.28% | 1.3%(-1.03)#375 | 1.1%(-0.814)#17,322 |
1
Common Questions
What are the Top 3 Zip Codes with the Highest Percentage of Population Employed in Life, Physical & Social Science in Puyallup, WA?
Top 3 Zip Codes with the Highest Percentage of Population Employed in Life, Physical & Social Science in Puyallup, WA are:
What zip code has the Highest Percentage of Population Employed in Life, Physical & Social Science in Puyallup, WA?
98372 has the Highest Percentage of Population Employed in Life, Physical & Social Science in Puyallup, WA with 0.73%.
What is the Percentage of Population Employed in Life, Physical & Social Science in Puyallup, WA?
Percentage of Population Employed in Life, Physical & Social Science in Puyallup is 0.30%.
What is the Percentage of Population Employed in Life, Physical & Social Science in Washington?
Percentage of Population Employed in Life, Physical & Social Science in Washington is 1.3%.
What is the Percentage of Population Employed in Life, Physical & Social Science in the United States?
Percentage of Population Employed in Life, Physical & Social Science in the United States is 1.1%.