Zip Codes with the Highest Percentage of Population Employed in Life, Physical & Social Science in Auburn, WA
RELATED REPORTS & OPTIONS
Life, Physical & Social Science
Auburn
Compare Zip Codes
Map of Zip Codes with the Highest Percentage of Population Employed in Life, Physical & Social Science in Auburn
0.25%
0.67%
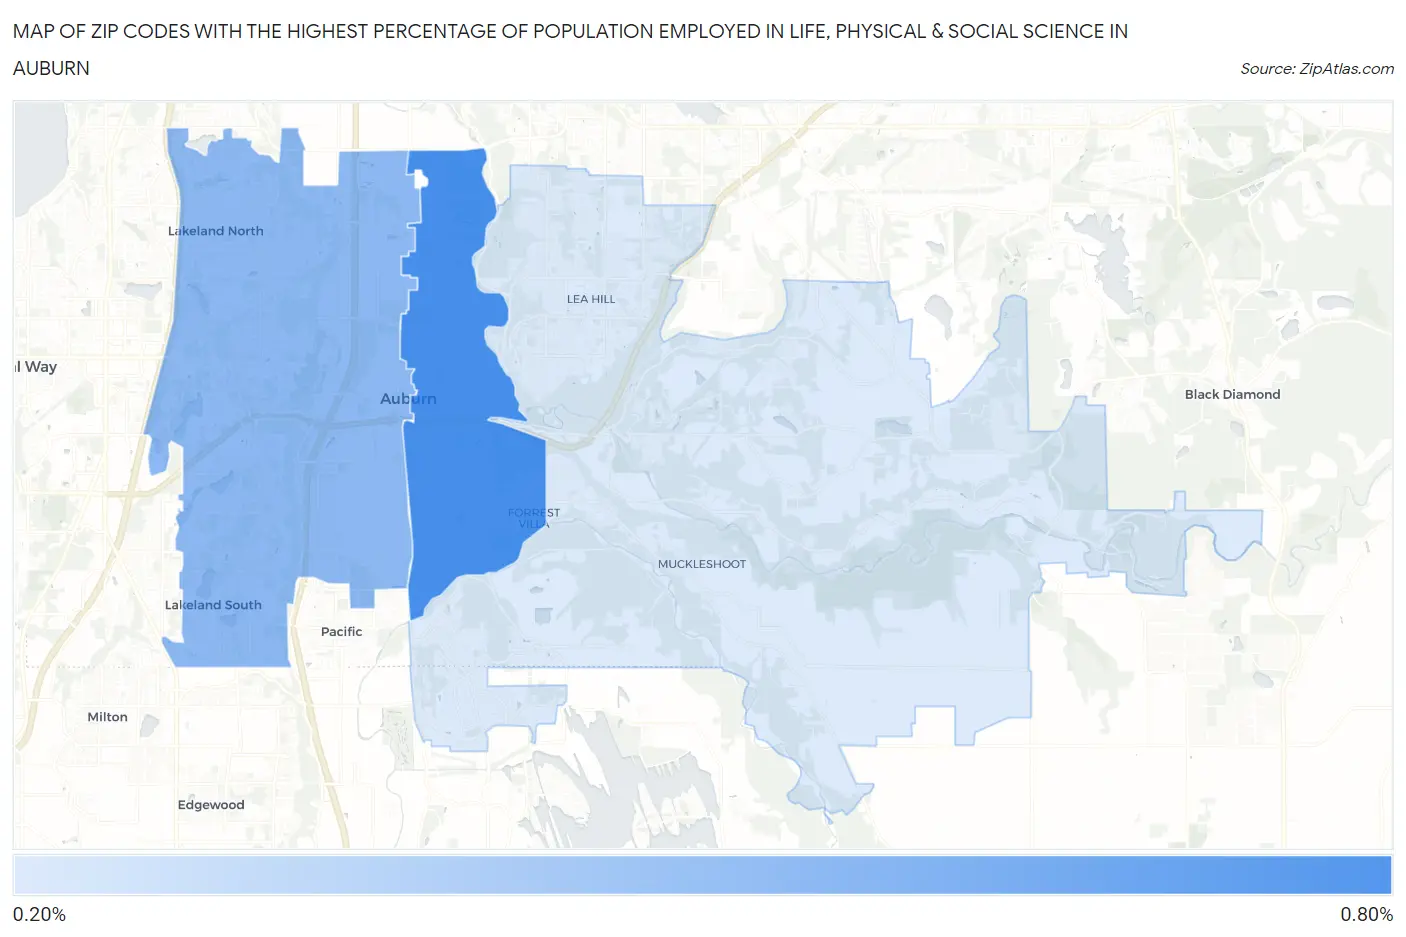
Zip Codes with the Highest Percentage of Population Employed in Life, Physical & Social Science in Auburn, WA
| Zip Code | % Employed | vs State | vs National | |
| 1. | 98002 | 0.67% | 1.3%(-0.636)#294 | 1.1%(-0.416)#12,356 |
| 2. | 98001 | 0.48% | 1.3%(-0.831)#341 | 1.1%(-0.610)#14,760 |
| 3. | 98092 | 0.25% | 1.3%(-1.06)#380 | 1.1%(-0.837)#17,597 |
1
Common Questions
What are the Top Zip Codes with the Highest Percentage of Population Employed in Life, Physical & Social Science in Auburn, WA?
Top Zip Codes with the Highest Percentage of Population Employed in Life, Physical & Social Science in Auburn, WA are:
What zip code has the Highest Percentage of Population Employed in Life, Physical & Social Science in Auburn, WA?
98002 has the Highest Percentage of Population Employed in Life, Physical & Social Science in Auburn, WA with 0.67%.
What is the Percentage of Population Employed in Life, Physical & Social Science in Auburn, WA?
Percentage of Population Employed in Life, Physical & Social Science in Auburn is 0.45%.
What is the Percentage of Population Employed in Life, Physical & Social Science in Washington?
Percentage of Population Employed in Life, Physical & Social Science in Washington is 1.3%.
What is the Percentage of Population Employed in Life, Physical & Social Science in the United States?
Percentage of Population Employed in Life, Physical & Social Science in the United States is 1.1%.