Zip Codes with the Highest Percentage of Population Employed in Life, Physical & Social Science in Kennewick, WA
RELATED REPORTS & OPTIONS
Life, Physical & Social Science
Kennewick
Compare Zip Codes
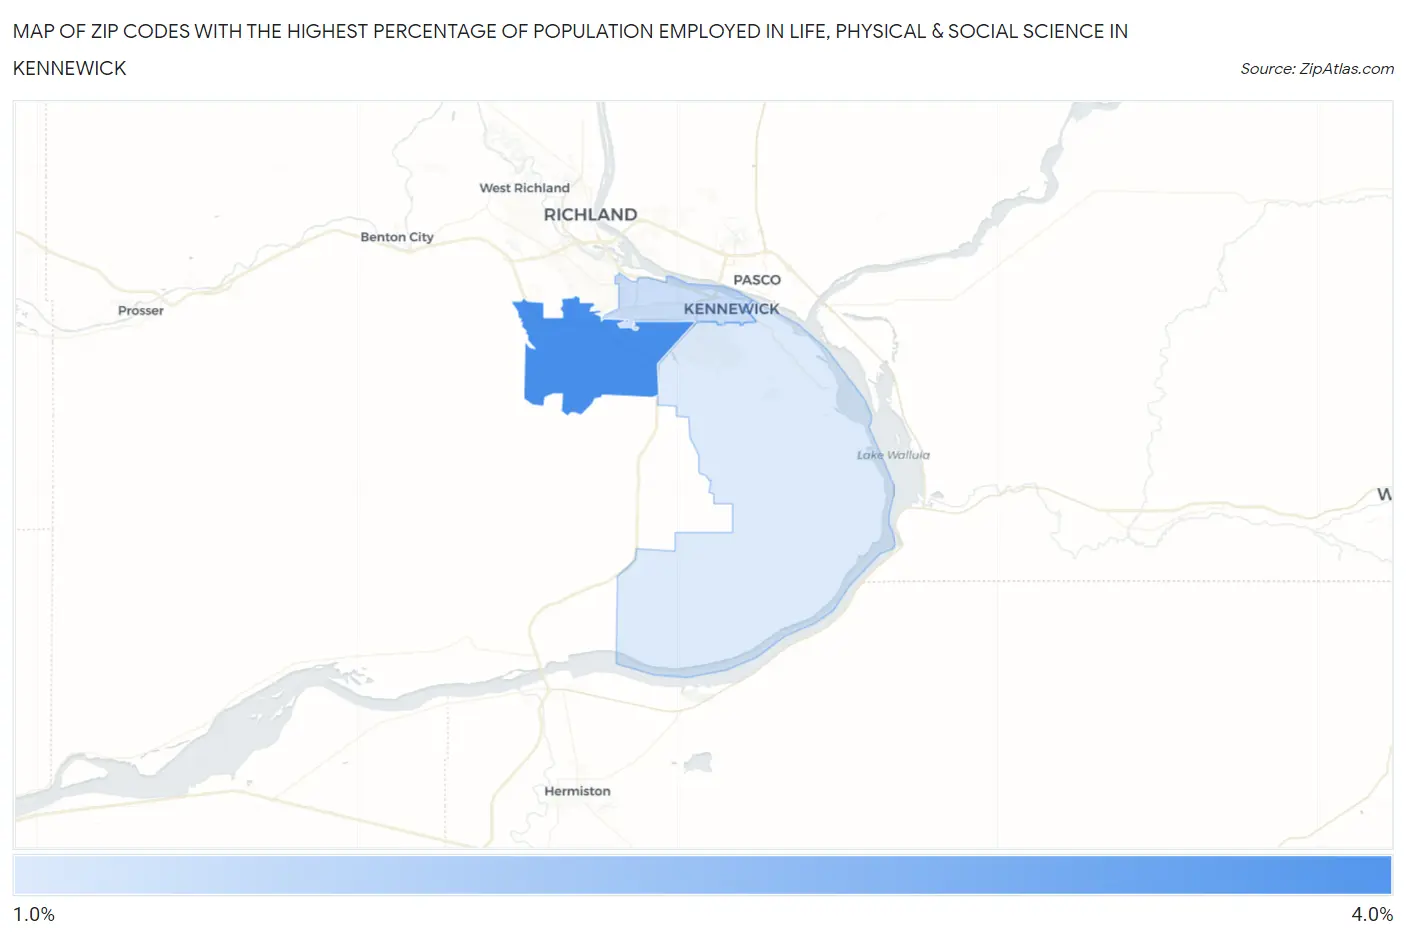
Map of Zip Codes with the Highest Percentage of Population Employed in Life, Physical & Social Science in Kennewick
1.5%
3.4%
Zip Codes with the Highest Percentage of Population Employed in Life, Physical & Social Science in Kennewick, WA
| Zip Code | % Employed | vs State | vs National | |
| 1. | 99338 | 3.4% | 1.3%(+2.05)#55 | 1.1%(+2.27)#1,525 |
| 2. | 99336 | 1.7% | 1.3%(+0.366)#129 | 1.1%(+0.586)#4,830 |
| 3. | 99337 | 1.5% | 1.3%(+0.148)#155 | 1.1%(+0.368)#5,876 |
1
Common Questions
What are the Top Zip Codes with the Highest Percentage of Population Employed in Life, Physical & Social Science in Kennewick, WA?
Top Zip Codes with the Highest Percentage of Population Employed in Life, Physical & Social Science in Kennewick, WA are:
What zip code has the Highest Percentage of Population Employed in Life, Physical & Social Science in Kennewick, WA?
99338 has the Highest Percentage of Population Employed in Life, Physical & Social Science in Kennewick, WA with 3.4%.
What is the Percentage of Population Employed in Life, Physical & Social Science in Kennewick, WA?
Percentage of Population Employed in Life, Physical & Social Science in Kennewick is 2.0%.
What is the Percentage of Population Employed in Life, Physical & Social Science in Washington?
Percentage of Population Employed in Life, Physical & Social Science in Washington is 1.3%.
What is the Percentage of Population Employed in Life, Physical & Social Science in the United States?
Percentage of Population Employed in Life, Physical & Social Science in the United States is 1.1%.