Scandinavian vs Seminole 4 or more Vehicles in Household
COMPARE
Scandinavian
Seminole
4 or more Vehicles in Household
4 or more Vehicles in Household Comparison
Scandinavians
Seminole
8.0%
4 OR MORE VEHICLES IN HOUSEHOLD
100.0/ 100
METRIC RATING
37th/ 347
METRIC RANK
7.0%
4 OR MORE VEHICLES IN HOUSEHOLD
98.8/ 100
METRIC RATING
99th/ 347
METRIC RANK
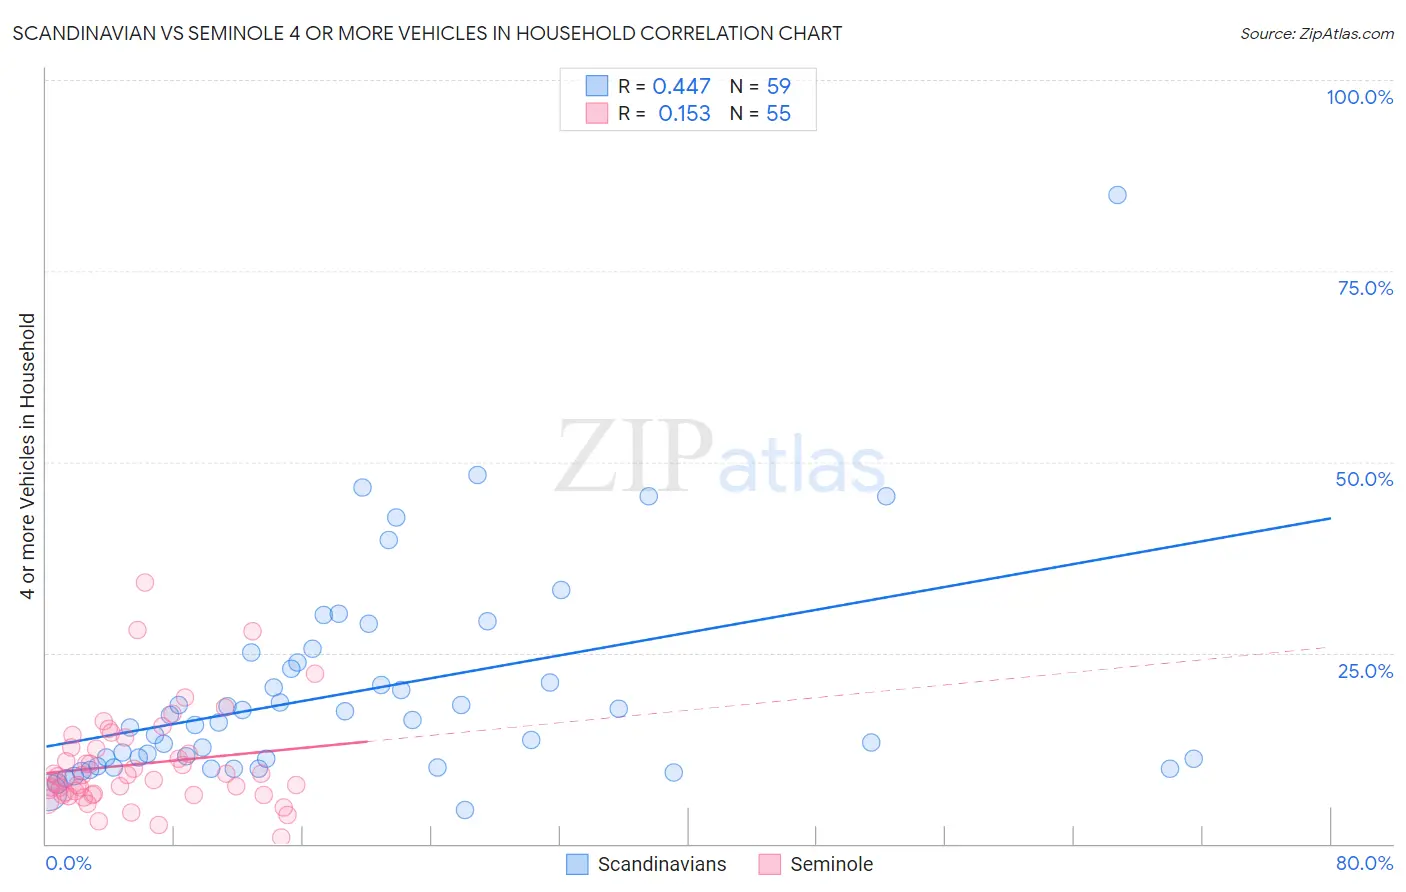
Scandinavian vs Seminole 4 or more Vehicles in Household Correlation Chart
The statistical analysis conducted on geographies consisting of 470,673,976 people shows a moderate positive correlation between the proportion of Scandinavians and percentage of households with 4 or more vehicles available in the United States with a correlation coefficient (R) of 0.447 and weighted average of 8.0%. Similarly, the statistical analysis conducted on geographies consisting of 118,205,543 people shows a poor positive correlation between the proportion of Seminole and percentage of households with 4 or more vehicles available in the United States with a correlation coefficient (R) of 0.153 and weighted average of 7.0%, a difference of 13.6%.
4 or more Vehicles in Household Correlation Summary
| Measurement | Scandinavian | Seminole |
| Minimum | 4.3% | 0.87% |
| Maximum | 85.0% | 34.2% |
| Range | 80.7% | 33.3% |
| Mean | 19.8% | 10.4% |
| Median | 15.9% | 8.8% |
| Interquartile 25% (IQ1) | 10.2% | 6.4% |
| Interquartile 75% (IQ3) | 23.7% | 12.6% |
| Interquartile Range (IQR) | 13.5% | 6.2% |
| Standard Deviation (Sample) | 13.9% | 6.4% |
| Standard Deviation (Population) | 13.8% | 6.4% |
Similar Demographics by 4 or more Vehicles in Household
Demographics Similar to Scandinavians by 4 or more Vehicles in Household
In terms of 4 or more vehicles in household, the demographic groups most similar to Scandinavians are Sioux (8.0%, a difference of 0.030%), Norwegian (8.0%, a difference of 0.17%), Spanish American (8.0%, a difference of 0.26%), Spanish (7.9%, a difference of 0.89%), and Guamanian/Chamorro (8.1%, a difference of 0.96%).
| Demographics | Rating | Rank | 4 or more Vehicles in Household |
| Navajo | 100.0 /100 | #30 | Exceptional 8.2% |
| Natives/Alaskans | 100.0 /100 | #31 | Exceptional 8.2% |
| Marshallese | 100.0 /100 | #32 | Exceptional 8.1% |
| Yaqui | 100.0 /100 | #33 | Exceptional 8.1% |
| Alaskan Athabascans | 100.0 /100 | #34 | Exceptional 8.1% |
| Guamanians/Chamorros | 100.0 /100 | #35 | Exceptional 8.1% |
| Norwegians | 100.0 /100 | #36 | Exceptional 8.0% |
| Scandinavians | 100.0 /100 | #37 | Exceptional 8.0% |
| Sioux | 100.0 /100 | #38 | Exceptional 8.0% |
| Spanish Americans | 100.0 /100 | #39 | Exceptional 8.0% |
| Spanish | 100.0 /100 | #40 | Exceptional 7.9% |
| Pima | 100.0 /100 | #41 | Exceptional 7.9% |
| Salvadorans | 100.0 /100 | #42 | Exceptional 7.8% |
| Fijians | 100.0 /100 | #43 | Exceptional 7.8% |
| Bhutanese | 100.0 /100 | #44 | Exceptional 7.8% |
Demographics Similar to Seminole by 4 or more Vehicles in Household
In terms of 4 or more vehicles in household, the demographic groups most similar to Seminole are Taiwanese (7.0%, a difference of 0.080%), Pakistani (7.0%, a difference of 0.15%), Asian (7.0%, a difference of 0.21%), Blackfeet (7.0%, a difference of 0.22%), and Irish (7.1%, a difference of 0.44%).
| Demographics | Rating | Rank | 4 or more Vehicles in Household |
| Immigrants | Latin America | 99.4 /100 | #92 | Exceptional 7.1% |
| Immigrants | Afghanistan | 99.3 /100 | #93 | Exceptional 7.1% |
| Dutch West Indians | 99.3 /100 | #94 | Exceptional 7.1% |
| Czechoslovakians | 99.3 /100 | #95 | Exceptional 7.1% |
| Central Americans | 99.3 /100 | #96 | Exceptional 7.1% |
| Celtics | 99.1 /100 | #97 | Exceptional 7.1% |
| Irish | 99.0 /100 | #98 | Exceptional 7.1% |
| Seminole | 98.8 /100 | #99 | Exceptional 7.0% |
| Taiwanese | 98.7 /100 | #100 | Exceptional 7.0% |
| Pakistanis | 98.7 /100 | #101 | Exceptional 7.0% |
| Asians | 98.6 /100 | #102 | Exceptional 7.0% |
| Blackfeet | 98.6 /100 | #103 | Exceptional 7.0% |
| Hmong | 98.3 /100 | #104 | Exceptional 7.0% |
| German Russians | 98.3 /100 | #105 | Exceptional 7.0% |
| Guatemalans | 98.1 /100 | #106 | Exceptional 7.0% |