Scandinavian vs Immigrants from El Salvador 4 or more Vehicles in Household
COMPARE
Scandinavian
Immigrants from El Salvador
4 or more Vehicles in Household
4 or more Vehicles in Household Comparison
Scandinavians
Immigrants from El Salvador
8.0%
4 OR MORE VEHICLES IN HOUSEHOLD
100.0/ 100
METRIC RATING
37th/ 347
METRIC RANK
7.7%
4 OR MORE VEHICLES IN HOUSEHOLD
100.0/ 100
METRIC RATING
50th/ 347
METRIC RANK
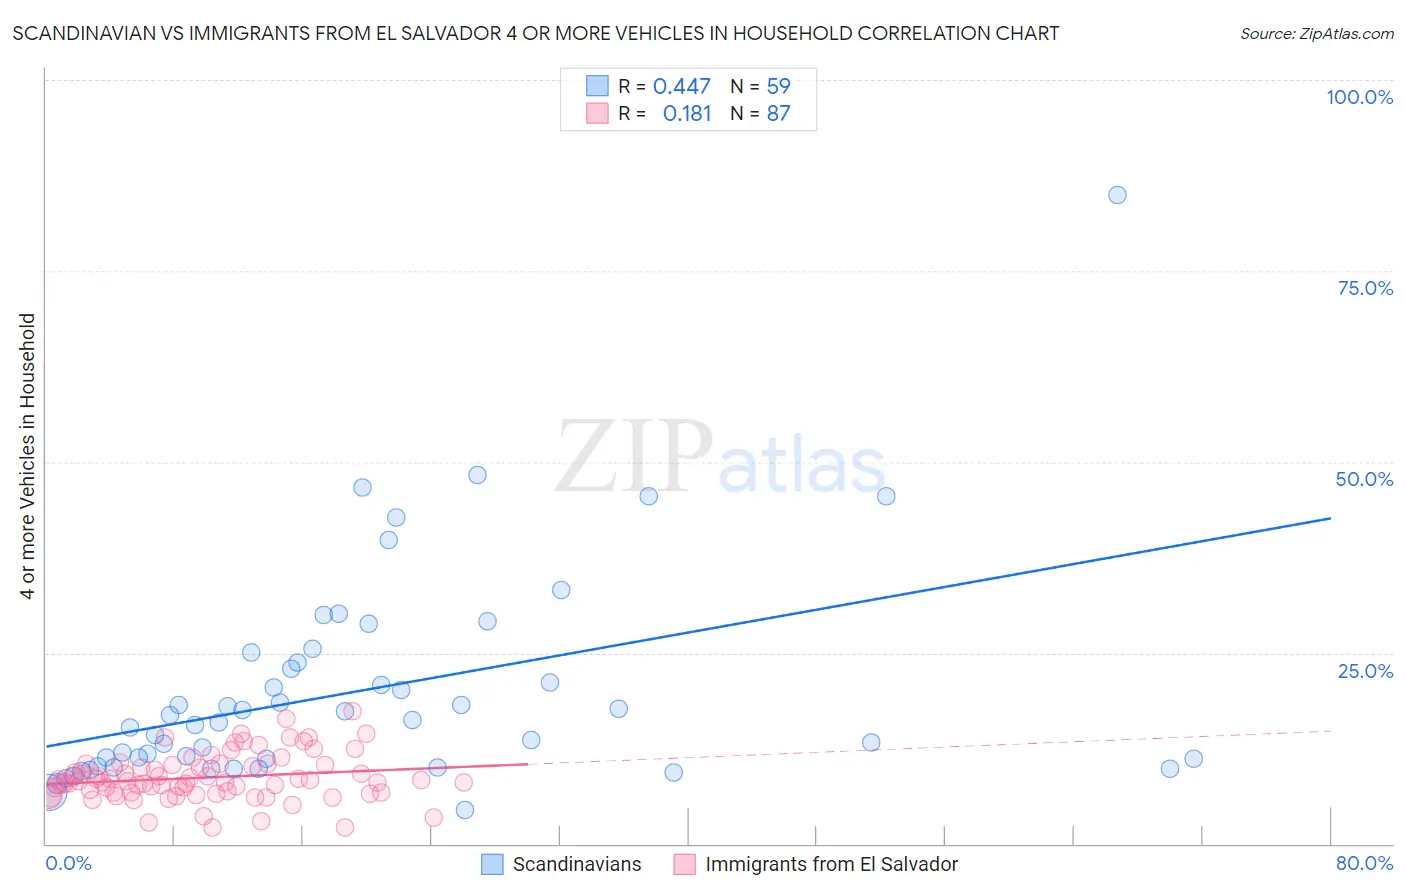
Scandinavian vs Immigrants from El Salvador 4 or more Vehicles in Household Correlation Chart
The statistical analysis conducted on geographies consisting of 470,673,976 people shows a moderate positive correlation between the proportion of Scandinavians and percentage of households with 4 or more vehicles available in the United States with a correlation coefficient (R) of 0.447 and weighted average of 8.0%. Similarly, the statistical analysis conducted on geographies consisting of 356,356,218 people shows a poor positive correlation between the proportion of Immigrants from El Salvador and percentage of households with 4 or more vehicles available in the United States with a correlation coefficient (R) of 0.181 and weighted average of 7.7%, a difference of 3.3%.
4 or more Vehicles in Household Correlation Summary
| Measurement | Scandinavian | Immigrants from El Salvador |
| Minimum | 4.3% | 2.1% |
| Maximum | 85.0% | 17.3% |
| Range | 80.7% | 15.2% |
| Mean | 19.8% | 8.7% |
| Median | 15.9% | 8.2% |
| Interquartile 25% (IQ1) | 10.2% | 6.7% |
| Interquartile 75% (IQ3) | 23.7% | 10.4% |
| Interquartile Range (IQR) | 13.5% | 3.7% |
| Standard Deviation (Sample) | 13.9% | 3.0% |
| Standard Deviation (Population) | 13.8% | 3.0% |
Demographics Similar to Scandinavians and Immigrants from El Salvador by 4 or more Vehicles in Household
In terms of 4 or more vehicles in household, the demographic groups most similar to Scandinavians are Sioux (8.0%, a difference of 0.030%), Norwegian (8.0%, a difference of 0.17%), Spanish American (8.0%, a difference of 0.26%), Spanish (7.9%, a difference of 0.89%), and Guamanian/Chamorro (8.1%, a difference of 0.96%). Similarly, the demographic groups most similar to Immigrants from El Salvador are Cherokee (7.7%, a difference of 0.16%), Swiss (7.8%, a difference of 0.35%), Immigrants from Laos (7.7%, a difference of 0.35%), Japanese (7.7%, a difference of 0.47%), and Osage (7.8%, a difference of 0.52%).
| Demographics | Rating | Rank | 4 or more Vehicles in Household |
| Yaqui | 100.0 /100 | #33 | Exceptional 8.1% |
| Alaskan Athabascans | 100.0 /100 | #34 | Exceptional 8.1% |
| Guamanians/Chamorros | 100.0 /100 | #35 | Exceptional 8.1% |
| Norwegians | 100.0 /100 | #36 | Exceptional 8.0% |
| Scandinavians | 100.0 /100 | #37 | Exceptional 8.0% |
| Sioux | 100.0 /100 | #38 | Exceptional 8.0% |
| Spanish Americans | 100.0 /100 | #39 | Exceptional 8.0% |
| Spanish | 100.0 /100 | #40 | Exceptional 7.9% |
| Pima | 100.0 /100 | #41 | Exceptional 7.9% |
| Salvadorans | 100.0 /100 | #42 | Exceptional 7.8% |
| Fijians | 100.0 /100 | #43 | Exceptional 7.8% |
| Bhutanese | 100.0 /100 | #44 | Exceptional 7.8% |
| Choctaw | 100.0 /100 | #45 | Exceptional 7.8% |
| Crow | 100.0 /100 | #46 | Exceptional 7.8% |
| Osage | 100.0 /100 | #47 | Exceptional 7.8% |
| Swiss | 100.0 /100 | #48 | Exceptional 7.8% |
| Cherokee | 100.0 /100 | #49 | Exceptional 7.7% |
| Immigrants | El Salvador | 100.0 /100 | #50 | Exceptional 7.7% |
| Immigrants | Laos | 100.0 /100 | #51 | Exceptional 7.7% |
| Japanese | 100.0 /100 | #52 | Exceptional 7.7% |
| Malaysians | 100.0 /100 | #53 | Exceptional 7.7% |