Scandinavian vs Immigrants from Italy 4 or more Vehicles in Household
COMPARE
Scandinavian
Immigrants from Italy
4 or more Vehicles in Household
4 or more Vehicles in Household Comparison
Scandinavians
Immigrants from Italy
8.0%
4 OR MORE VEHICLES IN HOUSEHOLD
100.0/ 100
METRIC RATING
37th/ 347
METRIC RANK
6.0%
4 OR MORE VEHICLES IN HOUSEHOLD
11.0/ 100
METRIC RATING
218th/ 347
METRIC RANK
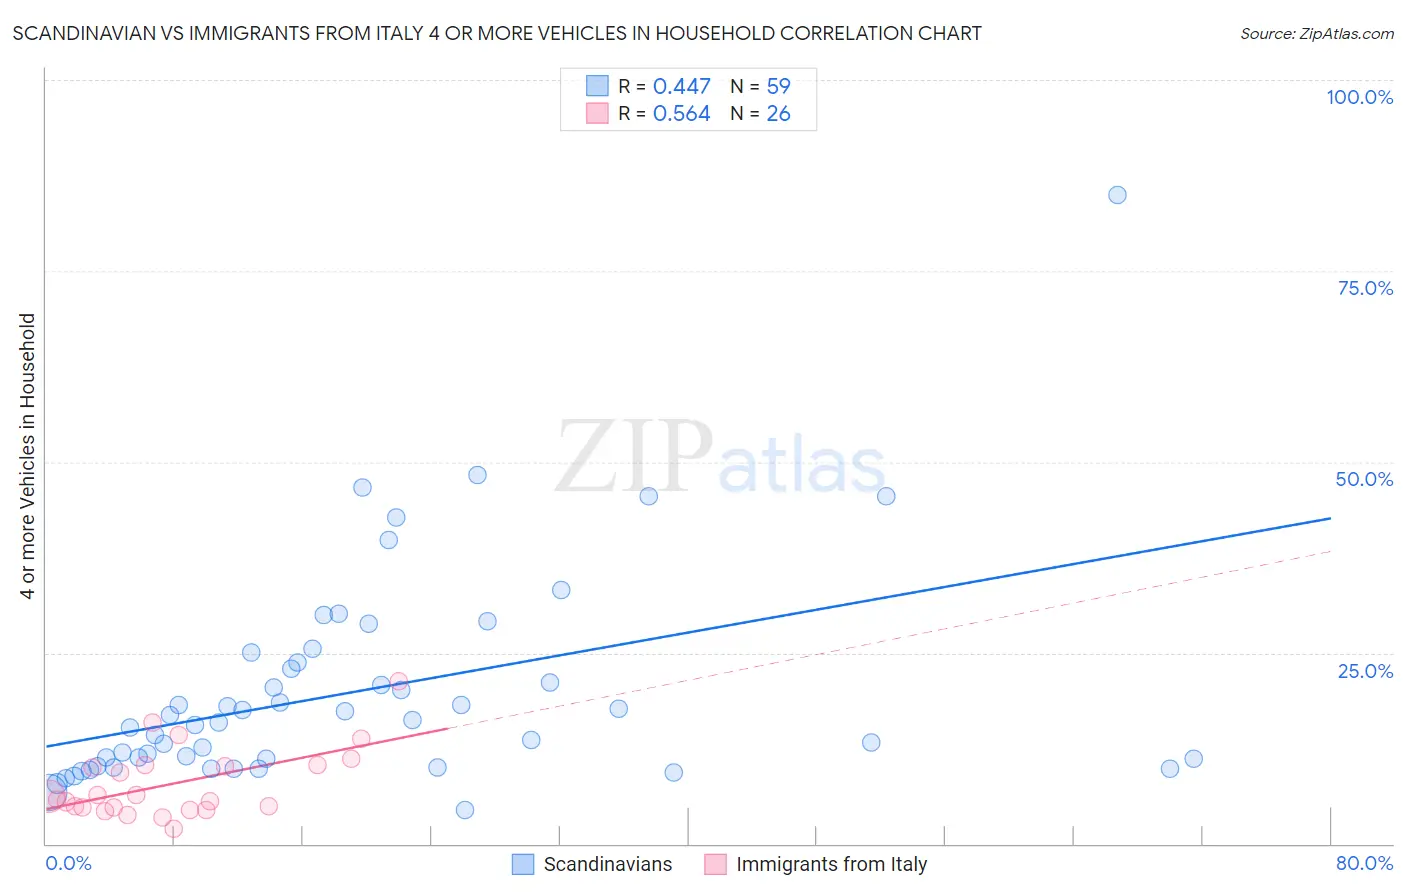
Scandinavian vs Immigrants from Italy 4 or more Vehicles in Household Correlation Chart
The statistical analysis conducted on geographies consisting of 470,673,976 people shows a moderate positive correlation between the proportion of Scandinavians and percentage of households with 4 or more vehicles available in the United States with a correlation coefficient (R) of 0.447 and weighted average of 8.0%. Similarly, the statistical analysis conducted on geographies consisting of 322,662,886 people shows a substantial positive correlation between the proportion of Immigrants from Italy and percentage of households with 4 or more vehicles available in the United States with a correlation coefficient (R) of 0.564 and weighted average of 6.0%, a difference of 33.3%.
4 or more Vehicles in Household Correlation Summary
| Measurement | Scandinavian | Immigrants from Italy |
| Minimum | 4.3% | 1.9% |
| Maximum | 85.0% | 21.2% |
| Range | 80.7% | 19.3% |
| Mean | 19.8% | 7.8% |
| Median | 15.9% | 6.0% |
| Interquartile 25% (IQ1) | 10.2% | 4.7% |
| Interquartile 75% (IQ3) | 23.7% | 10.3% |
| Interquartile Range (IQR) | 13.5% | 5.6% |
| Standard Deviation (Sample) | 13.9% | 4.6% |
| Standard Deviation (Population) | 13.8% | 4.5% |
Similar Demographics by 4 or more Vehicles in Household
Demographics Similar to Scandinavians by 4 or more Vehicles in Household
In terms of 4 or more vehicles in household, the demographic groups most similar to Scandinavians are Sioux (8.0%, a difference of 0.030%), Norwegian (8.0%, a difference of 0.17%), Spanish American (8.0%, a difference of 0.26%), Spanish (7.9%, a difference of 0.89%), and Guamanian/Chamorro (8.1%, a difference of 0.96%).
| Demographics | Rating | Rank | 4 or more Vehicles in Household |
| Navajo | 100.0 /100 | #30 | Exceptional 8.2% |
| Natives/Alaskans | 100.0 /100 | #31 | Exceptional 8.2% |
| Marshallese | 100.0 /100 | #32 | Exceptional 8.1% |
| Yaqui | 100.0 /100 | #33 | Exceptional 8.1% |
| Alaskan Athabascans | 100.0 /100 | #34 | Exceptional 8.1% |
| Guamanians/Chamorros | 100.0 /100 | #35 | Exceptional 8.1% |
| Norwegians | 100.0 /100 | #36 | Exceptional 8.0% |
| Scandinavians | 100.0 /100 | #37 | Exceptional 8.0% |
| Sioux | 100.0 /100 | #38 | Exceptional 8.0% |
| Spanish Americans | 100.0 /100 | #39 | Exceptional 8.0% |
| Spanish | 100.0 /100 | #40 | Exceptional 7.9% |
| Pima | 100.0 /100 | #41 | Exceptional 7.9% |
| Salvadorans | 100.0 /100 | #42 | Exceptional 7.8% |
| Fijians | 100.0 /100 | #43 | Exceptional 7.8% |
| Bhutanese | 100.0 /100 | #44 | Exceptional 7.8% |
Demographics Similar to Immigrants from Italy by 4 or more Vehicles in Household
In terms of 4 or more vehicles in household, the demographic groups most similar to Immigrants from Italy are Serbian (6.0%, a difference of 0.0%), Russian (6.0%, a difference of 0.19%), Nigerian (6.0%, a difference of 0.31%), Immigrants from Moldova (6.0%, a difference of 0.49%), and Cajun (6.0%, a difference of 0.52%).
| Demographics | Rating | Rank | 4 or more Vehicles in Household |
| Panamanians | 14.8 /100 | #211 | Poor 6.0% |
| Immigrants | Egypt | 14.7 /100 | #212 | Poor 6.0% |
| Arabs | 14.4 /100 | #213 | Poor 6.0% |
| Immigrants | Austria | 14.3 /100 | #214 | Poor 6.0% |
| Immigrants | China | 13.8 /100 | #215 | Poor 6.0% |
| Immigrants | Romania | 13.8 /100 | #216 | Poor 6.0% |
| Nigerians | 12.2 /100 | #217 | Poor 6.0% |
| Immigrants | Italy | 11.0 /100 | #218 | Poor 6.0% |
| Serbians | 11.0 /100 | #219 | Poor 6.0% |
| Russians | 10.3 /100 | #220 | Poor 6.0% |
| Immigrants | Moldova | 9.3 /100 | #221 | Tragic 6.0% |
| Cajuns | 9.2 /100 | #222 | Tragic 6.0% |
| Immigrants | Kenya | 9.2 /100 | #223 | Tragic 6.0% |
| Cubans | 9.2 /100 | #224 | Tragic 6.0% |
| Indonesians | 8.9 /100 | #225 | Tragic 6.0% |