Lithuanian vs Ghanaian 2 or more Vehicles in Household
COMPARE
Lithuanian
Ghanaian
2 or more Vehicles in Household
2 or more Vehicles in Household Comparison
Lithuanians
Ghanaians
58.2%
2 OR MORE VEHICLES IN HOUSEHOLD
99.5/ 100
METRIC RATING
78th/ 347
METRIC RANK
48.0%
2 OR MORE VEHICLES IN HOUSEHOLD
0.0/ 100
METRIC RATING
310th/ 347
METRIC RANK
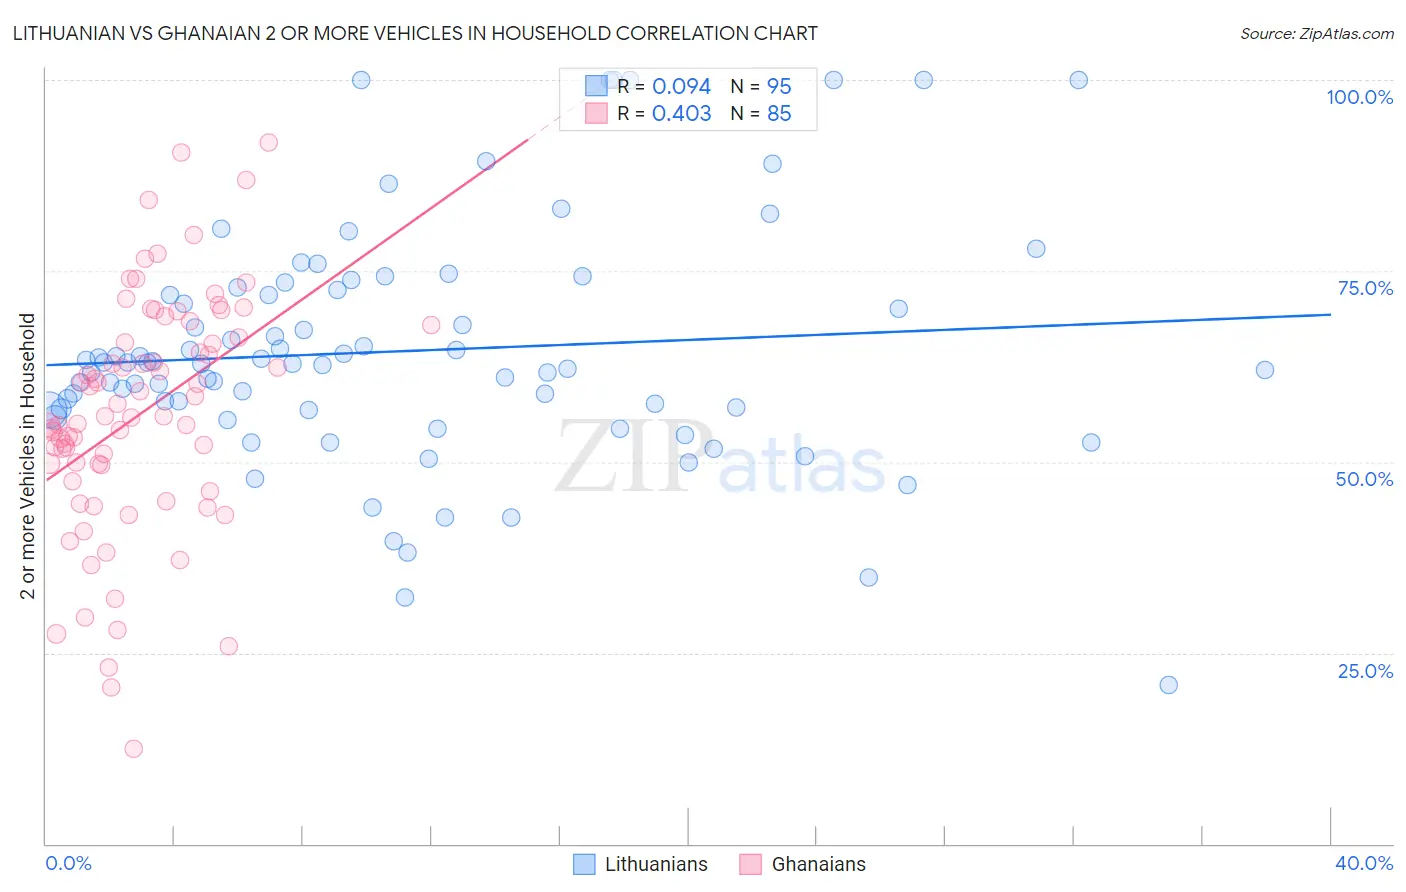
Lithuanian vs Ghanaian 2 or more Vehicles in Household Correlation Chart
The statistical analysis conducted on geographies consisting of 421,771,699 people shows a slight positive correlation between the proportion of Lithuanians and percentage of households with 2 or more vehicles available in the United States with a correlation coefficient (R) of 0.094 and weighted average of 58.2%. Similarly, the statistical analysis conducted on geographies consisting of 190,548,121 people shows a moderate positive correlation between the proportion of Ghanaians and percentage of households with 2 or more vehicles available in the United States with a correlation coefficient (R) of 0.403 and weighted average of 48.0%, a difference of 21.4%.
2 or more Vehicles in Household Correlation Summary
| Measurement | Lithuanian | Ghanaian |
| Minimum | 20.9% | 12.4% |
| Maximum | 100.0% | 91.9% |
| Range | 79.1% | 79.5% |
| Mean | 64.5% | 56.3% |
| Median | 62.8% | 55.9% |
| Interquartile 25% (IQ1) | 56.8% | 48.5% |
| Interquartile 75% (IQ3) | 72.5% | 67.2% |
| Interquartile Range (IQR) | 15.7% | 18.7% |
| Standard Deviation (Sample) | 15.4% | 15.6% |
| Standard Deviation (Population) | 15.4% | 15.5% |
Similar Demographics by 2 or more Vehicles in Household
Demographics Similar to Lithuanians by 2 or more Vehicles in Household
In terms of 2 or more vehicles in household, the demographic groups most similar to Lithuanians are Slovene (58.3%, a difference of 0.050%), Creek (58.3%, a difference of 0.060%), Delaware (58.2%, a difference of 0.080%), Polish (58.3%, a difference of 0.10%), and Immigrants from Afghanistan (58.3%, a difference of 0.17%).
| Demographics | Rating | Rank | 2 or more Vehicles in Household |
| Bangladeshis | 99.6 /100 | #71 | Exceptional 58.4% |
| Austrians | 99.6 /100 | #72 | Exceptional 58.4% |
| Bolivians | 99.6 /100 | #73 | Exceptional 58.3% |
| Immigrants | Afghanistan | 99.6 /100 | #74 | Exceptional 58.3% |
| Poles | 99.5 /100 | #75 | Exceptional 58.3% |
| Creek | 99.5 /100 | #76 | Exceptional 58.3% |
| Slovenes | 99.5 /100 | #77 | Exceptional 58.3% |
| Lithuanians | 99.5 /100 | #78 | Exceptional 58.2% |
| Delaware | 99.4 /100 | #79 | Exceptional 58.2% |
| Immigrants | England | 99.3 /100 | #80 | Exceptional 58.1% |
| Immigrants | Iraq | 99.3 /100 | #81 | Exceptional 58.1% |
| Iranians | 99.3 /100 | #82 | Exceptional 58.1% |
| Icelanders | 99.2 /100 | #83 | Exceptional 58.0% |
| Maltese | 99.2 /100 | #84 | Exceptional 58.0% |
| Slovaks | 99.2 /100 | #85 | Exceptional 58.0% |
Demographics Similar to Ghanaians by 2 or more Vehicles in Household
In terms of 2 or more vehicles in household, the demographic groups most similar to Ghanaians are Immigrants from Belarus (47.9%, a difference of 0.12%), Haitian (47.6%, a difference of 0.86%), U.S. Virgin Islander (47.5%, a difference of 1.0%), Immigrants from Ghana (47.4%, a difference of 1.3%), and Moroccan (48.8%, a difference of 1.8%).
| Demographics | Rating | Rank | 2 or more Vehicles in Household |
| Tohono O'odham | 0.0 /100 | #303 | Tragic 50.0% |
| Immigrants | Belize | 0.0 /100 | #304 | Tragic 49.9% |
| Immigrants | Western Africa | 0.0 /100 | #305 | Tragic 49.4% |
| Immigrants | Israel | 0.0 /100 | #306 | Tragic 49.2% |
| Hopi | 0.0 /100 | #307 | Tragic 49.0% |
| Albanians | 0.0 /100 | #308 | Tragic 49.0% |
| Moroccans | 0.0 /100 | #309 | Tragic 48.8% |
| Ghanaians | 0.0 /100 | #310 | Tragic 48.0% |
| Immigrants | Belarus | 0.0 /100 | #311 | Tragic 47.9% |
| Haitians | 0.0 /100 | #312 | Tragic 47.6% |
| U.S. Virgin Islanders | 0.0 /100 | #313 | Tragic 47.5% |
| Immigrants | Ghana | 0.0 /100 | #314 | Tragic 47.4% |
| Puerto Ricans | 0.0 /100 | #315 | Tragic 47.1% |
| Cape Verdeans | 0.0 /100 | #316 | Tragic 46.8% |
| Immigrants | Haiti | 0.0 /100 | #317 | Tragic 46.5% |