Lithuanian vs Immigrants from Uruguay 2 or more Vehicles in Household
COMPARE
Lithuanian
Immigrants from Uruguay
2 or more Vehicles in Household
2 or more Vehicles in Household Comparison
Lithuanians
Immigrants from Uruguay
58.2%
2 OR MORE VEHICLES IN HOUSEHOLD
99.5/ 100
METRIC RATING
78th/ 347
METRIC RANK
51.4%
2 OR MORE VEHICLES IN HOUSEHOLD
0.1/ 100
METRIC RATING
285th/ 347
METRIC RANK
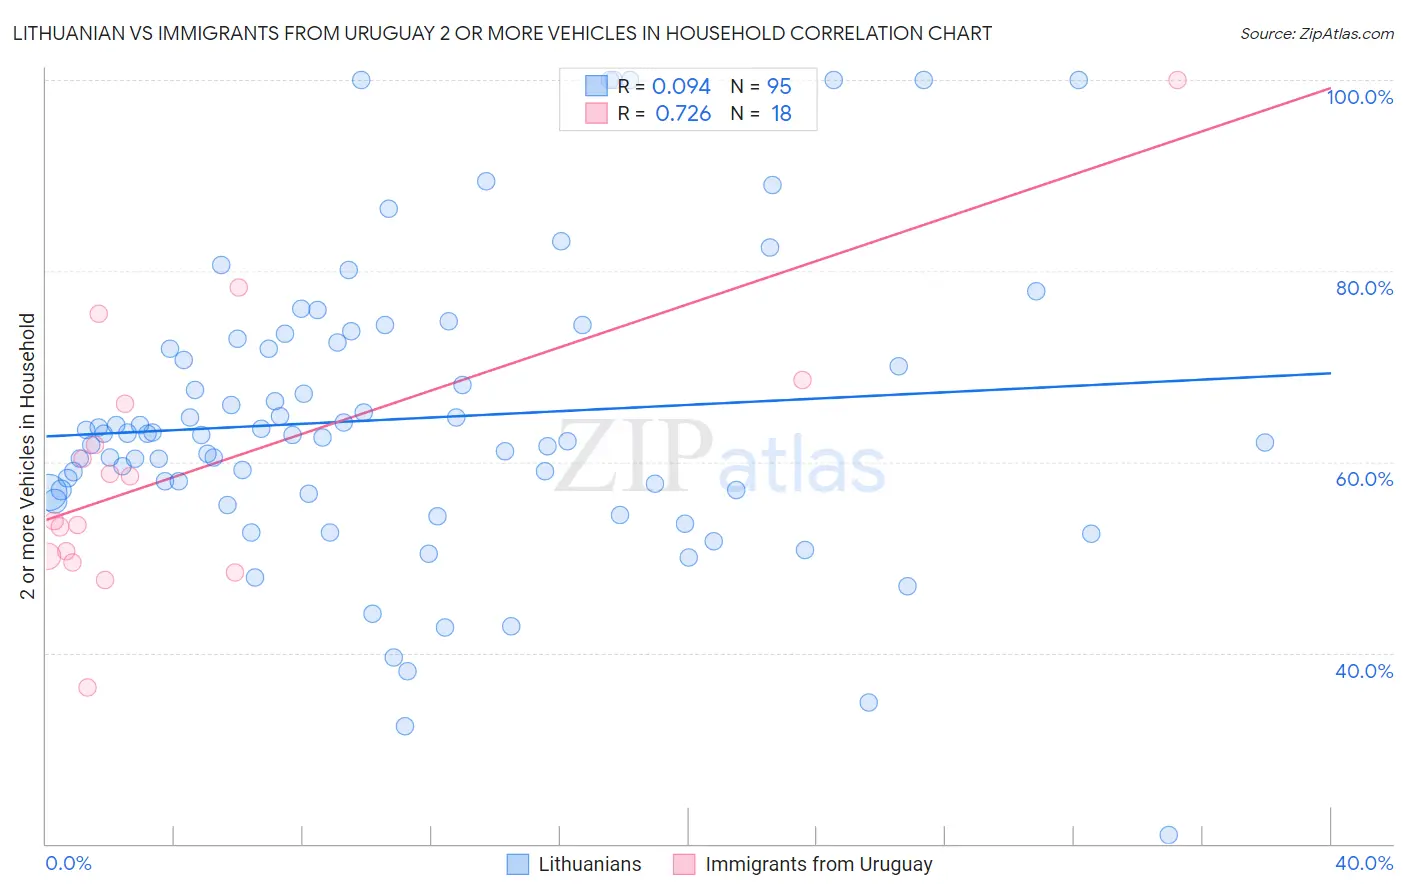
Lithuanian vs Immigrants from Uruguay 2 or more Vehicles in Household Correlation Chart
The statistical analysis conducted on geographies consisting of 421,771,699 people shows a slight positive correlation between the proportion of Lithuanians and percentage of households with 2 or more vehicles available in the United States with a correlation coefficient (R) of 0.094 and weighted average of 58.2%. Similarly, the statistical analysis conducted on geographies consisting of 133,245,142 people shows a strong positive correlation between the proportion of Immigrants from Uruguay and percentage of households with 2 or more vehicles available in the United States with a correlation coefficient (R) of 0.726 and weighted average of 51.4%, a difference of 13.3%.
2 or more Vehicles in Household Correlation Summary
| Measurement | Lithuanian | Immigrants from Uruguay |
| Minimum | 20.9% | 36.3% |
| Maximum | 100.0% | 100.0% |
| Range | 79.1% | 63.7% |
| Mean | 64.5% | 59.5% |
| Median | 62.8% | 56.2% |
| Interquartile 25% (IQ1) | 56.8% | 50.1% |
| Interquartile 75% (IQ3) | 72.5% | 66.0% |
| Interquartile Range (IQR) | 15.7% | 16.0% |
| Standard Deviation (Sample) | 15.4% | 14.5% |
| Standard Deviation (Population) | 15.4% | 14.1% |
Similar Demographics by 2 or more Vehicles in Household
Demographics Similar to Lithuanians by 2 or more Vehicles in Household
In terms of 2 or more vehicles in household, the demographic groups most similar to Lithuanians are Slovene (58.3%, a difference of 0.050%), Creek (58.3%, a difference of 0.060%), Delaware (58.2%, a difference of 0.080%), Polish (58.3%, a difference of 0.10%), and Immigrants from Afghanistan (58.3%, a difference of 0.17%).
| Demographics | Rating | Rank | 2 or more Vehicles in Household |
| Bangladeshis | 99.6 /100 | #71 | Exceptional 58.4% |
| Austrians | 99.6 /100 | #72 | Exceptional 58.4% |
| Bolivians | 99.6 /100 | #73 | Exceptional 58.3% |
| Immigrants | Afghanistan | 99.6 /100 | #74 | Exceptional 58.3% |
| Poles | 99.5 /100 | #75 | Exceptional 58.3% |
| Creek | 99.5 /100 | #76 | Exceptional 58.3% |
| Slovenes | 99.5 /100 | #77 | Exceptional 58.3% |
| Lithuanians | 99.5 /100 | #78 | Exceptional 58.2% |
| Delaware | 99.4 /100 | #79 | Exceptional 58.2% |
| Immigrants | England | 99.3 /100 | #80 | Exceptional 58.1% |
| Immigrants | Iraq | 99.3 /100 | #81 | Exceptional 58.1% |
| Iranians | 99.3 /100 | #82 | Exceptional 58.1% |
| Icelanders | 99.2 /100 | #83 | Exceptional 58.0% |
| Maltese | 99.2 /100 | #84 | Exceptional 58.0% |
| Slovaks | 99.2 /100 | #85 | Exceptional 58.0% |
Demographics Similar to Immigrants from Uruguay by 2 or more Vehicles in Household
In terms of 2 or more vehicles in household, the demographic groups most similar to Immigrants from Uruguay are Immigrants from Liberia (51.3%, a difference of 0.14%), Immigrants from Zaire (51.5%, a difference of 0.16%), Immigrants from Serbia (51.3%, a difference of 0.17%), Immigrants from China (51.5%, a difference of 0.20%), and Bahamian (51.5%, a difference of 0.28%).
| Demographics | Rating | Rank | 2 or more Vehicles in Household |
| Yuman | 0.1 /100 | #278 | Tragic 51.7% |
| Liberians | 0.1 /100 | #279 | Tragic 51.7% |
| Immigrants | Eastern Europe | 0.1 /100 | #280 | Tragic 51.7% |
| Immigrants | Kazakhstan | 0.1 /100 | #281 | Tragic 51.6% |
| Bahamians | 0.1 /100 | #282 | Tragic 51.5% |
| Immigrants | China | 0.1 /100 | #283 | Tragic 51.5% |
| Immigrants | Zaire | 0.1 /100 | #284 | Tragic 51.5% |
| Immigrants | Uruguay | 0.1 /100 | #285 | Tragic 51.4% |
| Immigrants | Liberia | 0.1 /100 | #286 | Tragic 51.3% |
| Immigrants | Serbia | 0.1 /100 | #287 | Tragic 51.3% |
| Okinawans | 0.1 /100 | #288 | Tragic 51.2% |
| Somalis | 0.0 /100 | #289 | Tragic 51.1% |
| Immigrants | Panama | 0.0 /100 | #290 | Tragic 51.1% |
| Belizeans | 0.0 /100 | #291 | Tragic 51.0% |
| Immigrants | Ukraine | 0.0 /100 | #292 | Tragic 50.9% |