Lithuanian vs Taiwanese 2 or more Vehicles in Household

COMPARE

Lithuanian
Race
Ancestry
AfghanAfricanAlaska NativeAlaskan AthabascanAlbanianAleutAlsatianAmericanApacheArabArapahoArgentineanArmenianAssyrian/Chaldean/SyriacAustralianAustrianBahamianBangladeshiBarbadianBasqueBelgianBelizeanBermudanBhutaneseBlackfeetBolivianBrazilianBritishBritish West IndianBulgarianBurmeseCajunCambodianCanadianCape VerdeanCarpatho RusynCelticCentral AmericanCentral American IndianCherokeeCheyenneChickasawChileanChineseChippewaChoctawColombianColvilleComancheCosta RicanCreeCreekCroatianCrowCubanCypriotCzechCzechoslovakianDanishDelawareDominicanDutchDutch West IndianEastern EuropeanEcuadorianEgyptianEnglishEstonianEthiopianEuropeanFijianFilipinoFinnishFrenchFrench American IndianFrench CanadianGermanGerman RussianGhanaianGreekGuamanian/ChamorroGuatemalanGuyaneseHaitianHmongHonduranHopiHoumaHungarianIcelanderIndian (Asian)IndonesianInupiatIranianIraqiIrishIroquoisIsraeliItalianJamaicanJapaneseJordanianKenyanKiowaKoreanLaotianLatvianLebaneseLiberianLithuanianLumbeeLuxembourgerMacedonianMalaysianMalteseMarshalleseMenomineeMexicanMexican American IndianMongolianMoroccanNative HawaiianNavajoNepaleseNew ZealanderNicaraguanNigerianNorthern EuropeanNorwegianOkinawanOsageOttawaPaiutePakistaniPalestinianPanamanianParaguayanPennsylvania GermanPeruvianPimaPolishPortuguesePotawatomiPuebloPuerto RicanPuget Sound SalishRomanianRussianSalvadoranSamoanScandinavianScotch-IrishScottishSeminoleSenegaleseSerbianShoshoneSierra LeoneanSiouxSlavicSlovakSloveneSomaliSouth AfricanSouth AmericanSouth American IndianSoviet UnionSpaniardSpanishSpanish AmericanSpanish American IndianSri LankanSubsaharan AfricanSudaneseSwedishSwissSyrianThaiTlingit-HaidaTohono O'OdhamTonganTrinidadian and TobagonianTsimshianTurkishU.S. Virgin IslanderUgandanUkrainianUruguayanUteVenezuelanVietnameseWelshWest IndianYakamaYaquiYugoslavianYumanYup'ikZimbabwean
Immigration
NonimmigrantsImmigrantsAfghanistanAfricaAlbaniaArgentinaArmeniaAsiaAustraliaAustriaBahamasBangladeshBarbadosBelarusBelgiumBelizeBoliviaBosnia and HerzegovinaBrazilBulgariaBurma/MyanmarCabo VerdeCambodiaCameroonCanadaCaribbeanCentral AmericaChileChinaColombiaCongoCosta RicaCroatiaCubaCzechoslovakiaDenmarkDominicaDominican RepublicEastern AfricaEastern AsiaEastern EuropeEcuadorEgyptEl SalvadorEnglandEritreaEthiopiaEuropeFijiFranceGermanyGhanaGreeceGrenadaGuatemalaGuyanaHaitiHondurasHong KongHungaryIndiaIndonesiaIranIraqIrelandIsraelItalyJamaicaJapanJordanKazakhstanKenyaKoreaKuwaitLaosLatin AmericaLatviaLebanonLiberiaLithuaniaMalaysiaMexicoMicronesiaMiddle AfricaMoldovaMoroccoNepalNetherlandsNicaraguaNigeriaNorth AmericaNorth MacedoniaNorthern AfricaNorthern EuropeNorwayOceaniaPakistanPanamaPeruPhilippinesPolandPortugalRomaniaRussiaSaudi ArabiaScotlandSenegalSerbiaSierra LeoneSingaporeSomaliaSouth AfricaSouth AmericaSouth Central AsiaSouth Eastern AsiaSouthern EuropeSpainSri LankaSt. Vincent and the GrenadinesSudanSwedenSwitzerlandSyriaTaiwanThailandTrinidad and TobagoTurkeyUgandaUkraineUruguayUzbekistanVenezuelaVietnamWest IndiesWestern AfricaWestern AsiaWestern EuropeYemenZaireZimbabweAzores
Taiwanese
Race
Ancestry
AfghanAfricanAlaska NativeAlaskan AthabascanAlbanianAleutAlsatianAmericanApacheArabArapahoArgentineanArmenianAssyrian/Chaldean/SyriacAustralianAustrianBahamianBangladeshiBarbadianBasqueBelgianBelizeanBermudanBhutaneseBlackfeetBolivianBrazilianBritishBritish West IndianBulgarianBurmeseCajunCambodianCanadianCape VerdeanCarpatho RusynCelticCentral AmericanCentral American IndianCherokeeCheyenneChickasawChileanChineseChippewaChoctawColombianColvilleComancheCosta RicanCreeCreekCroatianCrowCubanCypriotCzechCzechoslovakianDanishDelawareDominicanDutchDutch West IndianEastern EuropeanEcuadorianEgyptianEnglishEstonianEthiopianEuropeanFijianFilipinoFinnishFrenchFrench American IndianFrench CanadianGermanGerman RussianGhanaianGreekGuamanian/ChamorroGuatemalanGuyaneseHaitianHmongHonduranHopiHoumaHungarianIcelanderIndian (Asian)IndonesianInupiatIranianIraqiIrishIroquoisIsraeliItalianJamaicanJapaneseJordanianKenyanKiowaKoreanLaotianLatvianLebaneseLiberianLumbeeLuxembourgerMacedonianMalaysianMalteseMarshalleseMenomineeMexicanMexican American IndianMongolianMoroccanNative HawaiianNavajoNepaleseNew ZealanderNicaraguanNigerianNorthern EuropeanNorwegianOkinawanOsageOttawaPaiutePakistaniPalestinianPanamanianParaguayanPennsylvania GermanPeruvianPimaPolishPortuguesePotawatomiPuebloPuerto RicanPuget Sound SalishRomanianRussianSalvadoranSamoanScandinavianScotch-IrishScottishSeminoleSenegaleseSerbianShoshoneSierra LeoneanSiouxSlavicSlovakSloveneSomaliSouth AfricanSouth AmericanSouth American IndianSoviet UnionSpaniardSpanishSpanish AmericanSpanish American IndianSri LankanSubsaharan AfricanSudaneseSwedishSwissSyrianTaiwaneseThaiTlingit-HaidaTohono O'OdhamTonganTrinidadian and TobagonianTsimshianTurkishU.S. Virgin IslanderUgandanUkrainianUruguayanUteVenezuelanVietnameseWelshWest IndianYakamaYaquiYugoslavianYumanYup'ikZimbabwean
Immigration
NonimmigrantsImmigrantsAfghanistanAfricaAlbaniaArgentinaArmeniaAsiaAustraliaAustriaBahamasBangladeshBarbadosBelarusBelgiumBelizeBoliviaBosnia and HerzegovinaBrazilBulgariaBurma/MyanmarCabo VerdeCambodiaCameroonCanadaCaribbeanCentral AmericaChileChinaColombiaCongoCosta RicaCroatiaCubaCzechoslovakiaDenmarkDominicaDominican RepublicEastern AfricaEastern AsiaEastern EuropeEcuadorEgyptEl SalvadorEnglandEritreaEthiopiaEuropeFijiFranceGermanyGhanaGreeceGrenadaGuatemalaGuyanaHaitiHondurasHong KongHungaryIndiaIndonesiaIranIraqIrelandIsraelItalyJamaicaJapanJordanKazakhstanKenyaKoreaKuwaitLaosLatin AmericaLatviaLebanonLiberiaLithuaniaMalaysiaMexicoMicronesiaMiddle AfricaMoldovaMoroccoNepalNetherlandsNicaraguaNigeriaNorth AmericaNorth MacedoniaNorthern AfricaNorthern EuropeNorwayOceaniaPakistanPanamaPeruPhilippinesPolandPortugalRomaniaRussiaSaudi ArabiaScotlandSenegalSerbiaSierra LeoneSingaporeSomaliaSouth AfricaSouth AmericaSouth Central AsiaSouth Eastern AsiaSouthern EuropeSpainSri LankaSt. Vincent and the GrenadinesSudanSwedenSwitzerlandSyriaTaiwanThailandTrinidad and TobagoTurkeyUgandaUkraineUruguayUzbekistanVenezuelaVietnamWest IndiesWestern AfricaWestern AsiaWestern EuropeYemenZaireZimbabweAzores
2 or more Vehicles in Household
Income
Poverty
Unemployment
Labor Participation
Family Structure
Vehicle Availability
Education Level
Disability

2 or more Vehicles in Household Comparison

Lithuanians

Taiwanese

Exceptional
Tragic
58.2%
2 OR MORE VEHICLES IN HOUSEHOLD
99.5/ 100
METRIC RATING
78th/ 347
METRIC RANK
53.9%
2 OR MORE VEHICLES IN HOUSEHOLD
6.3/ 100
METRIC RATING
220th/ 347
METRIC RANK

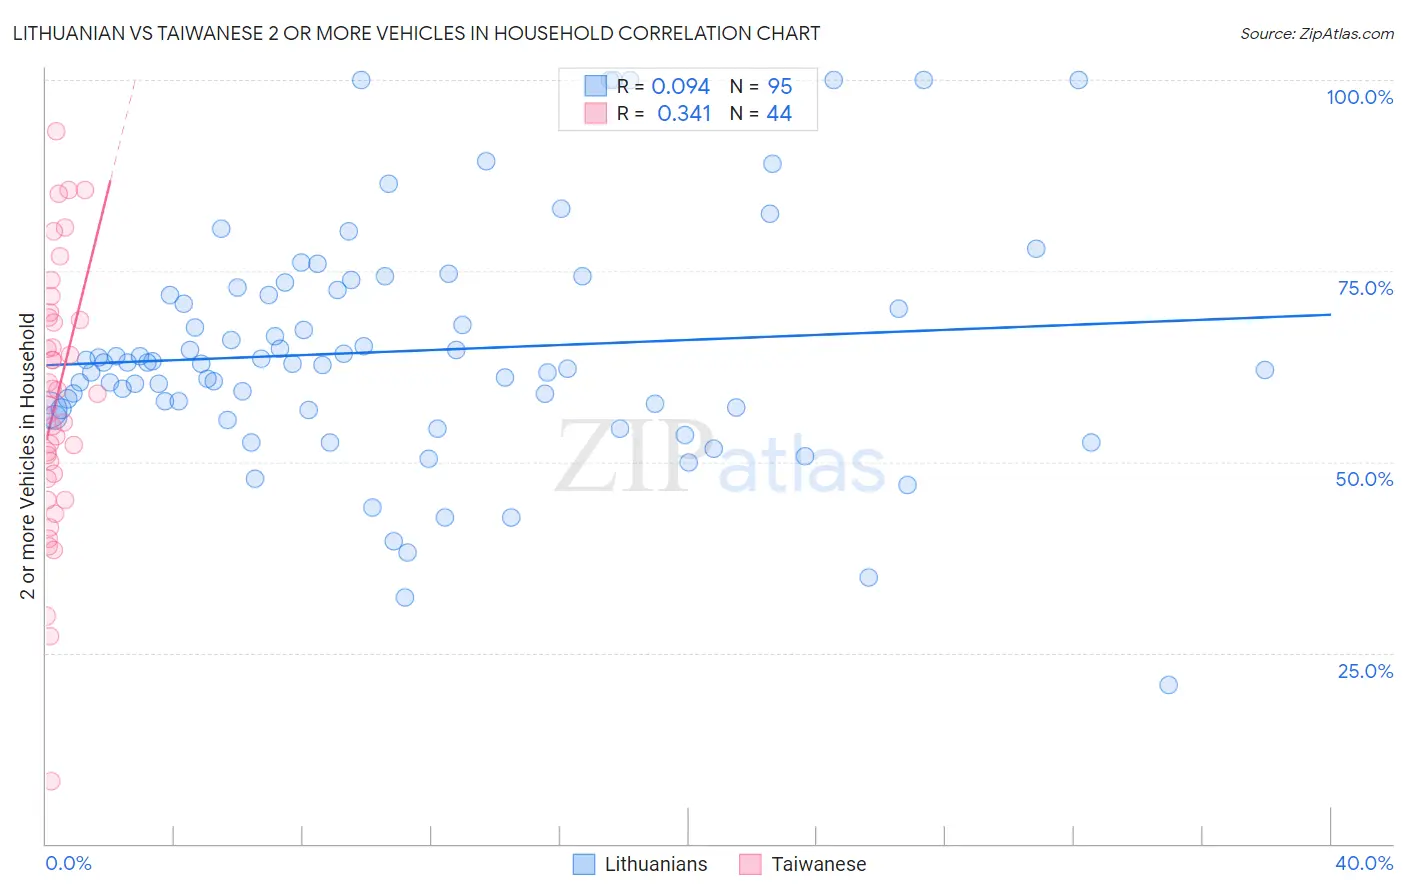
Lithuanian vs Taiwanese 2 or more Vehicles in Household Correlation Chart

The statistical analysis conducted on geographies consisting of 421,771,699 people shows a slight positive correlation between the proportion of Lithuanians and percentage of households with 2 or more vehicles available in the United States with a correlation coefficient (R) of 0.094 and weighted average of 58.2%. Similarly, the statistical analysis conducted on geographies consisting of 31,715,954 people shows a mild positive correlation between the proportion of Taiwanese and percentage of households with 2 or more vehicles available in the United States with a correlation coefficient (R) of 0.341 and weighted average of 53.9%, a difference of 8.1%.
Lithuanian vs Taiwanese 2 or more Vehicles in Household

2 or more Vehicles in Household Correlation Summary

MeasurementLithuanianTaiwanese
Minimum20.9%8.2%
Maximum100.0%93.3%
Range79.1%85.2%
Mean64.5%58.0%
Median62.8%58.2%
Interquartile 25% (IQ1)56.8%48.1%
Interquartile 75% (IQ3)72.5%68.8%
Interquartile Range (IQR)15.7%20.6%
Standard Deviation (Sample)15.4%17.1%
Standard Deviation (Population)15.4%16.9%

Similar Demographics by 2 or more Vehicles in Household

Demographics Similar to Lithuanians by 2 or more Vehicles in Household

In terms of 2 or more vehicles in household, the demographic groups most similar to Lithuanians are Slovene (58.3%, a difference of 0.050%), Creek (58.3%, a difference of 0.060%), Delaware (58.2%, a difference of 0.080%), Polish (58.3%, a difference of 0.10%), and Immigrants from Afghanistan (58.3%, a difference of 0.17%).
DemographicsRating | Rank2 or more Vehicles in Household
Bangladeshis
99.6
/100
|
#71
Exceptional
58.4%
Austrians
99.6
/100
|
#72
Exceptional
58.4%
Bolivians
99.6
/100
|
#73
Exceptional
58.3%
Immigrants | Afghanistan
99.6
/100
|
#74
Exceptional
58.3%
Poles
99.5
/100
|
#75
Exceptional
58.3%
Creek
99.5
/100
|
#76
Exceptional
58.3%
Slovenes
99.5
/100
|
#77
Exceptional
58.3%
Lithuanians
99.5
/100
|
#78
Exceptional
58.2%
Delaware
99.4
/100
|
#79
Exceptional
58.2%
Immigrants | England
99.3
/100
|
#80
Exceptional
58.1%
Immigrants | Iraq
99.3
/100
|
#81
Exceptional
58.1%
Iranians
99.3
/100
|
#82
Exceptional
58.1%
Icelanders
99.2
/100
|
#83
Exceptional
58.0%
Maltese
99.2
/100
|
#84
Exceptional
58.0%
Slovaks
99.2
/100
|
#85
Exceptional
58.0%

Demographics Similar to Taiwanese by 2 or more Vehicles in Household

In terms of 2 or more vehicles in household, the demographic groups most similar to Taiwanese are Immigrants from Singapore (53.9%, a difference of 0.010%), South American Indian (53.9%, a difference of 0.020%), Kiowa (53.9%, a difference of 0.030%), Immigrants from Argentina (53.9%, a difference of 0.080%), and Immigrants from Burma/Myanmar (53.9%, a difference of 0.13%).
DemographicsRating | Rank2 or more Vehicles in Household
Guatemalans
9.6
/100
|
#213
Tragic
54.1%
Immigrants | Czechoslovakia
9.4
/100
|
#214
Tragic
54.1%
Aleuts
9.3
/100
|
#215
Tragic
54.1%
Immigrants | Western Asia
9.3
/100
|
#216
Tragic
54.1%
Immigrants | Burma/Myanmar
7.1
/100
|
#217
Tragic
53.9%
Immigrants | Argentina
6.8
/100
|
#218
Tragic
53.9%
South American Indians
6.5
/100
|
#219
Tragic
53.9%
Taiwanese
6.3
/100
|
#220
Tragic
53.9%
Immigrants | Singapore
6.3
/100
|
#221
Tragic
53.9%
Kiowa
6.2
/100
|
#222
Tragic
53.9%
Immigrants | Bosnia and Herzegovina
5.5
/100
|
#223
Tragic
53.8%
Brazilians
5.3
/100
|
#224
Tragic
53.8%
Immigrants | Egypt
5.2
/100
|
#225
Tragic
53.8%
Immigrants | Eastern Africa
5.1
/100
|
#226
Tragic
53.7%
Sudanese
4.1
/100
|
#227
Tragic
53.6%