Indian (Asian) vs Chippewa 2 or more Vehicles in Household
COMPARE
Indian (Asian)
Chippewa
2 or more Vehicles in Household
2 or more Vehicles in Household Comparison
Indians (Asian)
Chippewa
53.1%
2 OR MORE VEHICLES IN HOUSEHOLD
1.7/ 100
METRIC RATING
244th/ 347
METRIC RANK
57.2%
2 OR MORE VEHICLES IN HOUSEHOLD
96.6/ 100
METRIC RATING
115th/ 347
METRIC RANK
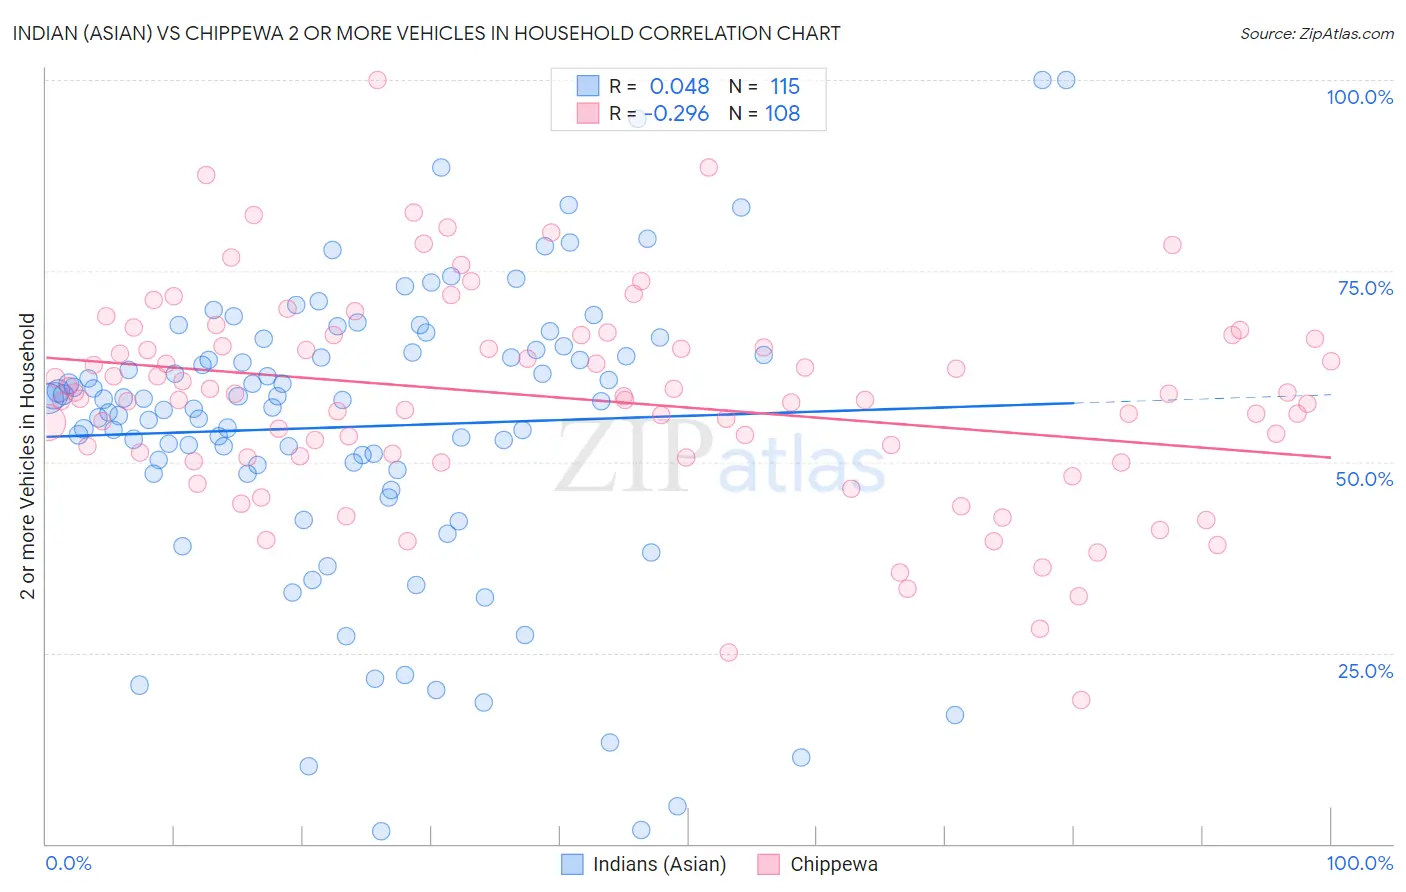
Indian (Asian) vs Chippewa 2 or more Vehicles in Household Correlation Chart
The statistical analysis conducted on geographies consisting of 494,844,203 people shows no correlation between the proportion of Indians (Asian) and percentage of households with 2 or more vehicles available in the United States with a correlation coefficient (R) of 0.048 and weighted average of 53.1%. Similarly, the statistical analysis conducted on geographies consisting of 215,015,237 people shows a weak negative correlation between the proportion of Chippewa and percentage of households with 2 or more vehicles available in the United States with a correlation coefficient (R) of -0.296 and weighted average of 57.2%, a difference of 7.7%.
2 or more Vehicles in Household Correlation Summary
| Measurement | Indian (Asian) | Chippewa |
| Minimum | 1.7% | 18.9% |
| Maximum | 100.0% | 100.0% |
| Range | 98.3% | 81.1% |
| Mean | 54.6% | 58.3% |
| Median | 58.2% | 58.5% |
| Interquartile 25% (IQ1) | 49.0% | 50.7% |
| Interquartile 75% (IQ3) | 64.6% | 66.4% |
| Interquartile Range (IQR) | 15.6% | 15.7% |
| Standard Deviation (Sample) | 19.2% | 13.7% |
| Standard Deviation (Population) | 19.2% | 13.7% |
Similar Demographics by 2 or more Vehicles in Household
Demographics Similar to Indians (Asian) by 2 or more Vehicles in Household
In terms of 2 or more vehicles in household, the demographic groups most similar to Indians (Asian) are Ethiopian (53.1%, a difference of 0.040%), Immigrants from Ethiopia (53.0%, a difference of 0.12%), Immigrants from Eastern Asia (53.2%, a difference of 0.23%), Immigrants from Sierra Leone (53.2%, a difference of 0.24%), and Immigrants from Europe (53.2%, a difference of 0.26%).
| Demographics | Rating | Rank | 2 or more Vehicles in Household |
| Macedonians | 2.4 /100 | #237 | Tragic 53.3% |
| Immigrants | Armenia | 2.3 /100 | #238 | Tragic 53.3% |
| Cambodians | 2.3 /100 | #239 | Tragic 53.3% |
| Immigrants | Europe | 2.1 /100 | #240 | Tragic 53.2% |
| Immigrants | Sierra Leone | 2.1 /100 | #241 | Tragic 53.2% |
| Immigrants | Eastern Asia | 2.1 /100 | #242 | Tragic 53.2% |
| Ethiopians | 1.7 /100 | #243 | Tragic 53.1% |
| Indians (Asian) | 1.7 /100 | #244 | Tragic 53.1% |
| Immigrants | Ethiopia | 1.5 /100 | #245 | Tragic 53.0% |
| Immigrants | Nigeria | 1.2 /100 | #246 | Tragic 52.9% |
| Sierra Leoneans | 1.2 /100 | #247 | Tragic 52.9% |
| Colombians | 1.1 /100 | #248 | Tragic 52.9% |
| Immigrants | Brazil | 1.0 /100 | #249 | Tragic 52.8% |
| Mongolians | 1.0 /100 | #250 | Tragic 52.8% |
| Immigrants | Sudan | 1.0 /100 | #251 | Tragic 52.8% |
Demographics Similar to Chippewa by 2 or more Vehicles in Household
In terms of 2 or more vehicles in household, the demographic groups most similar to Chippewa are Immigrants from Jordan (57.2%, a difference of 0.010%), Immigrants from Lebanon (57.2%, a difference of 0.050%), Zimbabwean (57.2%, a difference of 0.090%), Iraqi (57.1%, a difference of 0.20%), and Asian (57.0%, a difference of 0.37%).
| Demographics | Rating | Rank | 2 or more Vehicles in Household |
| Immigrants | Canada | 98.1 /100 | #108 | Exceptional 57.5% |
| Immigrants | North America | 98.1 /100 | #109 | Exceptional 57.5% |
| Japanese | 98.0 /100 | #110 | Exceptional 57.5% |
| Greeks | 98.0 /100 | #111 | Exceptional 57.5% |
| Pueblo | 98.0 /100 | #112 | Exceptional 57.5% |
| Zimbabweans | 96.9 /100 | #113 | Exceptional 57.2% |
| Immigrants | Lebanon | 96.8 /100 | #114 | Exceptional 57.2% |
| Chippewa | 96.6 /100 | #115 | Exceptional 57.2% |
| Immigrants | Jordan | 96.6 /100 | #116 | Exceptional 57.2% |
| Iraqis | 95.8 /100 | #117 | Exceptional 57.1% |
| Asians | 95.1 /100 | #118 | Exceptional 57.0% |
| Natives/Alaskans | 95.0 /100 | #119 | Exceptional 57.0% |
| Costa Ricans | 94.7 /100 | #120 | Exceptional 56.9% |
| Sioux | 93.8 /100 | #121 | Exceptional 56.8% |
| Immigrants | South Africa | 92.5 /100 | #122 | Exceptional 56.7% |