Immigrants from Israel vs Iranian 2 or more Vehicles in Household
COMPARE
Immigrants from Israel
Iranian
2 or more Vehicles in Household
2 or more Vehicles in Household Comparison
Immigrants from Israel
Iranians
49.2%
2 OR MORE VEHICLES IN HOUSEHOLD
0.0/ 100
METRIC RATING
306th/ 347
METRIC RANK
58.1%
2 OR MORE VEHICLES IN HOUSEHOLD
99.3/ 100
METRIC RATING
82nd/ 347
METRIC RANK
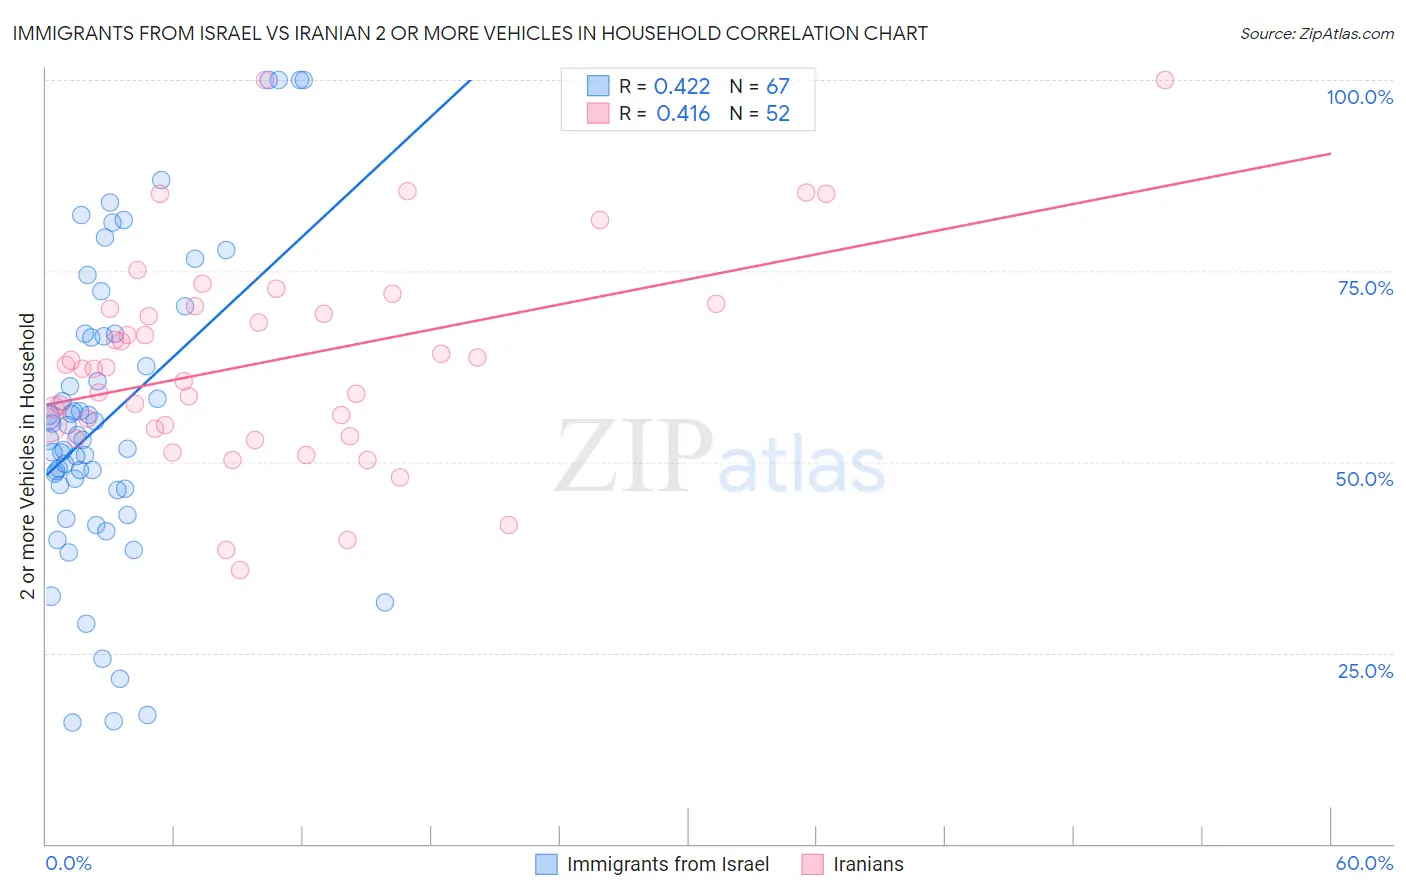
Immigrants from Israel vs Iranian 2 or more Vehicles in Household Correlation Chart
The statistical analysis conducted on geographies consisting of 209,979,242 people shows a moderate positive correlation between the proportion of Immigrants from Israel and percentage of households with 2 or more vehicles available in the United States with a correlation coefficient (R) of 0.422 and weighted average of 49.2%. Similarly, the statistical analysis conducted on geographies consisting of 316,668,802 people shows a moderate positive correlation between the proportion of Iranians and percentage of households with 2 or more vehicles available in the United States with a correlation coefficient (R) of 0.416 and weighted average of 58.1%, a difference of 17.9%.
2 or more Vehicles in Household Correlation Summary
| Measurement | Immigrants from Israel | Iranian |
| Minimum | 15.9% | 35.8% |
| Maximum | 100.0% | 100.0% |
| Range | 84.1% | 64.2% |
| Mean | 56.1% | 63.3% |
| Median | 53.6% | 62.3% |
| Interquartile 25% (IQ1) | 46.4% | 54.6% |
| Interquartile 75% (IQ3) | 66.7% | 70.2% |
| Interquartile Range (IQR) | 20.3% | 15.7% |
| Standard Deviation (Sample) | 19.7% | 13.8% |
| Standard Deviation (Population) | 19.5% | 13.7% |
Similar Demographics by 2 or more Vehicles in Household
Demographics Similar to Immigrants from Israel by 2 or more Vehicles in Household
In terms of 2 or more vehicles in household, the demographic groups most similar to Immigrants from Israel are Immigrants from Western Africa (49.4%, a difference of 0.26%), Hopi (49.0%, a difference of 0.43%), Albanian (49.0%, a difference of 0.50%), Moroccan (48.8%, a difference of 0.85%), and Immigrants from Belize (49.9%, a difference of 1.3%).
| Demographics | Rating | Rank | 2 or more Vehicles in Household |
| Immigrants | Morocco | 0.0 /100 | #299 | Tragic 50.3% |
| Immigrants | Russia | 0.0 /100 | #300 | Tragic 50.3% |
| Immigrants | Greece | 0.0 /100 | #301 | Tragic 50.2% |
| Immigrants | South America | 0.0 /100 | #302 | Tragic 50.2% |
| Tohono O'odham | 0.0 /100 | #303 | Tragic 50.0% |
| Immigrants | Belize | 0.0 /100 | #304 | Tragic 49.9% |
| Immigrants | Western Africa | 0.0 /100 | #305 | Tragic 49.4% |
| Immigrants | Israel | 0.0 /100 | #306 | Tragic 49.2% |
| Hopi | 0.0 /100 | #307 | Tragic 49.0% |
| Albanians | 0.0 /100 | #308 | Tragic 49.0% |
| Moroccans | 0.0 /100 | #309 | Tragic 48.8% |
| Ghanaians | 0.0 /100 | #310 | Tragic 48.0% |
| Immigrants | Belarus | 0.0 /100 | #311 | Tragic 47.9% |
| Haitians | 0.0 /100 | #312 | Tragic 47.6% |
| U.S. Virgin Islanders | 0.0 /100 | #313 | Tragic 47.5% |
Demographics Similar to Iranians by 2 or more Vehicles in Household
In terms of 2 or more vehicles in household, the demographic groups most similar to Iranians are Icelander (58.0%, a difference of 0.040%), Maltese (58.0%, a difference of 0.070%), Immigrants from Iraq (58.1%, a difference of 0.080%), Immigrants from England (58.1%, a difference of 0.10%), and Slovak (58.0%, a difference of 0.13%).
| Demographics | Rating | Rank | 2 or more Vehicles in Household |
| Poles | 99.5 /100 | #75 | Exceptional 58.3% |
| Creek | 99.5 /100 | #76 | Exceptional 58.3% |
| Slovenes | 99.5 /100 | #77 | Exceptional 58.3% |
| Lithuanians | 99.5 /100 | #78 | Exceptional 58.2% |
| Delaware | 99.4 /100 | #79 | Exceptional 58.2% |
| Immigrants | England | 99.3 /100 | #80 | Exceptional 58.1% |
| Immigrants | Iraq | 99.3 /100 | #81 | Exceptional 58.1% |
| Iranians | 99.3 /100 | #82 | Exceptional 58.1% |
| Icelanders | 99.2 /100 | #83 | Exceptional 58.0% |
| Maltese | 99.2 /100 | #84 | Exceptional 58.0% |
| Slovaks | 99.2 /100 | #85 | Exceptional 58.0% |
| Potawatomi | 99.1 /100 | #86 | Exceptional 58.0% |
| Thais | 99.1 /100 | #87 | Exceptional 57.9% |
| Immigrants | Iran | 99.1 /100 | #88 | Exceptional 57.9% |
| Immigrants | Germany | 99.0 /100 | #89 | Exceptional 57.9% |