Immigrants from Israel vs Immigrants from Uzbekistan 2 or more Vehicles in Household
COMPARE
Immigrants from Israel
Immigrants from Uzbekistan
2 or more Vehicles in Household
2 or more Vehicles in Household Comparison
Immigrants from Israel
Immigrants from Uzbekistan
49.2%
2 OR MORE VEHICLES IN HOUSEHOLD
0.0/ 100
METRIC RATING
306th/ 347
METRIC RANK
37.9%
2 OR MORE VEHICLES IN HOUSEHOLD
0.0/ 100
METRIC RATING
338th/ 347
METRIC RANK
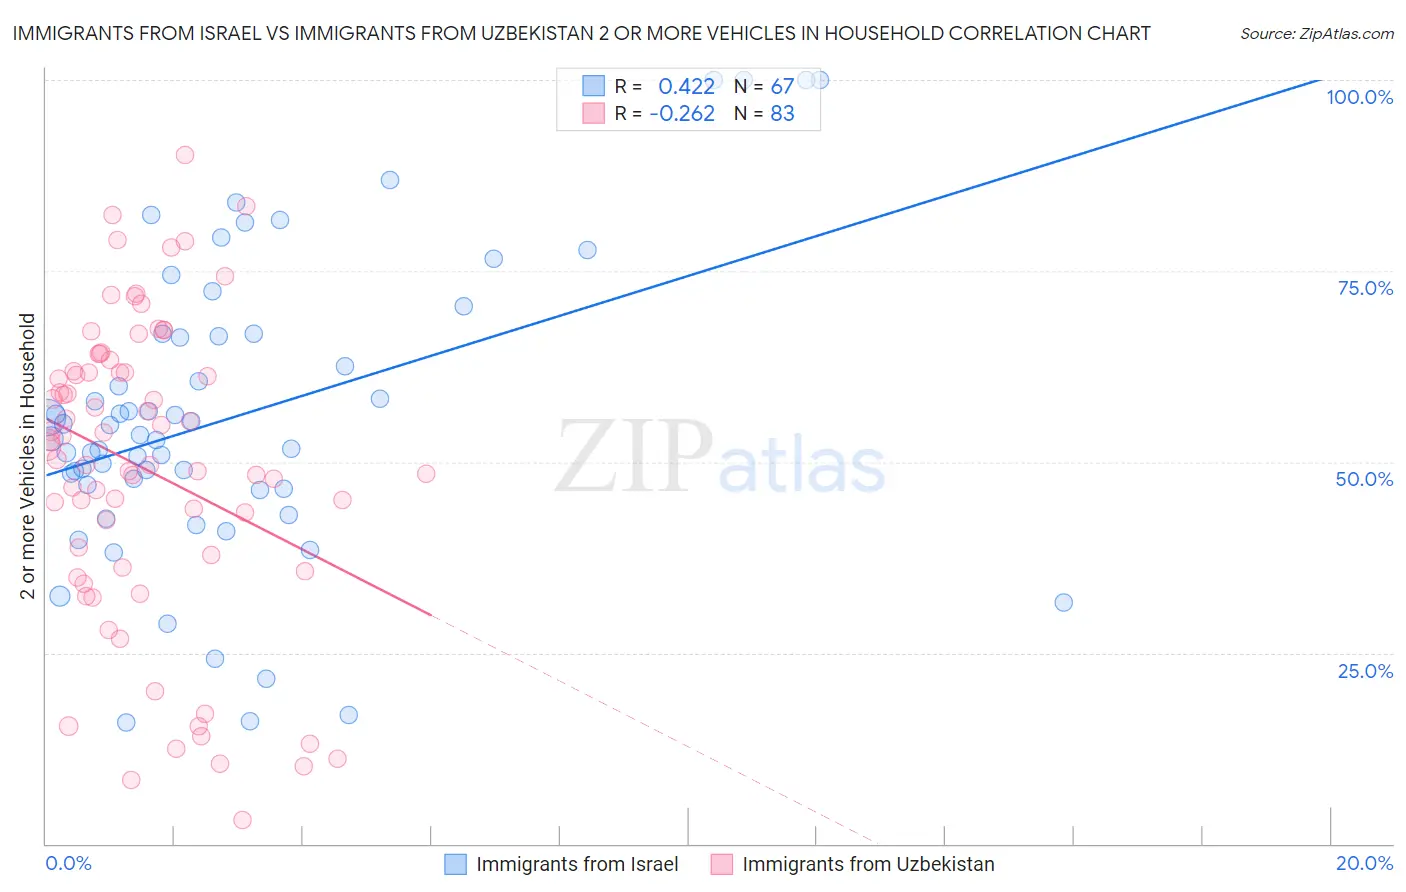
Immigrants from Israel vs Immigrants from Uzbekistan 2 or more Vehicles in Household Correlation Chart
The statistical analysis conducted on geographies consisting of 209,979,242 people shows a moderate positive correlation between the proportion of Immigrants from Israel and percentage of households with 2 or more vehicles available in the United States with a correlation coefficient (R) of 0.422 and weighted average of 49.2%. Similarly, the statistical analysis conducted on geographies consisting of 118,723,370 people shows a weak negative correlation between the proportion of Immigrants from Uzbekistan and percentage of households with 2 or more vehicles available in the United States with a correlation coefficient (R) of -0.262 and weighted average of 37.9%, a difference of 29.9%.
2 or more Vehicles in Household Correlation Summary
| Measurement | Immigrants from Israel | Immigrants from Uzbekistan |
| Minimum | 15.9% | 3.0% |
| Maximum | 100.0% | 90.2% |
| Range | 84.1% | 87.1% |
| Mean | 56.1% | 49.1% |
| Median | 53.6% | 52.0% |
| Interquartile 25% (IQ1) | 46.4% | 36.2% |
| Interquartile 75% (IQ3) | 66.7% | 61.9% |
| Interquartile Range (IQR) | 20.3% | 25.7% |
| Standard Deviation (Sample) | 19.7% | 20.0% |
| Standard Deviation (Population) | 19.5% | 19.9% |
Similar Demographics by 2 or more Vehicles in Household
Demographics Similar to Immigrants from Israel by 2 or more Vehicles in Household
In terms of 2 or more vehicles in household, the demographic groups most similar to Immigrants from Israel are Immigrants from Western Africa (49.4%, a difference of 0.26%), Hopi (49.0%, a difference of 0.43%), Albanian (49.0%, a difference of 0.50%), Moroccan (48.8%, a difference of 0.85%), and Immigrants from Belize (49.9%, a difference of 1.3%).
| Demographics | Rating | Rank | 2 or more Vehicles in Household |
| Immigrants | Morocco | 0.0 /100 | #299 | Tragic 50.3% |
| Immigrants | Russia | 0.0 /100 | #300 | Tragic 50.3% |
| Immigrants | Greece | 0.0 /100 | #301 | Tragic 50.2% |
| Immigrants | South America | 0.0 /100 | #302 | Tragic 50.2% |
| Tohono O'odham | 0.0 /100 | #303 | Tragic 50.0% |
| Immigrants | Belize | 0.0 /100 | #304 | Tragic 49.9% |
| Immigrants | Western Africa | 0.0 /100 | #305 | Tragic 49.4% |
| Immigrants | Israel | 0.0 /100 | #306 | Tragic 49.2% |
| Hopi | 0.0 /100 | #307 | Tragic 49.0% |
| Albanians | 0.0 /100 | #308 | Tragic 49.0% |
| Moroccans | 0.0 /100 | #309 | Tragic 48.8% |
| Ghanaians | 0.0 /100 | #310 | Tragic 48.0% |
| Immigrants | Belarus | 0.0 /100 | #311 | Tragic 47.9% |
| Haitians | 0.0 /100 | #312 | Tragic 47.6% |
| U.S. Virgin Islanders | 0.0 /100 | #313 | Tragic 47.5% |
Demographics Similar to Immigrants from Uzbekistan by 2 or more Vehicles in Household
In terms of 2 or more vehicles in household, the demographic groups most similar to Immigrants from Uzbekistan are Barbadian (38.3%, a difference of 1.2%), Vietnamese (38.5%, a difference of 1.6%), Immigrants from Bangladesh (38.8%, a difference of 2.3%), Immigrants from Barbados (35.8%, a difference of 5.9%), and Immigrants from Trinidad and Tobago (40.3%, a difference of 6.3%).
| Demographics | Rating | Rank | 2 or more Vehicles in Household |
| West Indians | 0.0 /100 | #331 | Tragic 41.3% |
| Trinidadians and Tobagonians | 0.0 /100 | #332 | Tragic 40.9% |
| Immigrants | Ecuador | 0.0 /100 | #333 | Tragic 40.5% |
| Immigrants | Trinidad and Tobago | 0.0 /100 | #334 | Tragic 40.3% |
| Immigrants | Bangladesh | 0.0 /100 | #335 | Tragic 38.8% |
| Vietnamese | 0.0 /100 | #336 | Tragic 38.5% |
| Barbadians | 0.0 /100 | #337 | Tragic 38.3% |
| Immigrants | Uzbekistan | 0.0 /100 | #338 | Tragic 37.9% |
| Immigrants | Barbados | 0.0 /100 | #339 | Tragic 35.8% |
| British West Indians | 0.0 /100 | #340 | Tragic 35.4% |
| Guyanese | 0.0 /100 | #341 | Tragic 35.4% |
| Dominicans | 0.0 /100 | #342 | Tragic 35.3% |
| Immigrants | Guyana | 0.0 /100 | #343 | Tragic 35.0% |
| Yup'ik | 0.0 /100 | #344 | Tragic 34.9% |
| Immigrants | Dominican Republic | 0.0 /100 | #345 | Tragic 33.2% |