Immigrants from Iran vs Apache 2 or more Vehicles in Household
COMPARE
Immigrants from Iran
Apache
2 or more Vehicles in Household
2 or more Vehicles in Household Comparison
Immigrants from Iran
Apache
57.9%
2 OR MORE VEHICLES IN HOUSEHOLD
99.1/ 100
METRIC RATING
88th/ 347
METRIC RANK
55.1%
2 OR MORE VEHICLES IN HOUSEHOLD
36.7/ 100
METRIC RATING
184th/ 347
METRIC RANK
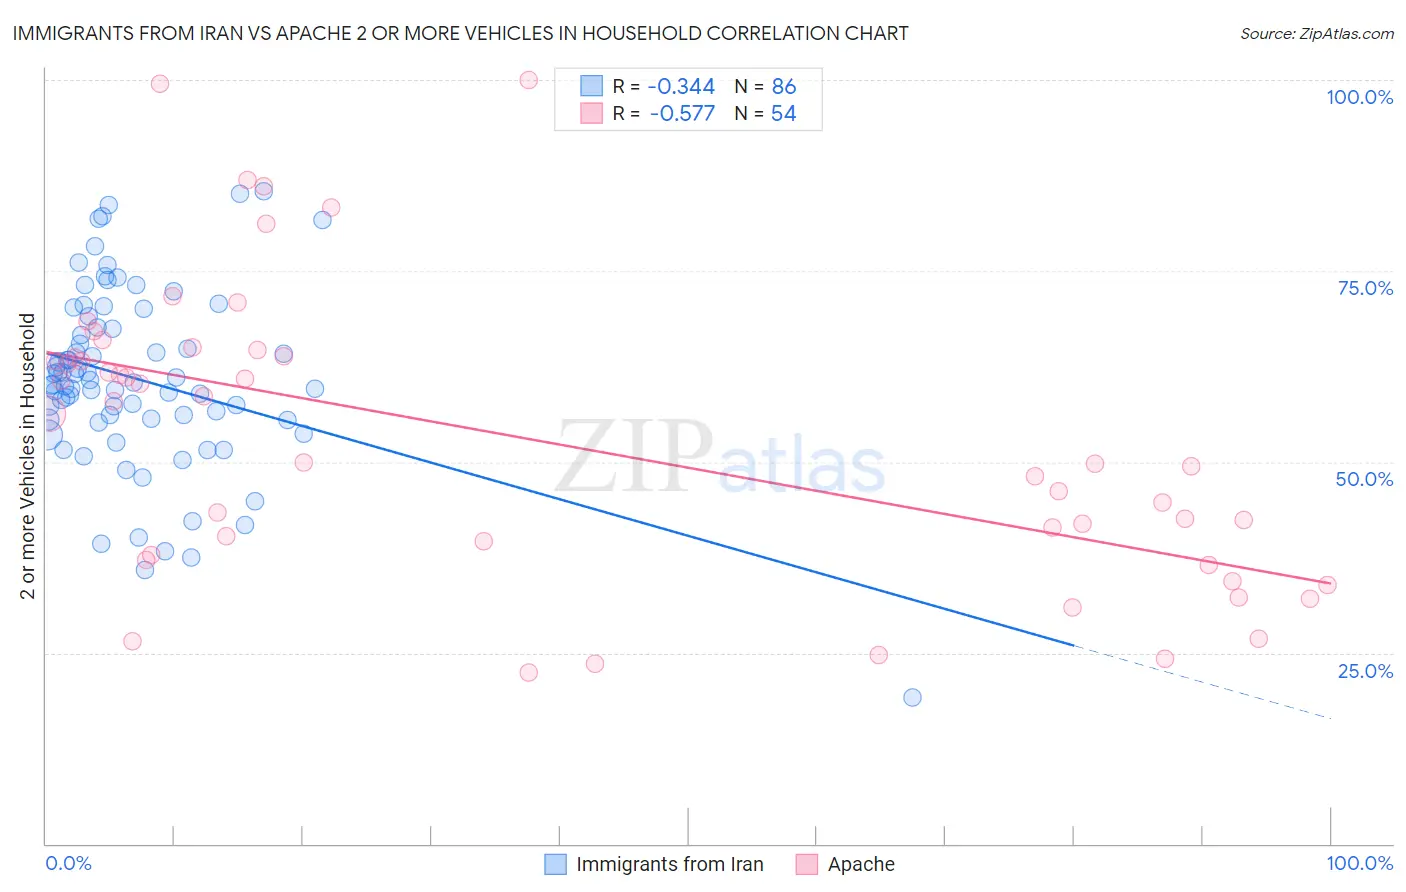
Immigrants from Iran vs Apache 2 or more Vehicles in Household Correlation Chart
The statistical analysis conducted on geographies consisting of 279,850,243 people shows a mild negative correlation between the proportion of Immigrants from Iran and percentage of households with 2 or more vehicles available in the United States with a correlation coefficient (R) of -0.344 and weighted average of 57.9%. Similarly, the statistical analysis conducted on geographies consisting of 231,042,318 people shows a substantial negative correlation between the proportion of Apache and percentage of households with 2 or more vehicles available in the United States with a correlation coefficient (R) of -0.577 and weighted average of 55.1%, a difference of 5.2%.
2 or more Vehicles in Household Correlation Summary
| Measurement | Immigrants from Iran | Apache |
| Minimum | 19.2% | 22.4% |
| Maximum | 85.4% | 100.0% |
| Range | 66.2% | 77.6% |
| Mean | 60.8% | 53.1% |
| Median | 60.2% | 53.1% |
| Interquartile 25% (IQ1) | 55.5% | 37.7% |
| Interquartile 75% (IQ3) | 67.5% | 63.7% |
| Interquartile Range (IQR) | 12.0% | 26.0% |
| Standard Deviation (Sample) | 11.9% | 19.2% |
| Standard Deviation (Population) | 11.8% | 19.1% |
Similar Demographics by 2 or more Vehicles in Household
Demographics Similar to Immigrants from Iran by 2 or more Vehicles in Household
In terms of 2 or more vehicles in household, the demographic groups most similar to Immigrants from Iran are Thai (57.9%, a difference of 0.010%), Potawatomi (58.0%, a difference of 0.050%), Immigrants from Germany (57.9%, a difference of 0.070%), Hispanic or Latino (57.9%, a difference of 0.070%), and Slovak (58.0%, a difference of 0.080%).
| Demographics | Rating | Rank | 2 or more Vehicles in Household |
| Immigrants | Iraq | 99.3 /100 | #81 | Exceptional 58.1% |
| Iranians | 99.3 /100 | #82 | Exceptional 58.1% |
| Icelanders | 99.2 /100 | #83 | Exceptional 58.0% |
| Maltese | 99.2 /100 | #84 | Exceptional 58.0% |
| Slovaks | 99.2 /100 | #85 | Exceptional 58.0% |
| Potawatomi | 99.1 /100 | #86 | Exceptional 58.0% |
| Thais | 99.1 /100 | #87 | Exceptional 57.9% |
| Immigrants | Iran | 99.1 /100 | #88 | Exceptional 57.9% |
| Immigrants | Germany | 99.0 /100 | #89 | Exceptional 57.9% |
| Hispanics or Latinos | 99.0 /100 | #90 | Exceptional 57.9% |
| Pakistanis | 99.0 /100 | #91 | Exceptional 57.9% |
| Shoshone | 99.0 /100 | #92 | Exceptional 57.9% |
| Ottawa | 99.0 /100 | #93 | Exceptional 57.9% |
| Filipinos | 98.9 /100 | #94 | Exceptional 57.8% |
| Hmong | 98.9 /100 | #95 | Exceptional 57.8% |
Demographics Similar to Apache by 2 or more Vehicles in Household
In terms of 2 or more vehicles in household, the demographic groups most similar to Apache are Immigrants from Cameroon (55.1%, a difference of 0.030%), Arab (55.0%, a difference of 0.030%), Immigrants from Micronesia (55.1%, a difference of 0.060%), Cree (55.1%, a difference of 0.060%), and Peruvian (55.0%, a difference of 0.13%).
| Demographics | Rating | Rank | 2 or more Vehicles in Household |
| Menominee | 46.2 /100 | #177 | Average 55.3% |
| Immigrants | Sweden | 45.3 /100 | #178 | Average 55.2% |
| Alaskan Athabascans | 42.9 /100 | #179 | Average 55.2% |
| Immigrants | Kenya | 40.4 /100 | #180 | Average 55.1% |
| Immigrants | Micronesia | 38.2 /100 | #181 | Fair 55.1% |
| Cree | 38.2 /100 | #182 | Fair 55.1% |
| Immigrants | Cameroon | 37.3 /100 | #183 | Fair 55.1% |
| Apache | 36.7 /100 | #184 | Fair 55.1% |
| Arabs | 35.9 /100 | #185 | Fair 55.0% |
| Peruvians | 33.7 /100 | #186 | Fair 55.0% |
| Immigrants | Uganda | 33.4 /100 | #187 | Fair 55.0% |
| Marshallese | 30.5 /100 | #188 | Fair 54.9% |
| Eastern Europeans | 27.5 /100 | #189 | Fair 54.8% |
| Russians | 26.3 /100 | #190 | Fair 54.8% |
| Immigrants | Immigrants | 25.0 /100 | #191 | Fair 54.7% |