Immigrants from Iran vs Sierra Leonean 2 or more Vehicles in Household
COMPARE
Immigrants from Iran
Sierra Leonean
2 or more Vehicles in Household
2 or more Vehicles in Household Comparison
Immigrants from Iran
Sierra Leoneans
57.9%
2 OR MORE VEHICLES IN HOUSEHOLD
99.1/ 100
METRIC RATING
88th/ 347
METRIC RANK
52.9%
2 OR MORE VEHICLES IN HOUSEHOLD
1.2/ 100
METRIC RATING
247th/ 347
METRIC RANK
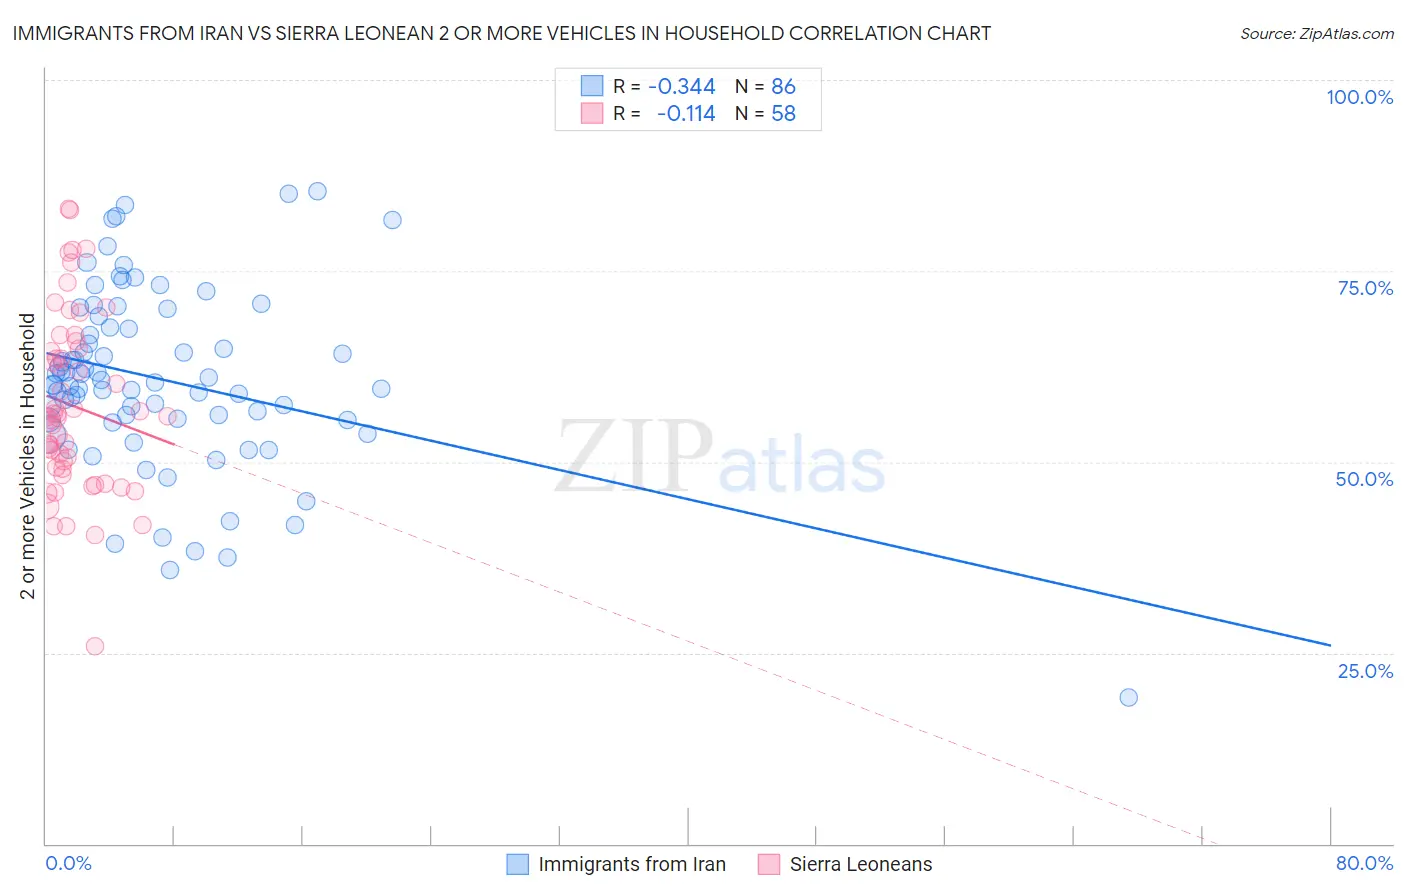
Immigrants from Iran vs Sierra Leonean 2 or more Vehicles in Household Correlation Chart
The statistical analysis conducted on geographies consisting of 279,850,243 people shows a mild negative correlation between the proportion of Immigrants from Iran and percentage of households with 2 or more vehicles available in the United States with a correlation coefficient (R) of -0.344 and weighted average of 57.9%. Similarly, the statistical analysis conducted on geographies consisting of 83,352,562 people shows a poor negative correlation between the proportion of Sierra Leoneans and percentage of households with 2 or more vehicles available in the United States with a correlation coefficient (R) of -0.114 and weighted average of 52.9%, a difference of 9.5%.
2 or more Vehicles in Household Correlation Summary
| Measurement | Immigrants from Iran | Sierra Leonean |
| Minimum | 19.2% | 25.9% |
| Maximum | 85.4% | 83.1% |
| Range | 66.2% | 57.3% |
| Mean | 60.8% | 57.3% |
| Median | 60.2% | 55.9% |
| Interquartile 25% (IQ1) | 55.5% | 49.0% |
| Interquartile 75% (IQ3) | 67.5% | 64.9% |
| Interquartile Range (IQR) | 12.0% | 15.8% |
| Standard Deviation (Sample) | 11.9% | 11.8% |
| Standard Deviation (Population) | 11.8% | 11.7% |
Similar Demographics by 2 or more Vehicles in Household
Demographics Similar to Immigrants from Iran by 2 or more Vehicles in Household
In terms of 2 or more vehicles in household, the demographic groups most similar to Immigrants from Iran are Thai (57.9%, a difference of 0.010%), Potawatomi (58.0%, a difference of 0.050%), Immigrants from Germany (57.9%, a difference of 0.070%), Hispanic or Latino (57.9%, a difference of 0.070%), and Slovak (58.0%, a difference of 0.080%).
| Demographics | Rating | Rank | 2 or more Vehicles in Household |
| Immigrants | Iraq | 99.3 /100 | #81 | Exceptional 58.1% |
| Iranians | 99.3 /100 | #82 | Exceptional 58.1% |
| Icelanders | 99.2 /100 | #83 | Exceptional 58.0% |
| Maltese | 99.2 /100 | #84 | Exceptional 58.0% |
| Slovaks | 99.2 /100 | #85 | Exceptional 58.0% |
| Potawatomi | 99.1 /100 | #86 | Exceptional 58.0% |
| Thais | 99.1 /100 | #87 | Exceptional 57.9% |
| Immigrants | Iran | 99.1 /100 | #88 | Exceptional 57.9% |
| Immigrants | Germany | 99.0 /100 | #89 | Exceptional 57.9% |
| Hispanics or Latinos | 99.0 /100 | #90 | Exceptional 57.9% |
| Pakistanis | 99.0 /100 | #91 | Exceptional 57.9% |
| Shoshone | 99.0 /100 | #92 | Exceptional 57.9% |
| Ottawa | 99.0 /100 | #93 | Exceptional 57.9% |
| Filipinos | 98.9 /100 | #94 | Exceptional 57.8% |
| Hmong | 98.9 /100 | #95 | Exceptional 57.8% |
Demographics Similar to Sierra Leoneans by 2 or more Vehicles in Household
In terms of 2 or more vehicles in household, the demographic groups most similar to Sierra Leoneans are Immigrants from Nigeria (52.9%, a difference of 0.030%), Colombian (52.9%, a difference of 0.12%), Immigrants from Brazil (52.8%, a difference of 0.18%), Mongolian (52.8%, a difference of 0.18%), and Immigrants from Sudan (52.8%, a difference of 0.21%).
| Demographics | Rating | Rank | 2 or more Vehicles in Household |
| Immigrants | Europe | 2.1 /100 | #240 | Tragic 53.2% |
| Immigrants | Sierra Leone | 2.1 /100 | #241 | Tragic 53.2% |
| Immigrants | Eastern Asia | 2.1 /100 | #242 | Tragic 53.2% |
| Ethiopians | 1.7 /100 | #243 | Tragic 53.1% |
| Indians (Asian) | 1.7 /100 | #244 | Tragic 53.1% |
| Immigrants | Ethiopia | 1.5 /100 | #245 | Tragic 53.0% |
| Immigrants | Nigeria | 1.2 /100 | #246 | Tragic 52.9% |
| Sierra Leoneans | 1.2 /100 | #247 | Tragic 52.9% |
| Colombians | 1.1 /100 | #248 | Tragic 52.9% |
| Immigrants | Brazil | 1.0 /100 | #249 | Tragic 52.8% |
| Mongolians | 1.0 /100 | #250 | Tragic 52.8% |
| Immigrants | Sudan | 1.0 /100 | #251 | Tragic 52.8% |
| Immigrants | Portugal | 1.0 /100 | #252 | Tragic 52.8% |
| Nigerians | 0.9 /100 | #253 | Tragic 52.8% |
| Immigrants | Malaysia | 0.8 /100 | #254 | Tragic 52.7% |