Immigrants from Iran vs South American Indian 2 or more Vehicles in Household
COMPARE
Immigrants from Iran
South American Indian
2 or more Vehicles in Household
2 or more Vehicles in Household Comparison
Immigrants from Iran
South American Indians
57.9%
2 OR MORE VEHICLES IN HOUSEHOLD
99.1/ 100
METRIC RATING
88th/ 347
METRIC RANK
53.9%
2 OR MORE VEHICLES IN HOUSEHOLD
6.5/ 100
METRIC RATING
219th/ 347
METRIC RANK
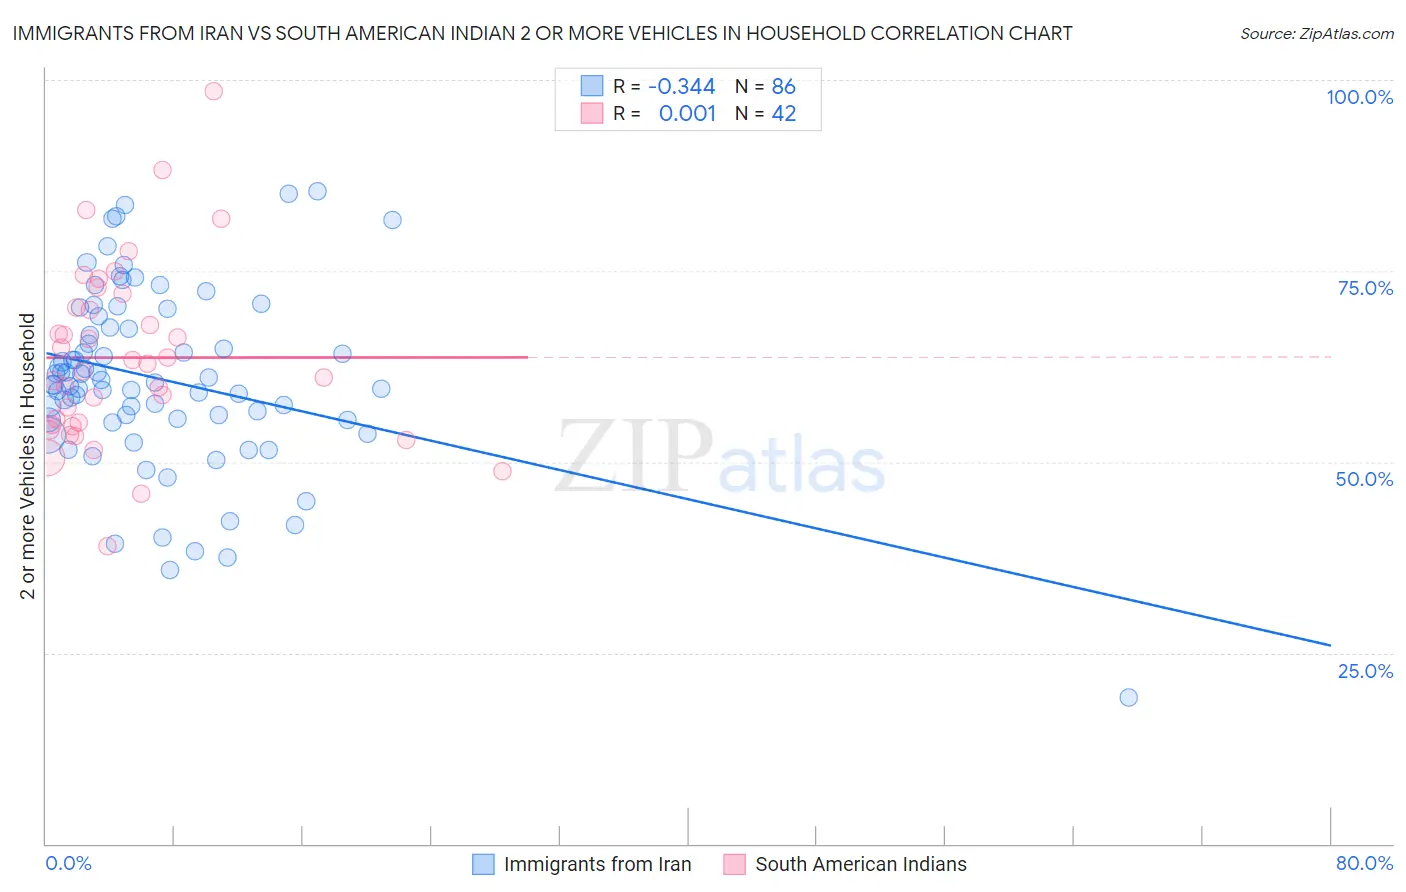
Immigrants from Iran vs South American Indian 2 or more Vehicles in Household Correlation Chart
The statistical analysis conducted on geographies consisting of 279,850,243 people shows a mild negative correlation between the proportion of Immigrants from Iran and percentage of households with 2 or more vehicles available in the United States with a correlation coefficient (R) of -0.344 and weighted average of 57.9%. Similarly, the statistical analysis conducted on geographies consisting of 164,540,449 people shows no correlation between the proportion of South American Indians and percentage of households with 2 or more vehicles available in the United States with a correlation coefficient (R) of 0.001 and weighted average of 53.9%, a difference of 7.5%.
2 or more Vehicles in Household Correlation Summary
| Measurement | Immigrants from Iran | South American Indian |
| Minimum | 19.2% | 38.9% |
| Maximum | 85.4% | 98.5% |
| Range | 66.2% | 59.6% |
| Mean | 60.8% | 63.7% |
| Median | 60.2% | 62.4% |
| Interquartile 25% (IQ1) | 55.5% | 54.8% |
| Interquartile 75% (IQ3) | 67.5% | 70.2% |
| Interquartile Range (IQR) | 12.0% | 15.4% |
| Standard Deviation (Sample) | 11.9% | 11.8% |
| Standard Deviation (Population) | 11.8% | 11.6% |
Similar Demographics by 2 or more Vehicles in Household
Demographics Similar to Immigrants from Iran by 2 or more Vehicles in Household
In terms of 2 or more vehicles in household, the demographic groups most similar to Immigrants from Iran are Thai (57.9%, a difference of 0.010%), Potawatomi (58.0%, a difference of 0.050%), Immigrants from Germany (57.9%, a difference of 0.070%), Hispanic or Latino (57.9%, a difference of 0.070%), and Slovak (58.0%, a difference of 0.080%).
| Demographics | Rating | Rank | 2 or more Vehicles in Household |
| Immigrants | Iraq | 99.3 /100 | #81 | Exceptional 58.1% |
| Iranians | 99.3 /100 | #82 | Exceptional 58.1% |
| Icelanders | 99.2 /100 | #83 | Exceptional 58.0% |
| Maltese | 99.2 /100 | #84 | Exceptional 58.0% |
| Slovaks | 99.2 /100 | #85 | Exceptional 58.0% |
| Potawatomi | 99.1 /100 | #86 | Exceptional 58.0% |
| Thais | 99.1 /100 | #87 | Exceptional 57.9% |
| Immigrants | Iran | 99.1 /100 | #88 | Exceptional 57.9% |
| Immigrants | Germany | 99.0 /100 | #89 | Exceptional 57.9% |
| Hispanics or Latinos | 99.0 /100 | #90 | Exceptional 57.9% |
| Pakistanis | 99.0 /100 | #91 | Exceptional 57.9% |
| Shoshone | 99.0 /100 | #92 | Exceptional 57.9% |
| Ottawa | 99.0 /100 | #93 | Exceptional 57.9% |
| Filipinos | 98.9 /100 | #94 | Exceptional 57.8% |
| Hmong | 98.9 /100 | #95 | Exceptional 57.8% |
Demographics Similar to South American Indians by 2 or more Vehicles in Household
In terms of 2 or more vehicles in household, the demographic groups most similar to South American Indians are Taiwanese (53.9%, a difference of 0.020%), Immigrants from Singapore (53.9%, a difference of 0.040%), Kiowa (53.9%, a difference of 0.050%), Immigrants from Argentina (53.9%, a difference of 0.060%), and Immigrants from Burma/Myanmar (53.9%, a difference of 0.11%).
| Demographics | Rating | Rank | 2 or more Vehicles in Household |
| Immigrants | Chile | 11.1 /100 | #212 | Poor 54.2% |
| Guatemalans | 9.6 /100 | #213 | Tragic 54.1% |
| Immigrants | Czechoslovakia | 9.4 /100 | #214 | Tragic 54.1% |
| Aleuts | 9.3 /100 | #215 | Tragic 54.1% |
| Immigrants | Western Asia | 9.3 /100 | #216 | Tragic 54.1% |
| Immigrants | Burma/Myanmar | 7.1 /100 | #217 | Tragic 53.9% |
| Immigrants | Argentina | 6.8 /100 | #218 | Tragic 53.9% |
| South American Indians | 6.5 /100 | #219 | Tragic 53.9% |
| Taiwanese | 6.3 /100 | #220 | Tragic 53.9% |
| Immigrants | Singapore | 6.3 /100 | #221 | Tragic 53.9% |
| Kiowa | 6.2 /100 | #222 | Tragic 53.9% |
| Immigrants | Bosnia and Herzegovina | 5.5 /100 | #223 | Tragic 53.8% |
| Brazilians | 5.3 /100 | #224 | Tragic 53.8% |
| Immigrants | Egypt | 5.2 /100 | #225 | Tragic 53.8% |
| Immigrants | Eastern Africa | 5.1 /100 | #226 | Tragic 53.7% |