Immigrants from Iran vs South African 2 or more Vehicles in Household
COMPARE
Immigrants from Iran
South African
2 or more Vehicles in Household
2 or more Vehicles in Household Comparison
Immigrants from Iran
South Africans
57.9%
2 OR MORE VEHICLES IN HOUSEHOLD
99.1/ 100
METRIC RATING
88th/ 347
METRIC RANK
56.2%
2 OR MORE VEHICLES IN HOUSEHOLD
83.1/ 100
METRIC RATING
142nd/ 347
METRIC RANK
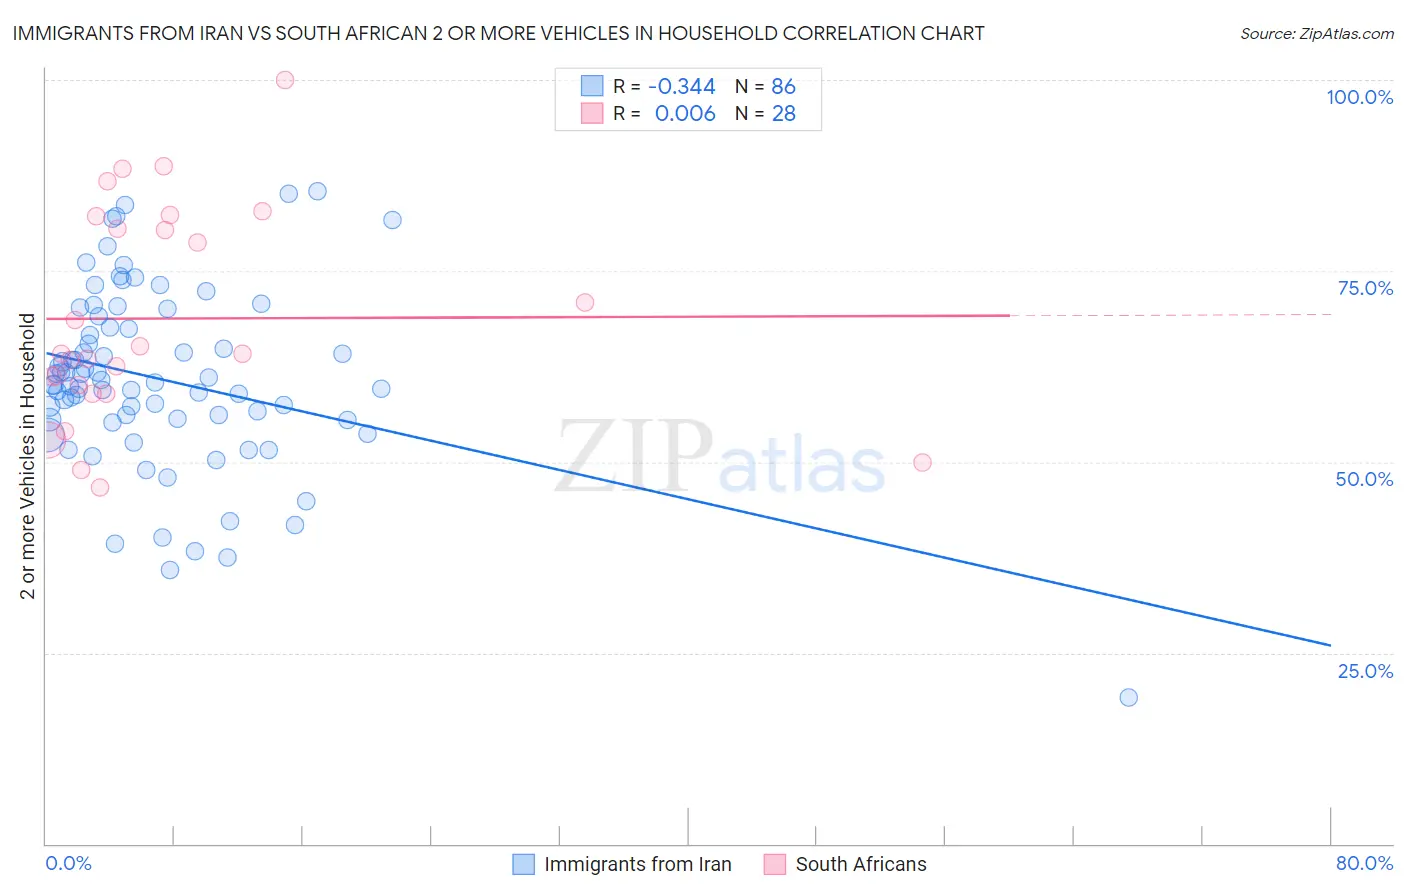
Immigrants from Iran vs South African 2 or more Vehicles in Household Correlation Chart
The statistical analysis conducted on geographies consisting of 279,850,243 people shows a mild negative correlation between the proportion of Immigrants from Iran and percentage of households with 2 or more vehicles available in the United States with a correlation coefficient (R) of -0.344 and weighted average of 57.9%. Similarly, the statistical analysis conducted on geographies consisting of 182,559,953 people shows no correlation between the proportion of South Africans and percentage of households with 2 or more vehicles available in the United States with a correlation coefficient (R) of 0.006 and weighted average of 56.2%, a difference of 3.0%.
2 or more Vehicles in Household Correlation Summary
| Measurement | Immigrants from Iran | South African |
| Minimum | 19.2% | 46.6% |
| Maximum | 85.4% | 100.0% |
| Range | 66.2% | 53.4% |
| Mean | 60.8% | 68.8% |
| Median | 60.2% | 64.2% |
| Interquartile 25% (IQ1) | 55.5% | 59.5% |
| Interquartile 75% (IQ3) | 67.5% | 81.4% |
| Interquartile Range (IQR) | 12.0% | 21.9% |
| Standard Deviation (Sample) | 11.9% | 14.0% |
| Standard Deviation (Population) | 11.8% | 13.7% |
Similar Demographics by 2 or more Vehicles in Household
Demographics Similar to Immigrants from Iran by 2 or more Vehicles in Household
In terms of 2 or more vehicles in household, the demographic groups most similar to Immigrants from Iran are Thai (57.9%, a difference of 0.010%), Potawatomi (58.0%, a difference of 0.050%), Immigrants from Germany (57.9%, a difference of 0.070%), Hispanic or Latino (57.9%, a difference of 0.070%), and Slovak (58.0%, a difference of 0.080%).
| Demographics | Rating | Rank | 2 or more Vehicles in Household |
| Immigrants | Iraq | 99.3 /100 | #81 | Exceptional 58.1% |
| Iranians | 99.3 /100 | #82 | Exceptional 58.1% |
| Icelanders | 99.2 /100 | #83 | Exceptional 58.0% |
| Maltese | 99.2 /100 | #84 | Exceptional 58.0% |
| Slovaks | 99.2 /100 | #85 | Exceptional 58.0% |
| Potawatomi | 99.1 /100 | #86 | Exceptional 58.0% |
| Thais | 99.1 /100 | #87 | Exceptional 57.9% |
| Immigrants | Iran | 99.1 /100 | #88 | Exceptional 57.9% |
| Immigrants | Germany | 99.0 /100 | #89 | Exceptional 57.9% |
| Hispanics or Latinos | 99.0 /100 | #90 | Exceptional 57.9% |
| Pakistanis | 99.0 /100 | #91 | Exceptional 57.9% |
| Shoshone | 99.0 /100 | #92 | Exceptional 57.9% |
| Ottawa | 99.0 /100 | #93 | Exceptional 57.9% |
| Filipinos | 98.9 /100 | #94 | Exceptional 57.8% |
| Hmong | 98.9 /100 | #95 | Exceptional 57.8% |
Demographics Similar to South Africans by 2 or more Vehicles in Household
In terms of 2 or more vehicles in household, the demographic groups most similar to South Africans are Latvian (56.2%, a difference of 0.040%), Immigrants from Cambodia (56.2%, a difference of 0.040%), Armenian (56.3%, a difference of 0.090%), Seminole (56.2%, a difference of 0.090%), and Immigrants from Syria (56.2%, a difference of 0.11%).
| Demographics | Rating | Rank | 2 or more Vehicles in Household |
| Blackfeet | 86.5 /100 | #135 | Excellent 56.4% |
| Immigrants | Asia | 86.0 /100 | #136 | Excellent 56.3% |
| Cubans | 84.8 /100 | #137 | Excellent 56.3% |
| Salvadorans | 84.7 /100 | #138 | Excellent 56.3% |
| Armenians | 84.3 /100 | #139 | Excellent 56.3% |
| Latvians | 83.6 /100 | #140 | Excellent 56.2% |
| Immigrants | Cambodia | 83.6 /100 | #141 | Excellent 56.2% |
| South Africans | 83.1 /100 | #142 | Excellent 56.2% |
| Seminole | 81.7 /100 | #143 | Excellent 56.2% |
| Immigrants | Syria | 81.4 /100 | #144 | Excellent 56.2% |
| Syrians | 81.2 /100 | #145 | Excellent 56.2% |
| Venezuelans | 80.7 /100 | #146 | Excellent 56.1% |
| Serbians | 80.3 /100 | #147 | Excellent 56.1% |
| Immigrants | Moldova | 80.2 /100 | #148 | Excellent 56.1% |
| Chileans | 80.2 /100 | #149 | Excellent 56.1% |