Greek vs Immigrants from Bulgaria 2 or more Vehicles in Household
COMPARE
Greek
Immigrants from Bulgaria
2 or more Vehicles in Household
2 or more Vehicles in Household Comparison
Greeks
Immigrants from Bulgaria
57.5%
2 OR MORE VEHICLES IN HOUSEHOLD
98.0/ 100
METRIC RATING
111th/ 347
METRIC RANK
54.3%
2 OR MORE VEHICLES IN HOUSEHOLD
12.0/ 100
METRIC RATING
209th/ 347
METRIC RANK
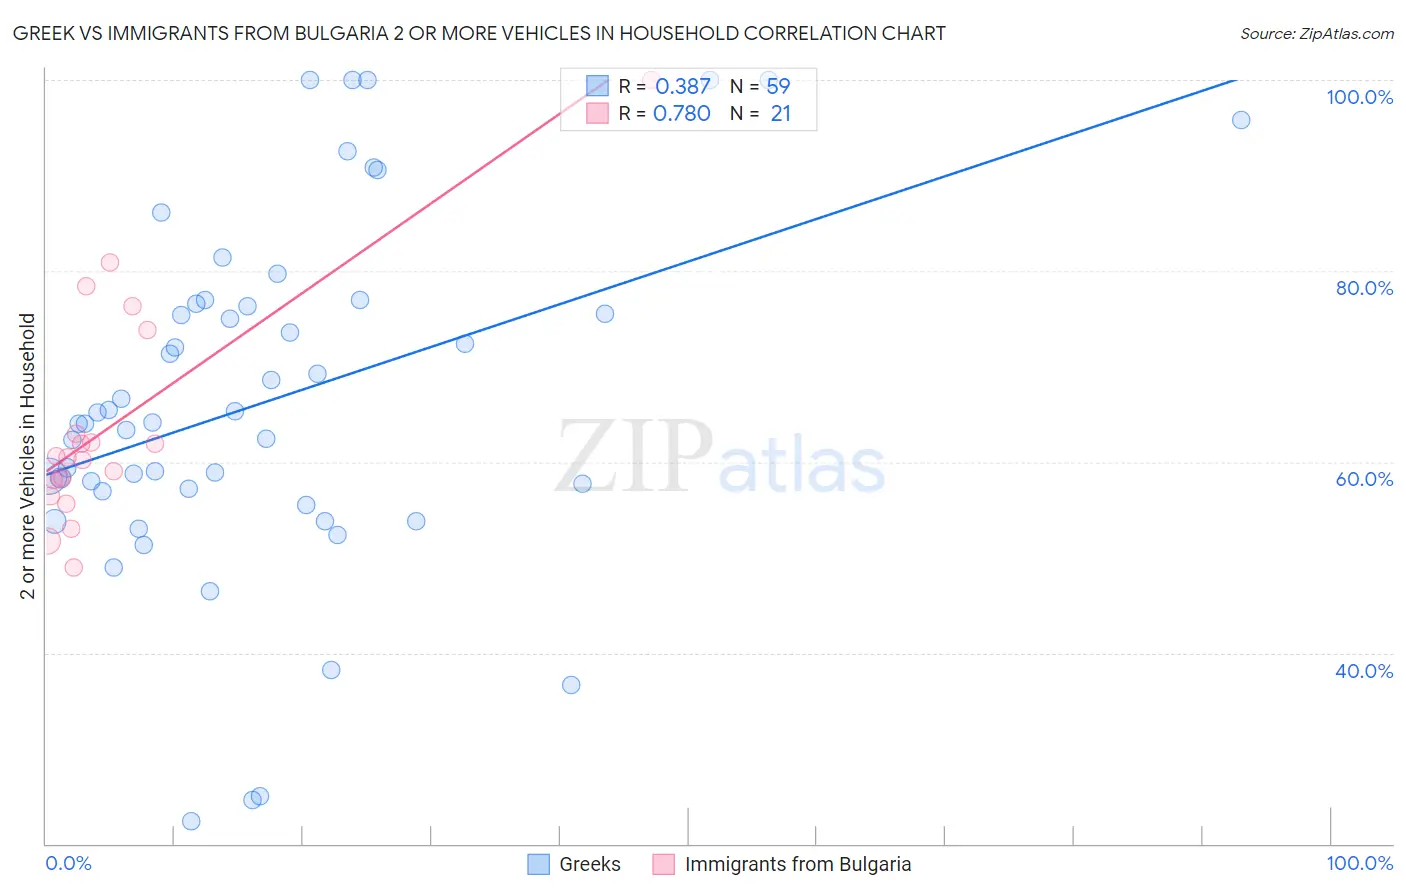
Greek vs Immigrants from Bulgaria 2 or more Vehicles in Household Correlation Chart
The statistical analysis conducted on geographies consisting of 482,397,984 people shows a mild positive correlation between the proportion of Greeks and percentage of households with 2 or more vehicles available in the United States with a correlation coefficient (R) of 0.387 and weighted average of 57.5%. Similarly, the statistical analysis conducted on geographies consisting of 172,541,029 people shows a strong positive correlation between the proportion of Immigrants from Bulgaria and percentage of households with 2 or more vehicles available in the United States with a correlation coefficient (R) of 0.780 and weighted average of 54.3%, a difference of 6.0%.
2 or more Vehicles in Household Correlation Summary
| Measurement | Greek | Immigrants from Bulgaria |
| Minimum | 22.4% | 49.0% |
| Maximum | 100.0% | 100.0% |
| Range | 77.6% | 51.0% |
| Mean | 66.4% | 63.7% |
| Median | 64.1% | 60.5% |
| Interquartile 25% (IQ1) | 56.9% | 57.2% |
| Interquartile 75% (IQ3) | 76.6% | 68.3% |
| Interquartile Range (IQR) | 19.7% | 11.1% |
| Standard Deviation (Sample) | 18.4% | 11.9% |
| Standard Deviation (Population) | 18.3% | 11.6% |
Similar Demographics by 2 or more Vehicles in Household
Demographics Similar to Greeks by 2 or more Vehicles in Household
In terms of 2 or more vehicles in household, the demographic groups most similar to Greeks are Pueblo (57.5%, a difference of 0.0%), Japanese (57.5%, a difference of 0.030%), Immigrants from North America (57.5%, a difference of 0.050%), Immigrants from Canada (57.5%, a difference of 0.080%), and Immigrants from Netherlands (57.5%, a difference of 0.10%).
| Demographics | Rating | Rank | 2 or more Vehicles in Household |
| Immigrants | Indonesia | 98.2 /100 | #104 | Exceptional 57.6% |
| Immigrants | Korea | 98.2 /100 | #105 | Exceptional 57.6% |
| Immigrants | Oceania | 98.2 /100 | #106 | Exceptional 57.5% |
| Immigrants | Netherlands | 98.2 /100 | #107 | Exceptional 57.5% |
| Immigrants | Canada | 98.1 /100 | #108 | Exceptional 57.5% |
| Immigrants | North America | 98.1 /100 | #109 | Exceptional 57.5% |
| Japanese | 98.0 /100 | #110 | Exceptional 57.5% |
| Greeks | 98.0 /100 | #111 | Exceptional 57.5% |
| Pueblo | 98.0 /100 | #112 | Exceptional 57.5% |
| Zimbabweans | 96.9 /100 | #113 | Exceptional 57.2% |
| Immigrants | Lebanon | 96.8 /100 | #114 | Exceptional 57.2% |
| Chippewa | 96.6 /100 | #115 | Exceptional 57.2% |
| Immigrants | Jordan | 96.6 /100 | #116 | Exceptional 57.2% |
| Iraqis | 95.8 /100 | #117 | Exceptional 57.1% |
| Asians | 95.1 /100 | #118 | Exceptional 57.0% |
Demographics Similar to Immigrants from Bulgaria by 2 or more Vehicles in Household
In terms of 2 or more vehicles in household, the demographic groups most similar to Immigrants from Bulgaria are Egyptian (54.3%, a difference of 0.0%), Immigrants from Saudi Arabia (54.2%, a difference of 0.060%), Immigrants from Hungary (54.2%, a difference of 0.070%), Turkish (54.3%, a difference of 0.090%), and Immigrants from Chile (54.2%, a difference of 0.090%).
| Demographics | Rating | Rank | 2 or more Vehicles in Household |
| Immigrants | North Macedonia | 14.9 /100 | #202 | Poor 54.4% |
| Immigrants | Peru | 14.3 /100 | #203 | Poor 54.4% |
| Immigrants | Belgium | 13.7 /100 | #204 | Poor 54.3% |
| Cheyenne | 13.6 /100 | #205 | Poor 54.3% |
| Immigrants | Latin America | 13.1 /100 | #206 | Poor 54.3% |
| Turks | 13.0 /100 | #207 | Poor 54.3% |
| Egyptians | 12.0 /100 | #208 | Poor 54.3% |
| Immigrants | Bulgaria | 12.0 /100 | #209 | Poor 54.3% |
| Immigrants | Saudi Arabia | 11.3 /100 | #210 | Poor 54.2% |
| Immigrants | Hungary | 11.3 /100 | #211 | Poor 54.2% |
| Immigrants | Chile | 11.1 /100 | #212 | Poor 54.2% |
| Guatemalans | 9.6 /100 | #213 | Tragic 54.1% |
| Immigrants | Czechoslovakia | 9.4 /100 | #214 | Tragic 54.1% |
| Aleuts | 9.3 /100 | #215 | Tragic 54.1% |
| Immigrants | Western Asia | 9.3 /100 | #216 | Tragic 54.1% |