Greek vs Swiss 2 or more Vehicles in Household
COMPARE
Greek
Swiss
2 or more Vehicles in Household
2 or more Vehicles in Household Comparison
Greeks
Swiss
57.5%
2 OR MORE VEHICLES IN HOUSEHOLD
98.0/ 100
METRIC RATING
111th/ 347
METRIC RANK
61.0%
2 OR MORE VEHICLES IN HOUSEHOLD
100.0/ 100
METRIC RATING
22nd/ 347
METRIC RANK
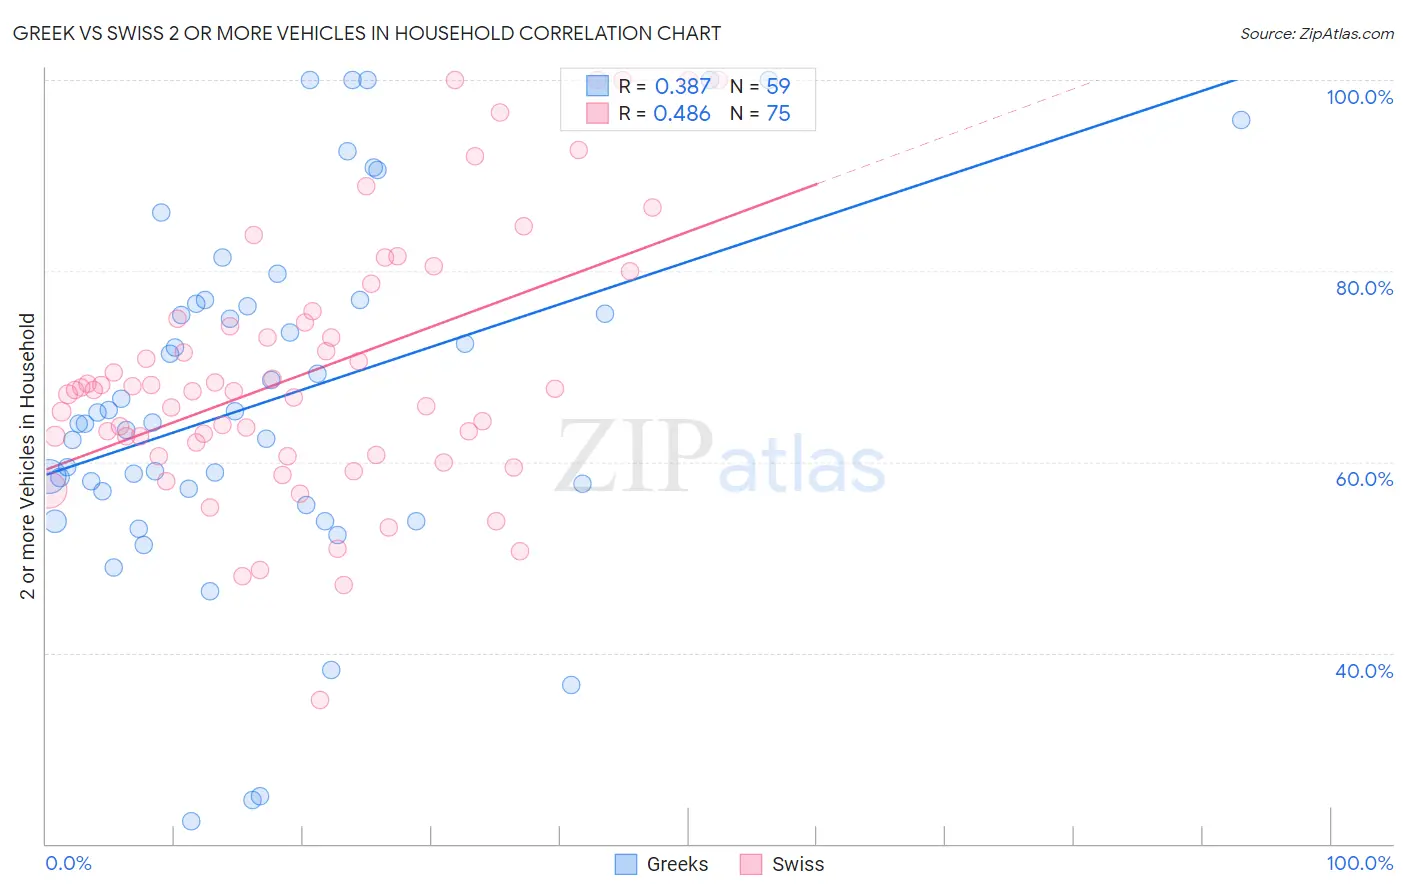
Greek vs Swiss 2 or more Vehicles in Household Correlation Chart
The statistical analysis conducted on geographies consisting of 482,397,984 people shows a mild positive correlation between the proportion of Greeks and percentage of households with 2 or more vehicles available in the United States with a correlation coefficient (R) of 0.387 and weighted average of 57.5%. Similarly, the statistical analysis conducted on geographies consisting of 464,799,641 people shows a moderate positive correlation between the proportion of Swiss and percentage of households with 2 or more vehicles available in the United States with a correlation coefficient (R) of 0.486 and weighted average of 61.0%, a difference of 6.1%.
2 or more Vehicles in Household Correlation Summary
| Measurement | Greek | Swiss |
| Minimum | 22.4% | 35.0% |
| Maximum | 100.0% | 100.0% |
| Range | 77.6% | 65.0% |
| Mean | 66.4% | 69.3% |
| Median | 64.1% | 67.5% |
| Interquartile 25% (IQ1) | 56.9% | 60.8% |
| Interquartile 75% (IQ3) | 76.6% | 75.0% |
| Interquartile Range (IQR) | 19.7% | 14.2% |
| Standard Deviation (Sample) | 18.4% | 13.7% |
| Standard Deviation (Population) | 18.3% | 13.6% |
Similar Demographics by 2 or more Vehicles in Household
Demographics Similar to Greeks by 2 or more Vehicles in Household
In terms of 2 or more vehicles in household, the demographic groups most similar to Greeks are Pueblo (57.5%, a difference of 0.0%), Japanese (57.5%, a difference of 0.030%), Immigrants from North America (57.5%, a difference of 0.050%), Immigrants from Canada (57.5%, a difference of 0.080%), and Immigrants from Netherlands (57.5%, a difference of 0.10%).
| Demographics | Rating | Rank | 2 or more Vehicles in Household |
| Immigrants | Indonesia | 98.2 /100 | #104 | Exceptional 57.6% |
| Immigrants | Korea | 98.2 /100 | #105 | Exceptional 57.6% |
| Immigrants | Oceania | 98.2 /100 | #106 | Exceptional 57.5% |
| Immigrants | Netherlands | 98.2 /100 | #107 | Exceptional 57.5% |
| Immigrants | Canada | 98.1 /100 | #108 | Exceptional 57.5% |
| Immigrants | North America | 98.1 /100 | #109 | Exceptional 57.5% |
| Japanese | 98.0 /100 | #110 | Exceptional 57.5% |
| Greeks | 98.0 /100 | #111 | Exceptional 57.5% |
| Pueblo | 98.0 /100 | #112 | Exceptional 57.5% |
| Zimbabweans | 96.9 /100 | #113 | Exceptional 57.2% |
| Immigrants | Lebanon | 96.8 /100 | #114 | Exceptional 57.2% |
| Chippewa | 96.6 /100 | #115 | Exceptional 57.2% |
| Immigrants | Jordan | 96.6 /100 | #116 | Exceptional 57.2% |
| Iraqis | 95.8 /100 | #117 | Exceptional 57.1% |
| Asians | 95.1 /100 | #118 | Exceptional 57.0% |
Demographics Similar to Swiss by 2 or more Vehicles in Household
In terms of 2 or more vehicles in household, the demographic groups most similar to Swiss are Korean (61.0%, a difference of 0.040%), Scotch-Irish (60.9%, a difference of 0.040%), Immigrants from Vietnam (60.9%, a difference of 0.070%), Sri Lankan (61.0%, a difference of 0.080%), and White/Caucasian (60.8%, a difference of 0.23%).
| Demographics | Rating | Rank | 2 or more Vehicles in Household |
| Nepalese | 100.0 /100 | #15 | Exceptional 61.4% |
| Native Hawaiians | 100.0 /100 | #16 | Exceptional 61.4% |
| Basques | 100.0 /100 | #17 | Exceptional 61.4% |
| Europeans | 100.0 /100 | #18 | Exceptional 61.4% |
| Scottish | 100.0 /100 | #19 | Exceptional 61.2% |
| Sri Lankans | 100.0 /100 | #20 | Exceptional 61.0% |
| Koreans | 100.0 /100 | #21 | Exceptional 61.0% |
| Swiss | 100.0 /100 | #22 | Exceptional 61.0% |
| Scotch-Irish | 100.0 /100 | #23 | Exceptional 60.9% |
| Immigrants | Vietnam | 100.0 /100 | #24 | Exceptional 60.9% |
| Whites/Caucasians | 100.0 /100 | #25 | Exceptional 60.8% |
| Welsh | 100.0 /100 | #26 | Exceptional 60.8% |
| Assyrians/Chaldeans/Syriacs | 100.0 /100 | #27 | Exceptional 60.5% |
| Guamanians/Chamorros | 100.0 /100 | #28 | Exceptional 60.5% |
| Hawaiians | 100.0 /100 | #29 | Exceptional 60.4% |