Assyrian/Chaldean/Syriac vs Slovak 4 or more Vehicles in Household
COMPARE
Assyrian/Chaldean/Syriac
Slovak
4 or more Vehicles in Household
4 or more Vehicles in Household Comparison
Assyrians/Chaldeans/Syriacs
Slovaks
7.2%
4 OR MORE VEHICLES IN HOUSEHOLD
99.4/ 100
METRIC RATING
91st/ 347
METRIC RANK
6.3%
4 OR MORE VEHICLES IN HOUSEHOLD
46.9/ 100
METRIC RATING
177th/ 347
METRIC RANK
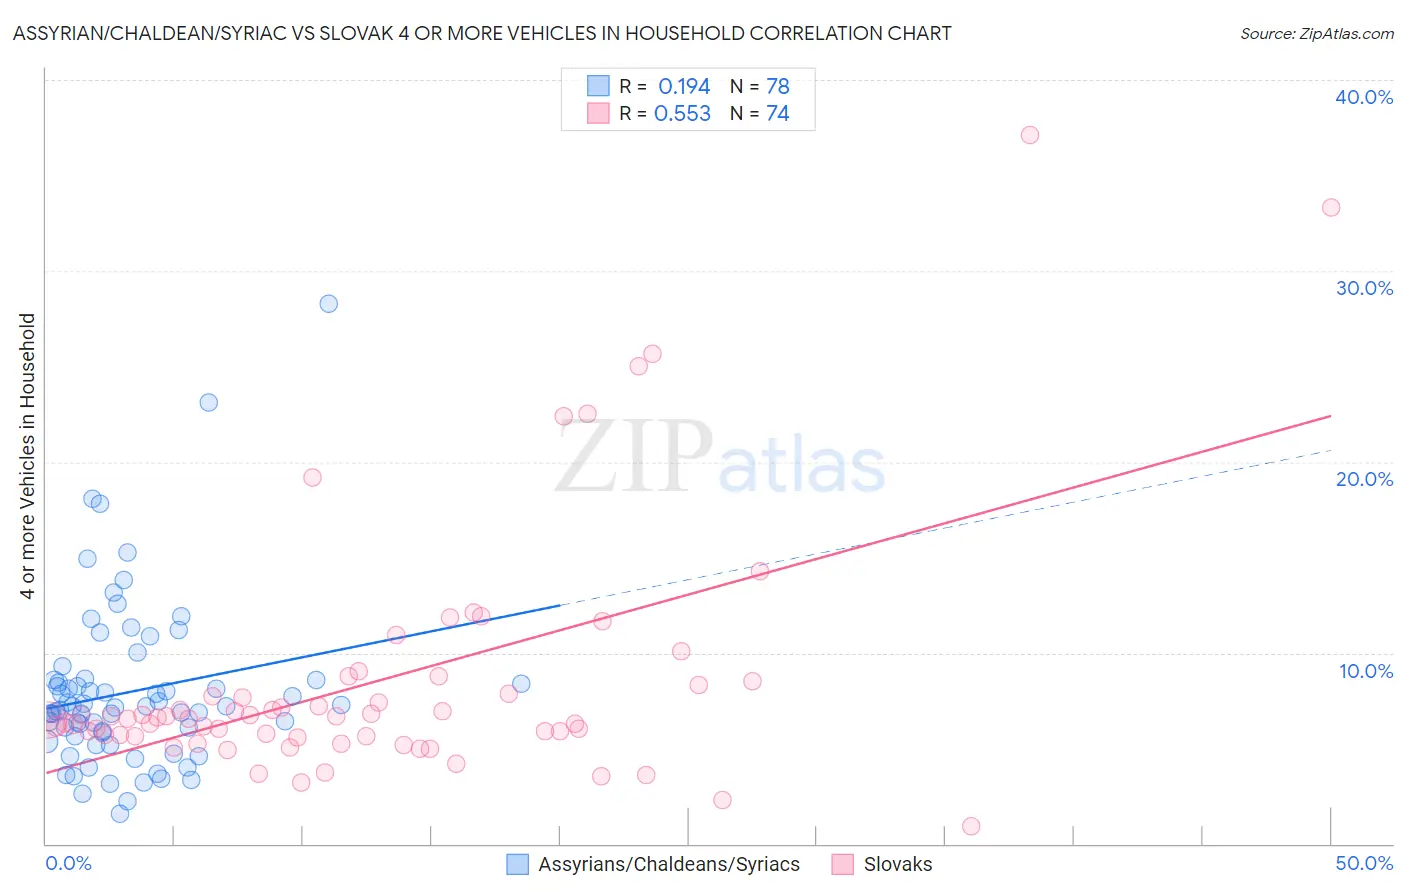
Assyrian/Chaldean/Syriac vs Slovak 4 or more Vehicles in Household Correlation Chart
The statistical analysis conducted on geographies consisting of 110,163,446 people shows a poor positive correlation between the proportion of Assyrians/Chaldeans/Syriacs and percentage of households with 4 or more vehicles available in the United States with a correlation coefficient (R) of 0.194 and weighted average of 7.2%. Similarly, the statistical analysis conducted on geographies consisting of 396,389,671 people shows a substantial positive correlation between the proportion of Slovaks and percentage of households with 4 or more vehicles available in the United States with a correlation coefficient (R) of 0.553 and weighted average of 6.3%, a difference of 13.4%.
4 or more Vehicles in Household Correlation Summary
| Measurement | Assyrian/Chaldean/Syriac | Slovak |
| Minimum | 1.6% | 0.89% |
| Maximum | 28.3% | 37.1% |
| Range | 26.7% | 36.2% |
| Mean | 8.0% | 8.5% |
| Median | 7.1% | 6.6% |
| Interquartile 25% (IQ1) | 5.6% | 5.6% |
| Interquartile 75% (IQ3) | 8.6% | 8.3% |
| Interquartile Range (IQR) | 2.9% | 2.7% |
| Standard Deviation (Sample) | 4.4% | 6.5% |
| Standard Deviation (Population) | 4.4% | 6.5% |
Similar Demographics by 4 or more Vehicles in Household
Demographics Similar to Assyrians/Chaldeans/Syriacs by 4 or more Vehicles in Household
In terms of 4 or more vehicles in household, the demographic groups most similar to Assyrians/Chaldeans/Syriacs are Immigrants from Latin America (7.1%, a difference of 0.16%), Immigrants from Afghanistan (7.1%, a difference of 0.33%), Dutch West Indian (7.1%, a difference of 0.34%), Czechoslovakian (7.1%, a difference of 0.55%), and Creek (7.2%, a difference of 0.56%).
| Demographics | Rating | Rank | 4 or more Vehicles in Household |
| Afghans | 99.7 /100 | #84 | Exceptional 7.3% |
| Cree | 99.7 /100 | #85 | Exceptional 7.2% |
| Immigrants | Indonesia | 99.6 /100 | #86 | Exceptional 7.2% |
| Delaware | 99.6 /100 | #87 | Exceptional 7.2% |
| Immigrants | Nonimmigrants | 99.6 /100 | #88 | Exceptional 7.2% |
| British | 99.6 /100 | #89 | Exceptional 7.2% |
| Creek | 99.6 /100 | #90 | Exceptional 7.2% |
| Assyrians/Chaldeans/Syriacs | 99.4 /100 | #91 | Exceptional 7.2% |
| Immigrants | Latin America | 99.4 /100 | #92 | Exceptional 7.1% |
| Immigrants | Afghanistan | 99.3 /100 | #93 | Exceptional 7.1% |
| Dutch West Indians | 99.3 /100 | #94 | Exceptional 7.1% |
| Czechoslovakians | 99.3 /100 | #95 | Exceptional 7.1% |
| Central Americans | 99.3 /100 | #96 | Exceptional 7.1% |
| Celtics | 99.1 /100 | #97 | Exceptional 7.1% |
| Irish | 99.0 /100 | #98 | Exceptional 7.1% |
Demographics Similar to Slovaks by 4 or more Vehicles in Household
In terms of 4 or more vehicles in household, the demographic groups most similar to Slovaks are Ukrainian (6.3%, a difference of 0.070%), Immigrants from Western Europe (6.3%, a difference of 0.20%), Belizean (6.3%, a difference of 0.24%), Lithuanian (6.3%, a difference of 0.32%), and Immigrants from Japan (6.3%, a difference of 0.39%).
| Demographics | Rating | Rank | 4 or more Vehicles in Household |
| Immigrants | Syria | 52.8 /100 | #170 | Average 6.3% |
| Immigrants | India | 51.9 /100 | #171 | Average 6.3% |
| Immigrants | Lebanon | 51.7 /100 | #172 | Average 6.3% |
| Slovenes | 51.1 /100 | #173 | Average 6.3% |
| Lithuanians | 50.0 /100 | #174 | Average 6.3% |
| Immigrants | Western Europe | 48.8 /100 | #175 | Average 6.3% |
| Ukrainians | 47.6 /100 | #176 | Average 6.3% |
| Slovaks | 46.9 /100 | #177 | Average 6.3% |
| Belizeans | 44.5 /100 | #178 | Average 6.3% |
| Immigrants | Japan | 43.1 /100 | #179 | Average 6.3% |
| Syrians | 42.0 /100 | #180 | Average 6.3% |
| Yugoslavians | 41.1 /100 | #181 | Average 6.3% |
| South American Indians | 40.7 /100 | #182 | Average 6.3% |
| Immigrants | Burma/Myanmar | 37.5 /100 | #183 | Fair 6.2% |
| Iraqis | 37.3 /100 | #184 | Fair 6.2% |