Zip Codes with the Highest Percentage of Self-Employed / Incorporated in Texas
RELATED REPORTS & OPTIONS
Self-Employed / Incorporated
Texas
Compare Zip Codes
Map of Zip Codes with the Highest Percentage of Self-Employed / Incorporated in Texas
0.0%
100.0%
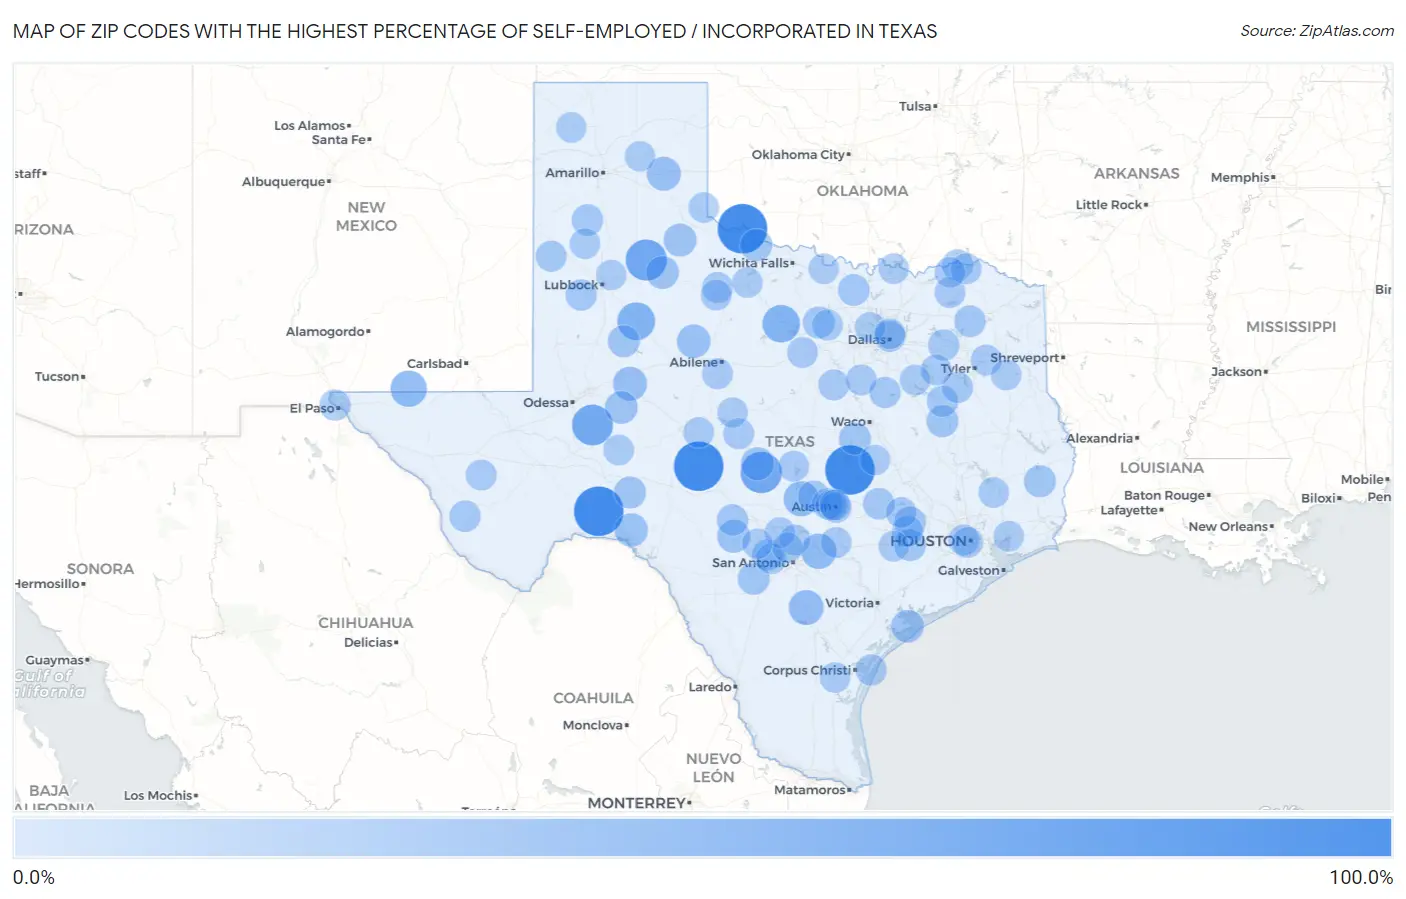
Zip Codes with the Highest Percentage of Self-Employed / Incorporated in Texas
| Zip Code | % Self-Employed / Incorporated | vs State | vs National | |
| 1. | 76841 | 100.0% | 3.4% (+96.6)#1 | 3.8% (+96.2)#2 |
| 2. | 78851 | 100.0% | 3.4% (+96.6)#2 | 3.8% (+96.2)#11 |
| 3. | 76573 | 100.0% | 3.4% (+96.6)#3 | 3.8% (+96.2)#19 |
| 4. | 79247 | 100.0% | 3.4% (+96.6)#4 | 3.8% (+96.2)#21 |
| 5. | 76820 | 60.9% | 3.4% (+57.6)#5 | 3.8% (+57.1)#51 |
| 6. | 79231 | 60.0% | 3.4% (+56.6)#6 | 3.8% (+56.2)#55 |
| 7. | 79755 | 57.9% | 3.4% (+54.5)#7 | 3.8% (+54.1)#60 |
| 8. | 79330 | 42.9% | 3.4% (+39.5)#8 | 3.8% (+39.0)#114 |
| 9. | 76481 | 42.3% | 3.4% (+39.0)#9 | 3.8% (+38.5)#116 |
| 10. | 79837 | 36.3% | 3.4% (+32.9)#10 | 3.8% (+32.5)#154 |
| 11. | 78123 | 31.7% | 3.4% (+28.3)#11 | 3.8% (+27.9)#194 |
| 12. | 78663 | 31.1% | 3.4% (+27.8)#12 | 3.8% (+27.3)#204 |
| 13. | 78008 | 29.9% | 3.4% (+26.5)#13 | 3.8% (+26.0)#218 |
| 14. | 79733 | 26.0% | 3.4% (+22.6)#14 | 3.8% (+22.1)#291 |
| 15. | 79002 | 25.8% | 3.4% (+22.4)#15 | 3.8% (+22.0)#294 |
| 16. | 79534 | 24.4% | 3.4% (+21.0)#16 | 3.8% (+20.6)#328 |
| 17. | 78837 | 22.6% | 3.4% (+19.2)#17 | 3.8% (+18.8)#393 |
| 18. | 76842 | 21.7% | 3.4% (+18.3)#18 | 3.8% (+17.8)#427 |
| 19. | 78885 | 21.4% | 3.4% (+18.1)#19 | 3.8% (+17.6)#433 |
| 20. | 79223 | 20.8% | 3.4% (+17.4)#20 | 3.8% (+16.9)#468 |
| 21. | 79220 | 20.2% | 3.4% (+16.8)#21 | 3.8% (+16.4)#498 |
| 22. | 77982 | 19.8% | 3.4% (+16.5)#22 | 3.8% (+16.0)#520 |
| 23. | 79739 | 19.6% | 3.4% (+16.3)#23 | 3.8% (+15.8)#522 |
| 24. | 76373 | 17.2% | 3.4% (+13.9)#24 | 3.8% (+13.4)#686 |
| 25. | 76557 | 17.2% | 3.4% (+13.8)#25 | 3.8% (+13.4)#690 |
| 26. | 78886 | 16.7% | 3.4% (+13.3)#26 | 3.8% (+12.8)#738 |
| 27. | 78931 | 16.7% | 3.4% (+13.3)#27 | 3.8% (+12.8)#740 |
| 28. | 77660 | 16.6% | 3.4% (+13.2)#28 | 3.8% (+12.8)#748 |
| 29. | 76943 | 16.6% | 3.4% (+13.2)#29 | 3.8% (+12.8)#750 |
| 30. | 79738 | 16.2% | 3.4% (+12.8)#30 | 3.8% (+12.4)#791 |
| 31. | 75855 | 16.0% | 3.4% (+12.6)#31 | 3.8% (+12.2)#823 |
| 32. | 78935 | 15.9% | 3.4% (+12.5)#32 | 3.8% (+12.0)#839 |
| 33. | 76486 | 15.4% | 3.4% (+12.0)#33 | 3.8% (+11.5)#903 |
| 34. | 76263 | 15.0% | 3.4% (+11.6)#34 | 3.8% (+11.2)#956 |
| 35. | 75471 | 14.6% | 3.4% (+11.3)#35 | 3.8% (+10.8)#1,021 |
| 36. | 78948 | 14.6% | 3.4% (+11.3)#36 | 3.8% (+10.8)#1,022 |
| 37. | 79063 | 14.3% | 3.4% (+11.0)#37 | 3.8% (+10.5)#1,062 |
| 38. | 78058 | 14.0% | 3.4% (+10.6)#38 | 3.8% (+10.1)#1,143 |
| 39. | 79843 | 13.8% | 3.4% (+10.4)#39 | 3.8% (+9.99)#1,173 |
| 40. | 78669 | 13.6% | 3.4% (+10.2)#40 | 3.8% (+9.79)#1,220 |
| 41. | 75861 | 13.5% | 3.4% (+10.1)#41 | 3.8% (+9.68)#1,233 |
| 42. | 79358 | 13.4% | 3.4% (+10.0)#42 | 3.8% (+9.58)#1,247 |
| 43. | 75117 | 13.0% | 3.4% (+9.66)#43 | 3.8% (+9.21)#1,318 |
| 44. | 75782 | 12.9% | 3.4% (+9.54)#44 | 3.8% (+9.09)#1,335 |
| 45. | 78056 | 12.8% | 3.4% (+9.46)#45 | 3.8% (+9.01)#1,347 |
| 46. | 78373 | 12.8% | 3.4% (+9.43)#46 | 3.8% (+8.98)#1,360 |
| 47. | 78950 | 12.8% | 3.4% (+9.40)#47 | 3.8% (+8.95)#1,364 |
| 48. | 76650 | 12.8% | 3.4% (+9.40)#48 | 3.8% (+8.95)#1,368 |
| 49. | 78733 | 12.7% | 3.4% (+9.29)#49 | 3.8% (+8.84)#1,401 |
| 50. | 79922 | 12.5% | 3.4% (+9.14)#50 | 3.8% (+8.69)#1,435 |
| 51. | 75411 | 12.2% | 3.4% (+8.80)#51 | 3.8% (+8.35)#1,529 |
| 52. | 75205 | 12.1% | 3.4% (+8.76)#52 | 3.8% (+8.32)#1,537 |
| 53. | 79371 | 12.1% | 3.4% (+8.70)#53 | 3.8% (+8.25)#1,548 |
| 54. | 78746 | 11.8% | 3.4% (+8.44)#54 | 3.8% (+7.99)#1,611 |
| 55. | 76487 | 11.8% | 3.4% (+8.43)#55 | 3.8% (+7.99)#1,612 |
| 56. | 79505 | 11.8% | 3.4% (+8.40)#56 | 3.8% (+7.95)#1,629 |
| 57. | 77024 | 11.6% | 3.4% (+8.24)#57 | 3.8% (+7.79)#1,690 |
| 58. | 76852 | 11.5% | 3.4% (+8.17)#58 | 3.8% (+7.72)#1,711 |
| 59. | 75124 | 11.5% | 3.4% (+8.13)#59 | 3.8% (+7.68)#1,719 |
| 60. | 76690 | 11.4% | 3.4% (+8.01)#60 | 3.8% (+7.56)#1,752 |
| 61. | 76453 | 11.2% | 3.4% (+7.80)#61 | 3.8% (+7.35)#1,815 |
| 62. | 79529 | 11.1% | 3.4% (+7.77)#62 | 3.8% (+7.32)#1,827 |
| 63. | 75415 | 11.1% | 3.4% (+7.74)#63 | 3.8% (+7.29)#1,841 |
| 64. | 79508 | 11.1% | 3.4% (+7.69)#64 | 3.8% (+7.24)#1,869 |
| 65. | 75792 | 11.0% | 3.4% (+7.68)#65 | 3.8% (+7.23)#1,872 |
| 66. | 78701 | 11.0% | 3.4% (+7.58)#66 | 3.8% (+7.13)#1,916 |
| 67. | 75473 | 10.9% | 3.4% (+7.57)#67 | 3.8% (+7.12)#1,919 |
| 68. | 79734 | 10.9% | 3.4% (+7.55)#68 | 3.8% (+7.11)#1,925 |
| 69. | 78661 | 10.9% | 3.4% (+7.55)#69 | 3.8% (+7.10)#1,927 |
| 70. | 77005 | 10.9% | 3.4% (+7.52)#70 | 3.8% (+7.07)#1,938 |
| 71. | 76636 | 10.8% | 3.4% (+7.39)#71 | 3.8% (+6.95)#1,989 |
| 72. | 78703 | 10.7% | 3.4% (+7.33)#72 | 3.8% (+6.88)#2,016 |
| 73. | 78672 | 10.7% | 3.4% (+7.32)#73 | 3.8% (+6.87)#2,024 |
| 74. | 78066 | 10.6% | 3.4% (+7.25)#74 | 3.8% (+6.80)#2,058 |
| 75. | 78163 | 10.5% | 3.4% (+7.17)#75 | 3.8% (+6.72)#2,086 |
| 76. | 76937 | 10.5% | 3.4% (+7.16)#76 | 3.8% (+6.71)#2,094 |
| 77. | 78006 | 10.3% | 3.4% (+6.98)#77 | 3.8% (+6.53)#2,154 |
| 78. | 76932 | 10.3% | 3.4% (+6.98)#78 | 3.8% (+6.53)#2,155 |
| 79. | 75652 | 10.3% | 3.4% (+6.93)#79 | 3.8% (+6.48)#2,172 |
| 80. | 77835 | 10.3% | 3.4% (+6.91)#80 | 3.8% (+6.46)#2,181 |
| 81. | 75486 | 10.2% | 3.4% (+6.86)#81 | 3.8% (+6.41)#2,212 |
| 82. | 77371 | 10.1% | 3.4% (+6.71)#82 | 3.8% (+6.26)#2,278 |
| 83. | 75153 | 10.0% | 3.4% (+6.67)#83 | 3.8% (+6.22)#2,297 |
| 84. | 77597 | 10.0% | 3.4% (+6.66)#84 | 3.8% (+6.21)#2,302 |
| 85. | 79230 | 10.0% | 3.4% (+6.63)#85 | 3.8% (+6.18)#2,323 |
| 86. | 79064 | 10.0% | 3.4% (+6.60)#86 | 3.8% (+6.15)#2,340 |
| 87. | 79044 | 10.0% | 3.4% (+6.60)#87 | 3.8% (+6.15)#2,343 |
| 88. | 78343 | 10.0% | 3.4% (+6.59)#88 | 3.8% (+6.14)#2,347 |
| 89. | 79097 | 9.8% | 3.4% (+6.46)#89 | 3.8% (+6.01)#2,400 |
| 90. | 76261 | 9.8% | 3.4% (+6.44)#90 | 3.8% (+5.99)#2,413 |
| 91. | 76092 | 9.7% | 3.4% (+6.35)#91 | 3.8% (+5.90)#2,454 |
| 92. | 76884 | 9.6% | 3.4% (+6.25)#92 | 3.8% (+5.80)#2,519 |
| 93. | 78962 | 9.6% | 3.4% (+6.24)#93 | 3.8% (+5.79)#2,527 |
| 94. | 75076 | 9.6% | 3.4% (+6.22)#94 | 3.8% (+5.77)#2,542 |
| 95. | 79329 | 9.6% | 3.4% (+6.18)#95 | 3.8% (+5.73)#2,561 |
| 96. | 76380 | 9.5% | 3.4% (+6.08)#96 | 3.8% (+5.63)#2,617 |
| 97. | 75225 | 9.4% | 3.4% (+6.08)#97 | 3.8% (+5.63)#2,621 |
| 98. | 78257 | 9.4% | 3.4% (+6.02)#98 | 3.8% (+5.57)#2,645 |
| 99. | 78003 | 9.3% | 3.4% (+5.93)#99 | 3.8% (+5.48)#2,693 |
| 100. | 76519 | 9.3% | 3.4% (+5.91)#100 | 3.8% (+5.46)#2,706 |
Common Questions
What are the Top 10 Zip Codes with the Highest Percentage of Self-Employed / Incorporated in Texas?
Top 10 Zip Codes with the Highest Percentage of Self-Employed / Incorporated in Texas are:
What zip code has the Highest Percentage of Self-Employed / Incorporated in Texas?
76841 has the Highest Percentage of Self-Employed / Incorporated in Texas with 100.0%.
What is the Percentage of Self-Employed / Incorporated in the State of Texas?
Percentage of Self-Employed / Incorporated in Texas is 3.4%.
What is the Percentage of Self-Employed / Incorporated in the United States?
Percentage of Self-Employed / Incorporated in the United States is 3.8%.