Zip Codes with the Highest Percentage of Population with a Degree in Visual and Performing Arts in Gilmer, TX
RELATED REPORTS & OPTIONS
Visual and Performing Arts
Gilmer
Compare Zip Codes
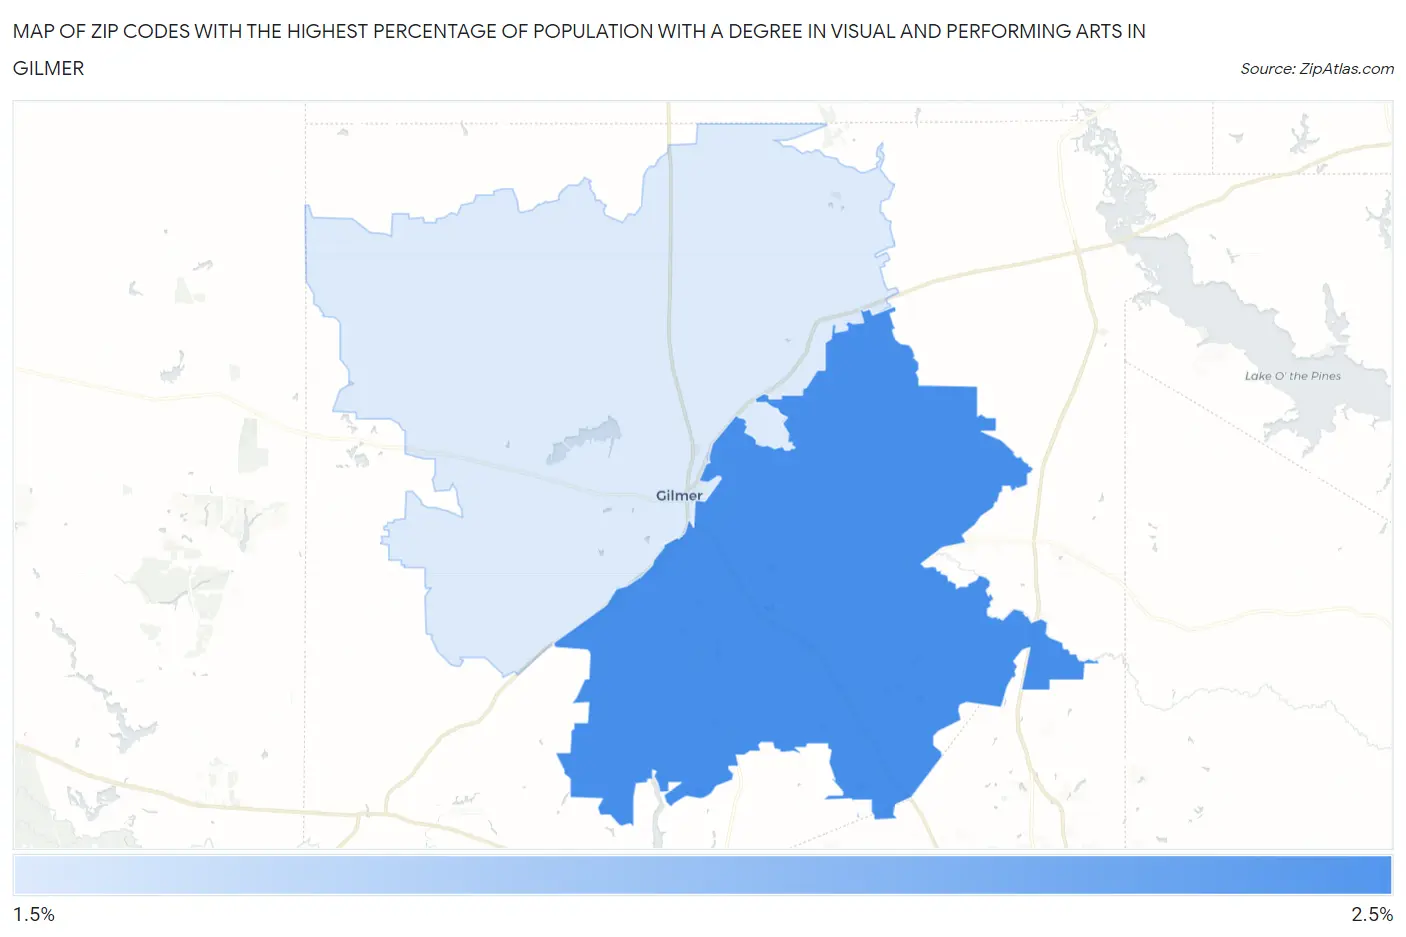
Map of Zip Codes with the Highest Percentage of Population with a Degree in Visual and Performing Arts in Gilmer
1.7%
2.1%
Zip Codes with the Highest Percentage of Population with a Degree in Visual and Performing Arts in Gilmer, TX
| Zip Code | % Graduates | vs State | vs National | |
| 1. | 75645 | 2.1% | 3.2%(-1.13)#842 | 4.3%(-2.17)#16,122 |
| 2. | 75644 | 1.7% | 3.2%(-1.54)#955 | 4.3%(-2.59)#17,617 |
1
Common Questions
What are the Top Zip Codes with the Highest Percentage of Population with a Degree in Visual and Performing Arts in Gilmer, TX?
Top Zip Codes with the Highest Percentage of Population with a Degree in Visual and Performing Arts in Gilmer, TX are:
What zip code has the Highest Percentage of Population with a Degree in Visual and Performing Arts in Gilmer, TX?
75645 has the Highest Percentage of Population with a Degree in Visual and Performing Arts in Gilmer, TX with 2.1%.
What is the Percentage of Population with a Degree in Visual and Performing Arts in Gilmer, TX?
Percentage of Population with a Degree in Visual and Performing Arts in Gilmer is 1.3%.
What is the Percentage of Population with a Degree in Visual and Performing Arts in Texas?
Percentage of Population with a Degree in Visual and Performing Arts in Texas is 3.2%.
What is the Percentage of Population with a Degree in Visual and Performing Arts in the United States?
Percentage of Population with a Degree in Visual and Performing Arts in the United States is 4.3%.