Zip Codes with the Highest Percentage of Population with a Degree in Social Sciences in Gilmer, TX
RELATED REPORTS & OPTIONS
Social Sciences
Gilmer
Compare Zip Codes
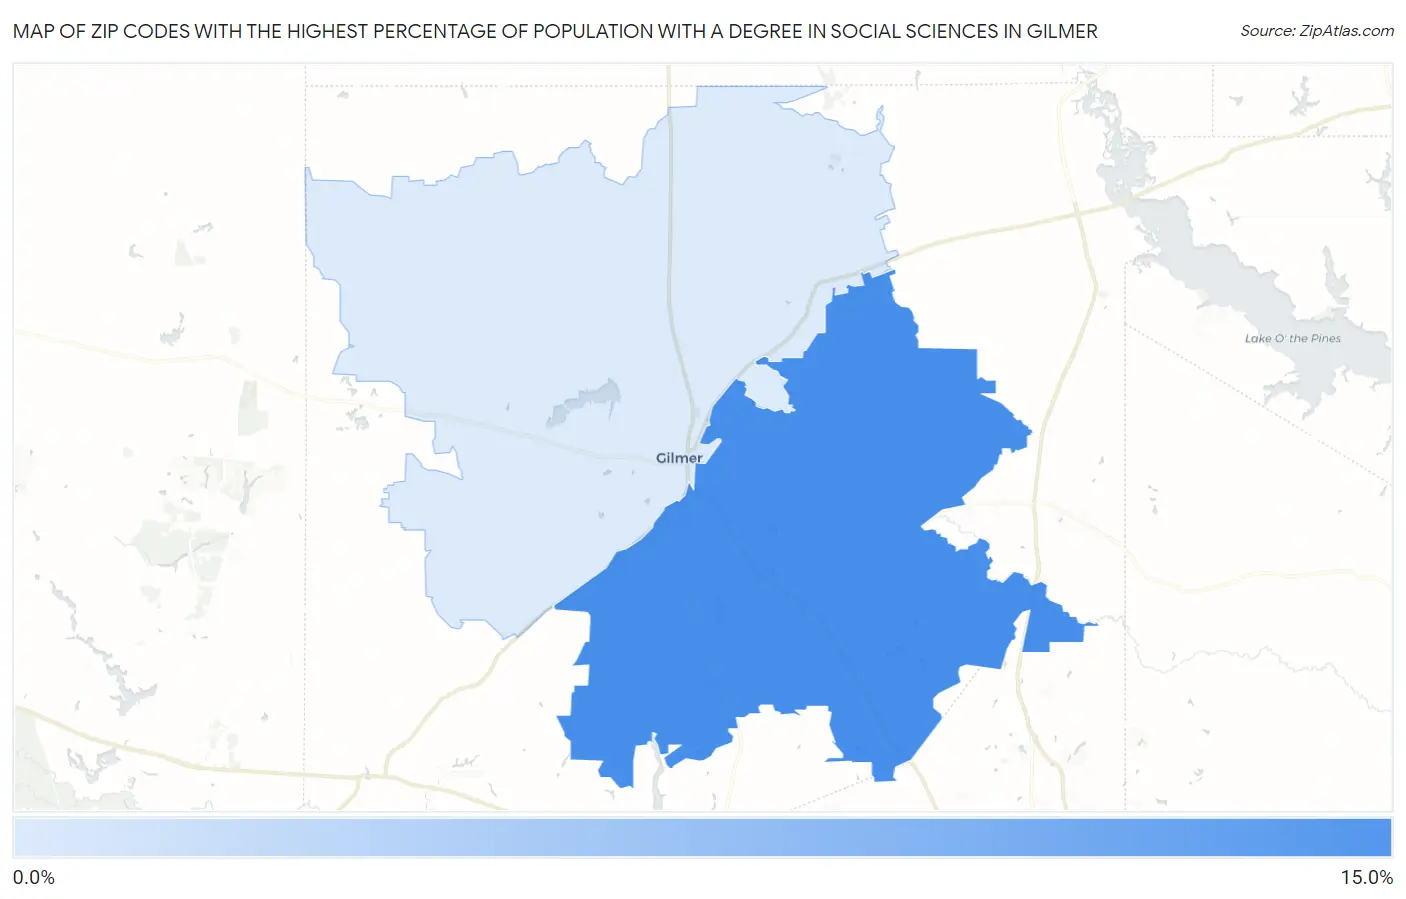
Map of Zip Codes with the Highest Percentage of Population with a Degree in Social Sciences in Gilmer
1.3%
11.8%
Zip Codes with the Highest Percentage of Population with a Degree in Social Sciences in Gilmer, TX
| Zip Code | % Graduates | vs State | vs National | |
| 1. | 75645 | 11.8% | 6.1%(+5.65)#112 | 8.1%(+3.71)#3,674 |
| 2. | 75644 | 1.3% | 6.1%(-4.84)#1,312 | 8.1%(-6.78)#23,231 |
1
Common Questions
What are the Top Zip Codes with the Highest Percentage of Population with a Degree in Social Sciences in Gilmer, TX?
Top Zip Codes with the Highest Percentage of Population with a Degree in Social Sciences in Gilmer, TX are:
What zip code has the Highest Percentage of Population with a Degree in Social Sciences in Gilmer, TX?
75645 has the Highest Percentage of Population with a Degree in Social Sciences in Gilmer, TX with 11.8%.
What is the Percentage of Population with a Degree in Social Sciences in Texas?
Percentage of Population with a Degree in Social Sciences in Texas is 6.1%.
What is the Percentage of Population with a Degree in Social Sciences in the United States?
Percentage of Population with a Degree in Social Sciences in the United States is 8.1%.