Zip Codes with the Highest Percentage of Population Employed in Legal Services & Support in Gilmer, TX
RELATED REPORTS & OPTIONS
Legal Services & Support
Gilmer
Compare Zip Codes
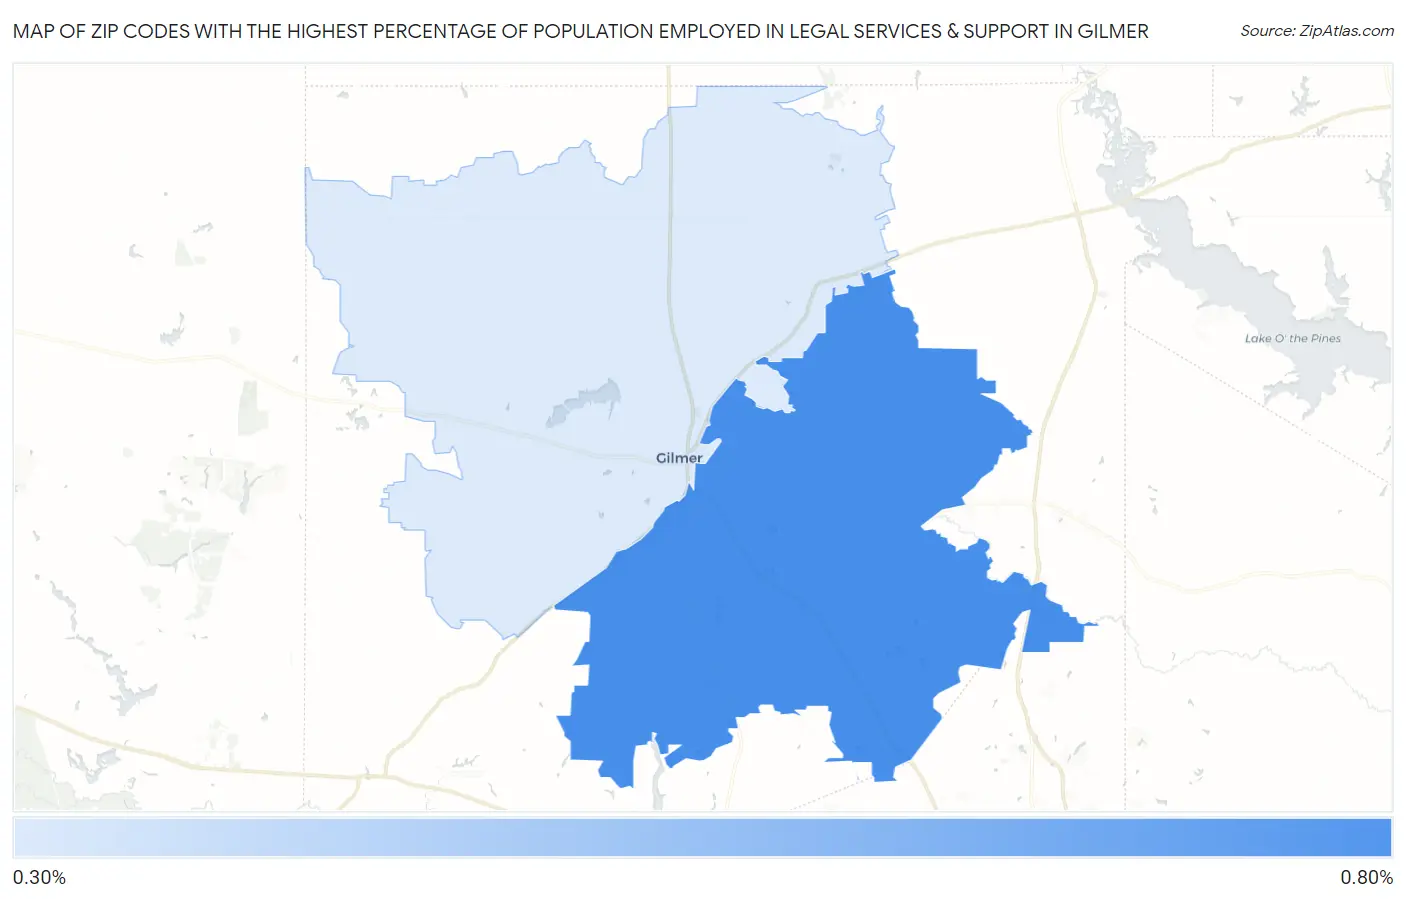
Map of Zip Codes with the Highest Percentage of Population Employed in Legal Services & Support in Gilmer
0.37%
0.68%
Zip Codes with the Highest Percentage of Population Employed in Legal Services & Support in Gilmer, TX
| Zip Code | % Employed | vs State | vs National | |
| 1. | 75645 | 0.68% | 1.0%(-0.329)#621 | 1.2%(-0.504)#10,614 |
| 2. | 75644 | 0.37% | 1.0%(-0.637)#865 | 1.2%(-0.812)#14,178 |
1
Common Questions
What are the Top Zip Codes with the Highest Percentage of Population Employed in Legal Services & Support in Gilmer, TX?
Top Zip Codes with the Highest Percentage of Population Employed in Legal Services & Support in Gilmer, TX are:
What zip code has the Highest Percentage of Population Employed in Legal Services & Support in Gilmer, TX?
75645 has the Highest Percentage of Population Employed in Legal Services & Support in Gilmer, TX with 0.68%.
What is the Percentage of Population Employed in Legal Services & Support in Gilmer, TX?
Percentage of Population Employed in Legal Services & Support in Gilmer is 2.5%.
What is the Percentage of Population Employed in Legal Services & Support in Texas?
Percentage of Population Employed in Legal Services & Support in Texas is 1.0%.
What is the Percentage of Population Employed in Legal Services & Support in the United States?
Percentage of Population Employed in Legal Services & Support in the United States is 1.2%.