Zip Codes with the Highest Percentage of Population Employed in Agriculture, Fishing & Hunting in Gilmer, TX
RELATED REPORTS & OPTIONS
Agriculture, Fishing & Hunting
Gilmer
Compare Zip Codes
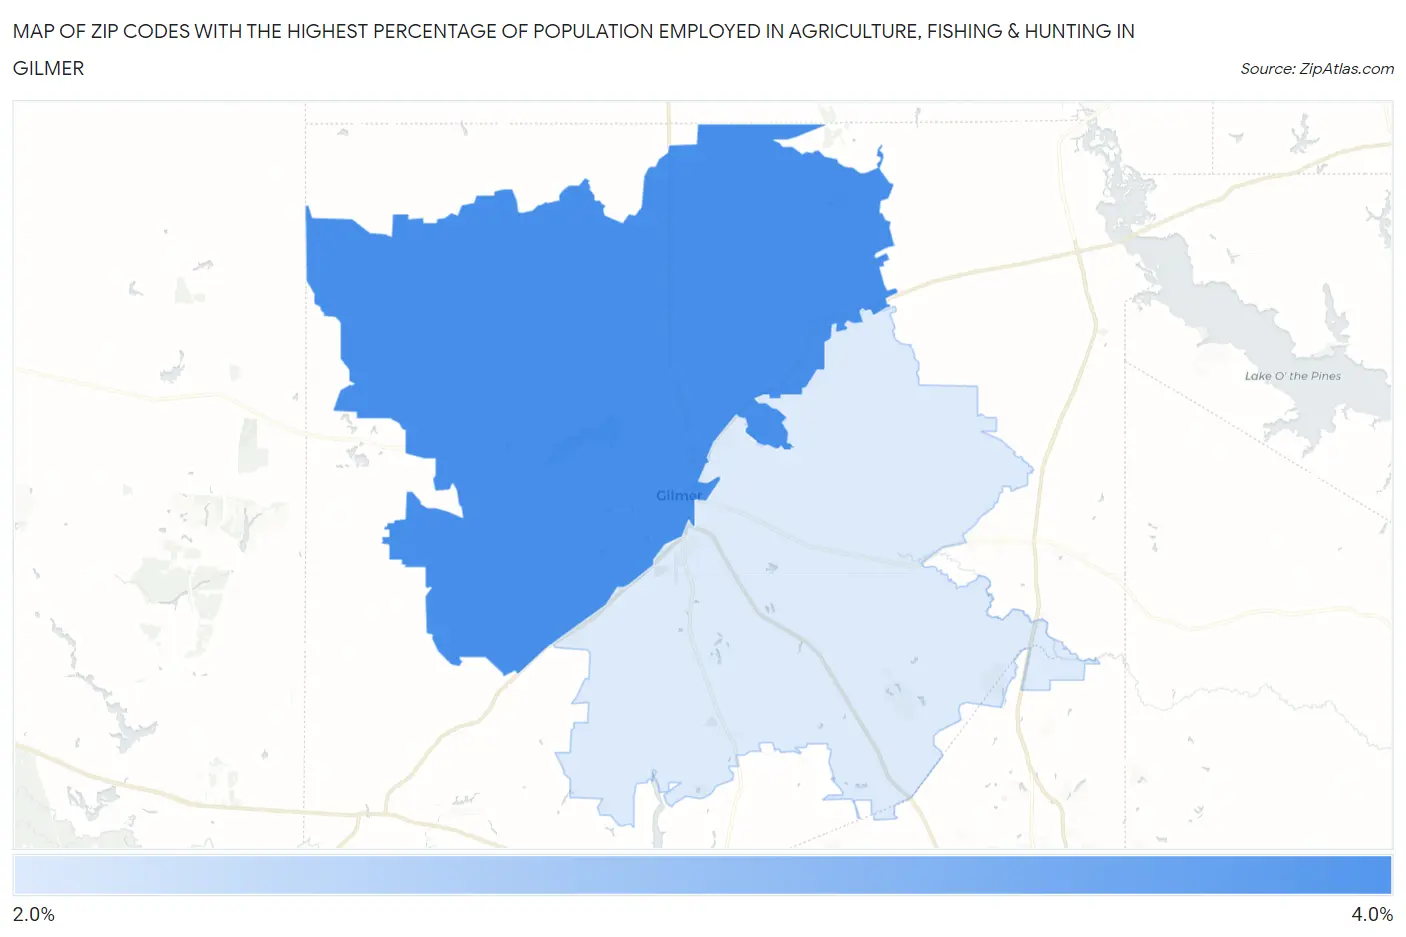
Map of Zip Codes with the Highest Percentage of Population Employed in Agriculture, Fishing & Hunting in Gilmer
2.4%
3.2%
Zip Codes with the Highest Percentage of Population Employed in Agriculture, Fishing & Hunting in Gilmer, TX
| Zip Code | % Employed | vs State | vs National | |
| 1. | 75644 | 3.2% | 0.75%(+2.44)#536 | 1.2%(+1.99)#10,237 |
| 2. | 75645 | 2.4% | 0.75%(+1.63)#616 | 1.2%(+1.18)#11,851 |
1
Common Questions
What are the Top Zip Codes with the Highest Percentage of Population Employed in Agriculture, Fishing & Hunting in Gilmer, TX?
Top Zip Codes with the Highest Percentage of Population Employed in Agriculture, Fishing & Hunting in Gilmer, TX are:
What zip code has the Highest Percentage of Population Employed in Agriculture, Fishing & Hunting in Gilmer, TX?
75644 has the Highest Percentage of Population Employed in Agriculture, Fishing & Hunting in Gilmer, TX with 3.2%.
What is the Percentage of Population Employed in Agriculture, Fishing & Hunting in Gilmer, TX?
Percentage of Population Employed in Agriculture, Fishing & Hunting in Gilmer is 3.2%.
What is the Percentage of Population Employed in Agriculture, Fishing & Hunting in Texas?
Percentage of Population Employed in Agriculture, Fishing & Hunting in Texas is 0.75%.
What is the Percentage of Population Employed in Agriculture, Fishing & Hunting in the United States?
Percentage of Population Employed in Agriculture, Fishing & Hunting in the United States is 1.2%.