Zip Codes with the Highest Percentage of Population Employed in Professional & Scientific Services in Gilmer, TX
RELATED REPORTS & OPTIONS
Professional & Scientific Services
Gilmer
Compare Zip Codes
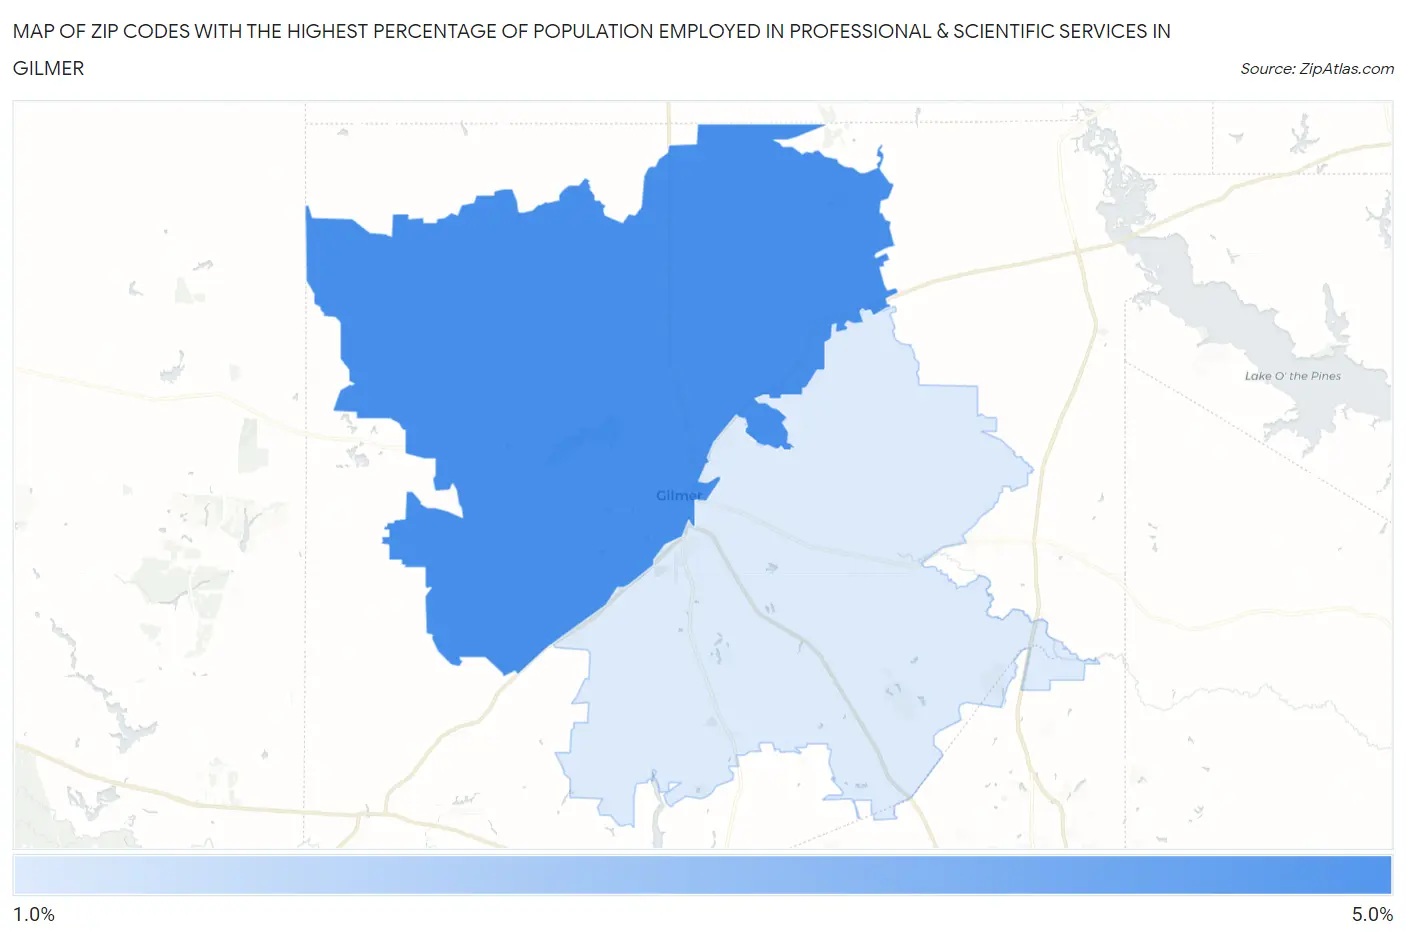
Map of Zip Codes with the Highest Percentage of Population Employed in Professional & Scientific Services in Gilmer
1.7%
4.1%
Zip Codes with the Highest Percentage of Population Employed in Professional & Scientific Services in Gilmer, TX
| Zip Code | % Employed | vs State | vs National | |
| 1. | 75644 | 4.1% | 7.6%(-3.54)#888 | 7.8%(-3.78)#14,924 |
| 2. | 75645 | 1.7% | 7.6%(-5.95)#1,356 | 7.8%(-6.20)#23,068 |
1
Common Questions
What are the Top Zip Codes with the Highest Percentage of Population Employed in Professional & Scientific Services in Gilmer, TX?
Top Zip Codes with the Highest Percentage of Population Employed in Professional & Scientific Services in Gilmer, TX are:
What zip code has the Highest Percentage of Population Employed in Professional & Scientific Services in Gilmer, TX?
75644 has the Highest Percentage of Population Employed in Professional & Scientific Services in Gilmer, TX with 4.1%.
What is the Percentage of Population Employed in Professional & Scientific Services in Gilmer, TX?
Percentage of Population Employed in Professional & Scientific Services in Gilmer is 8.0%.
What is the Percentage of Population Employed in Professional & Scientific Services in Texas?
Percentage of Population Employed in Professional & Scientific Services in Texas is 7.6%.
What is the Percentage of Population Employed in Professional & Scientific Services in the United States?
Percentage of Population Employed in Professional & Scientific Services in the United States is 7.8%.