Zip Codes with the Highest Percentage of Population Employed in Mining, Quarrying, & Extraction in Gilmer, TX
RELATED REPORTS & OPTIONS
Mining, Quarrying, & Extraction
Gilmer
Compare Zip Codes
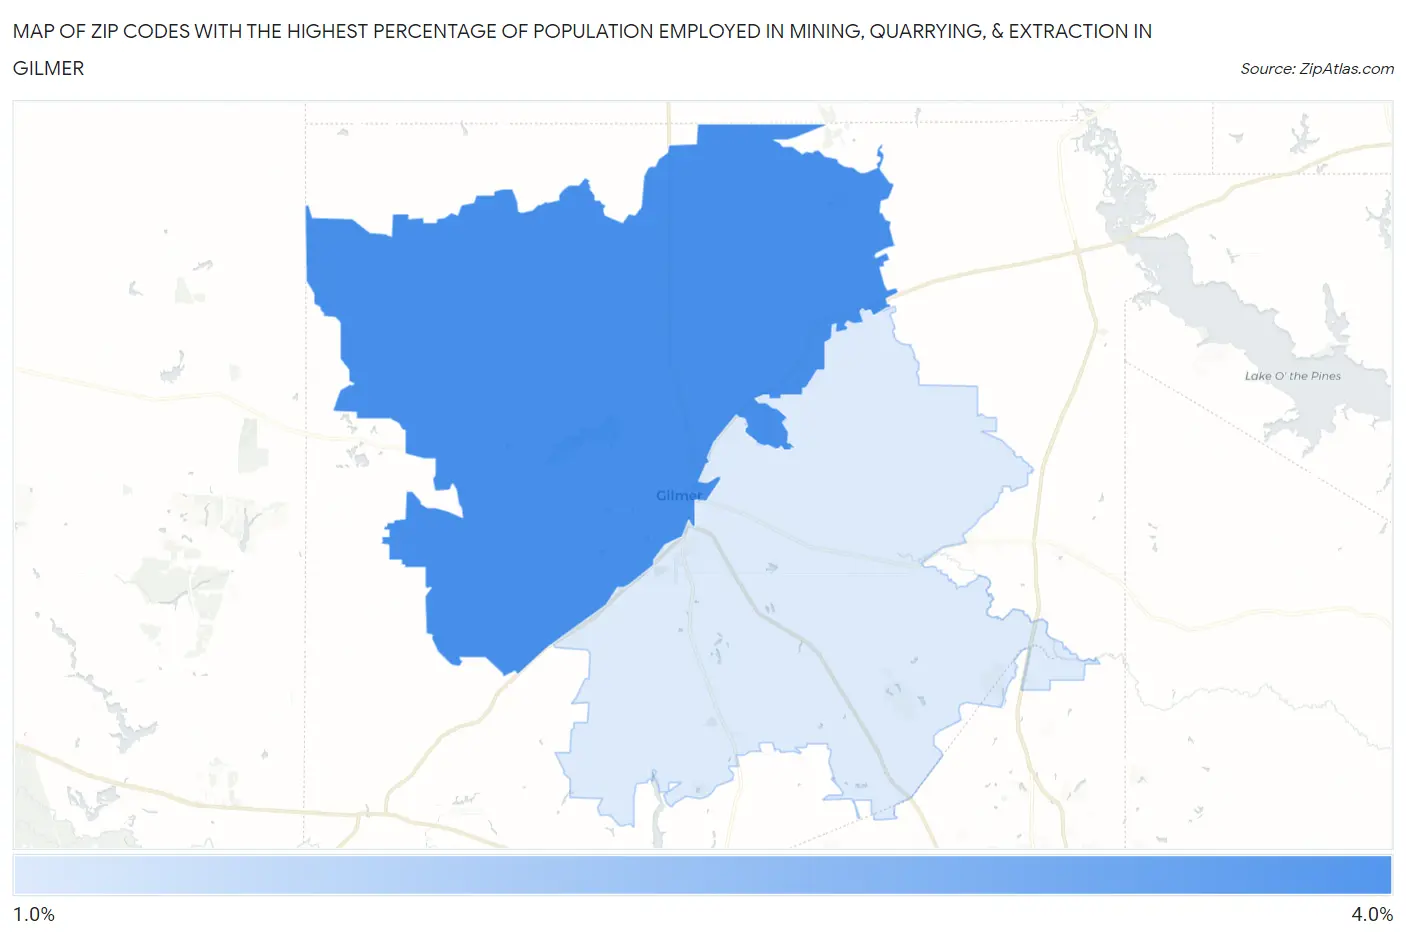
Map of Zip Codes with the Highest Percentage of Population Employed in Mining, Quarrying, & Extraction in Gilmer
1.2%
3.3%
Zip Codes with the Highest Percentage of Population Employed in Mining, Quarrying, & Extraction in Gilmer, TX
| Zip Code | % Employed | vs State | vs National | |
| 1. | 75644 | 3.3% | 1.9%(+1.42)#469 | 0.44%(+2.84)#2,562 |
| 2. | 75645 | 1.2% | 1.9%(-0.616)#853 | 0.44%(+0.798)#4,829 |
1
Common Questions
What are the Top Zip Codes with the Highest Percentage of Population Employed in Mining, Quarrying, & Extraction in Gilmer, TX?
Top Zip Codes with the Highest Percentage of Population Employed in Mining, Quarrying, & Extraction in Gilmer, TX are:
What zip code has the Highest Percentage of Population Employed in Mining, Quarrying, & Extraction in Gilmer, TX?
75644 has the Highest Percentage of Population Employed in Mining, Quarrying, & Extraction in Gilmer, TX with 3.3%.
What is the Percentage of Population Employed in Mining, Quarrying, & Extraction in Texas?
Percentage of Population Employed in Mining, Quarrying, & Extraction in Texas is 1.9%.
What is the Percentage of Population Employed in Mining, Quarrying, & Extraction in the United States?
Percentage of Population Employed in Mining, Quarrying, & Extraction in the United States is 0.44%.