Zip Codes with the Highest Percentage of Population Employed in Sales & Related in Gilmer, TX
RELATED REPORTS & OPTIONS
Sales & Related
Gilmer
Compare Zip Codes
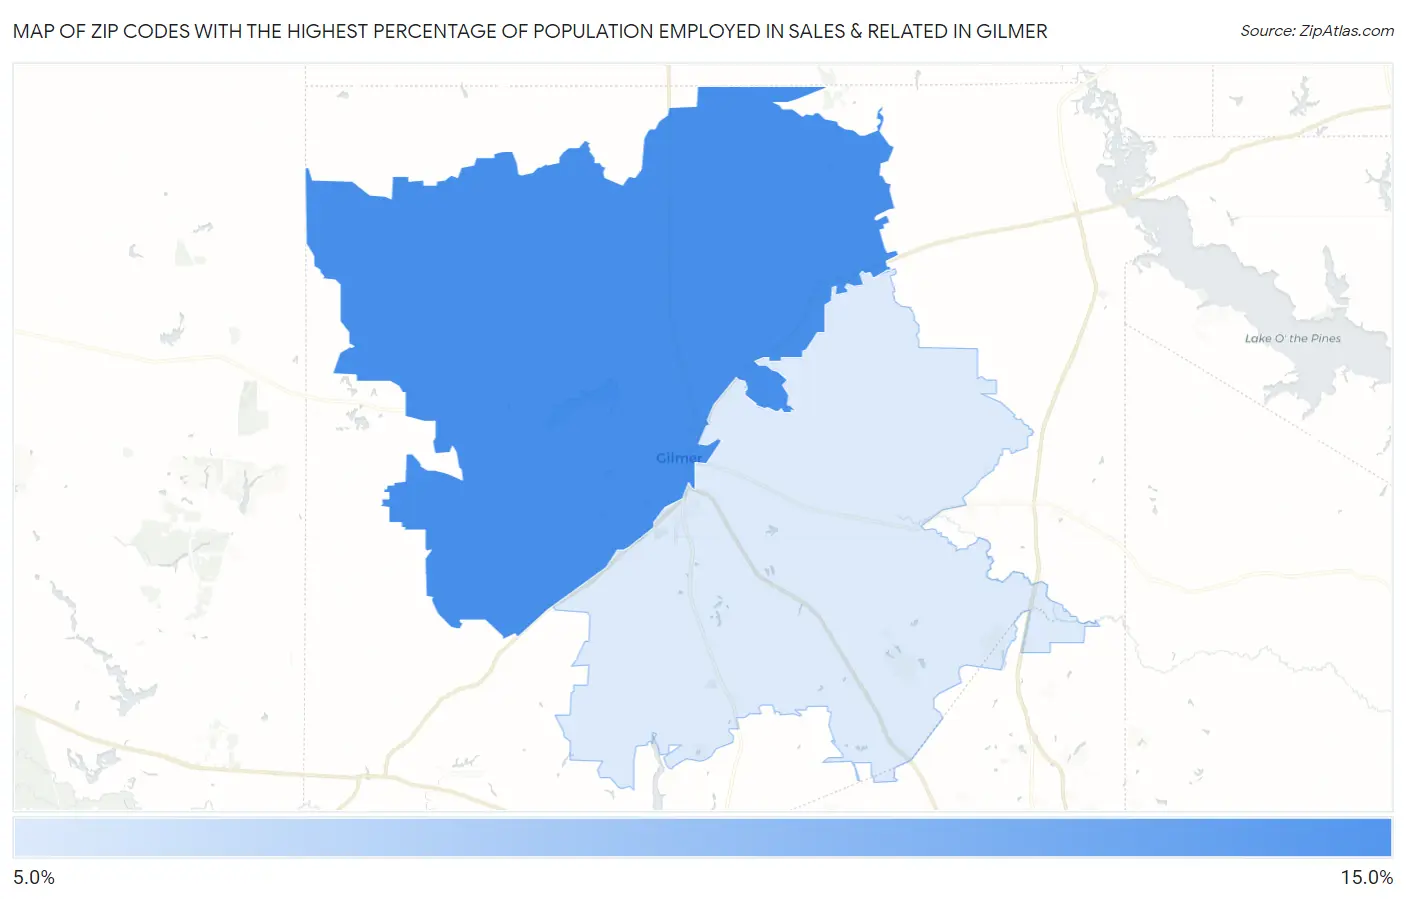
Map of Zip Codes with the Highest Percentage of Population Employed in Sales & Related in Gilmer
7.9%
12.4%
Zip Codes with the Highest Percentage of Population Employed in Sales & Related in Gilmer, TX
| Zip Code | % Employed | vs State | vs National | |
| 1. | 75644 | 12.4% | 10.2%(+2.19)#374 | 9.6%(+2.81)#5,316 |
| 2. | 75645 | 7.9% | 10.2%(-2.31)#1,212 | 9.6%(-1.68)#18,313 |
1
Common Questions
What are the Top Zip Codes with the Highest Percentage of Population Employed in Sales & Related in Gilmer, TX?
Top Zip Codes with the Highest Percentage of Population Employed in Sales & Related in Gilmer, TX are:
What zip code has the Highest Percentage of Population Employed in Sales & Related in Gilmer, TX?
75644 has the Highest Percentage of Population Employed in Sales & Related in Gilmer, TX with 12.4%.
What is the Percentage of Population Employed in Sales & Related in Gilmer, TX?
Percentage of Population Employed in Sales & Related in Gilmer is 9.8%.
What is the Percentage of Population Employed in Sales & Related in Texas?
Percentage of Population Employed in Sales & Related in Texas is 10.2%.
What is the Percentage of Population Employed in Sales & Related in the United States?
Percentage of Population Employed in Sales & Related in the United States is 9.6%.