Zip Codes with the Highest Percentage of Population with a Degree in Engineering in Gilmer, TX
RELATED REPORTS & OPTIONS
Engineering
Gilmer
Compare Zip Codes
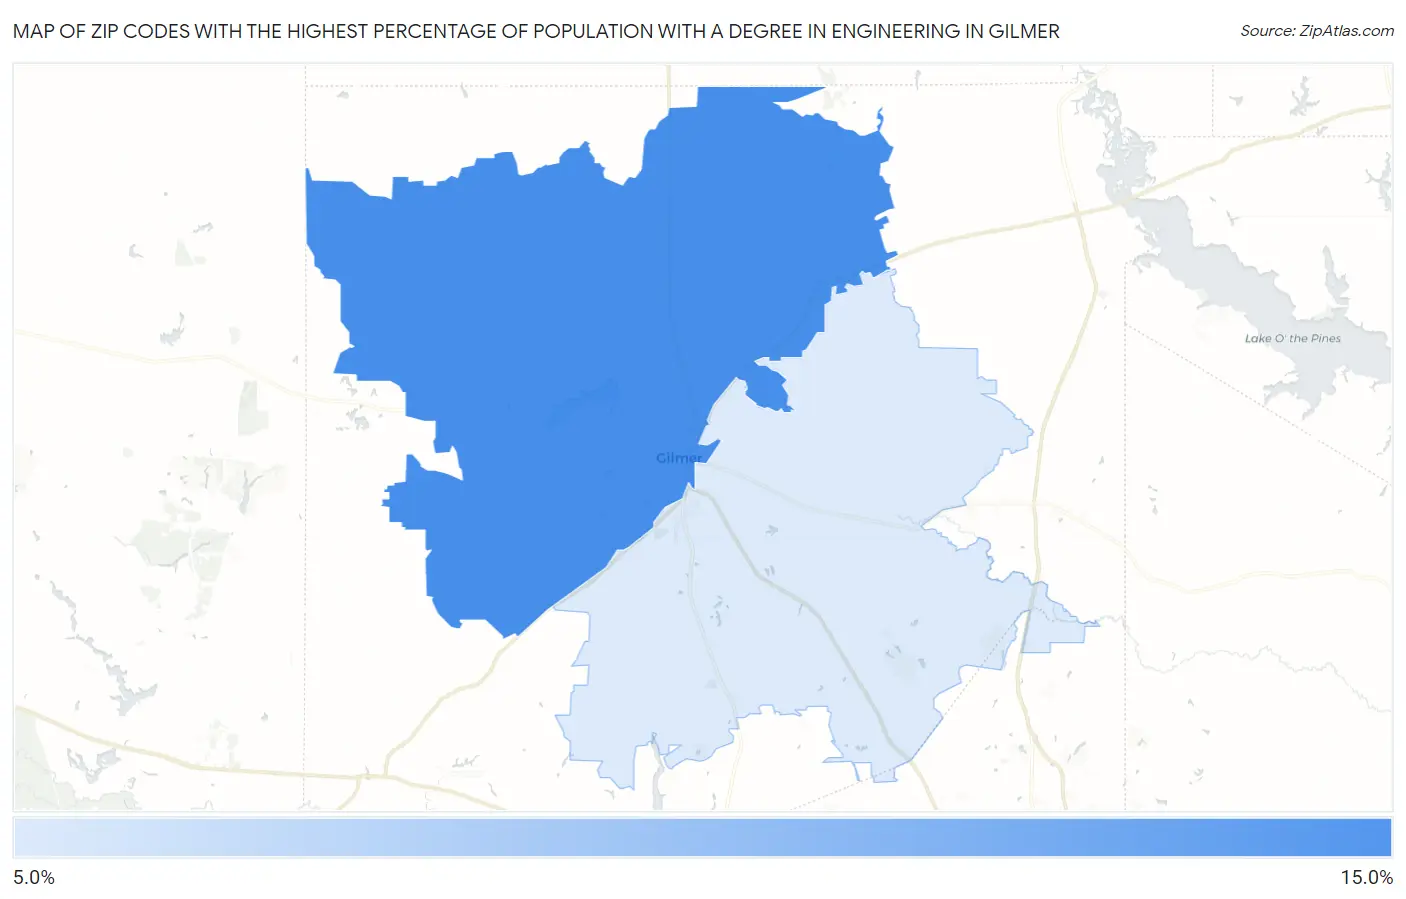
Map of Zip Codes with the Highest Percentage of Population with a Degree in Engineering in Gilmer
7.8%
14.0%
Zip Codes with the Highest Percentage of Population with a Degree in Engineering in Gilmer, TX
| Zip Code | % Graduates | vs State | vs National | |
| 1. | 75644 | 14.0% | 9.5%(+4.46)#164 | 7.6%(+6.36)#2,009 |
| 2. | 75645 | 7.8% | 9.5%(-1.78)#556 | 7.6%(+0.111)#7,513 |
1
Common Questions
What are the Top Zip Codes with the Highest Percentage of Population with a Degree in Engineering in Gilmer, TX?
Top Zip Codes with the Highest Percentage of Population with a Degree in Engineering in Gilmer, TX are:
What zip code has the Highest Percentage of Population with a Degree in Engineering in Gilmer, TX?
75644 has the Highest Percentage of Population with a Degree in Engineering in Gilmer, TX with 14.0%.
What is the Percentage of Population with a Degree in Engineering in Gilmer, TX?
Percentage of Population with a Degree in Engineering in Gilmer is 2.3%.
What is the Percentage of Population with a Degree in Engineering in Texas?
Percentage of Population with a Degree in Engineering in Texas is 9.5%.
What is the Percentage of Population with a Degree in Engineering in the United States?
Percentage of Population with a Degree in Engineering in the United States is 7.6%.